Venezuelan Immigration Trends,
Challenges, and Possibilities for
         Integration
←
→
Page content transcription
If your browser does not render page correctly, please read the page content below
Venezuelan Immigration Trends,
Challenges, and Possibilities for
IntegrationVenezuelan Immigration Trends, Challenges, and Possibilities for
Integration1
“El tema ahora es dar el salto y modernizarnos en el tema de regularización migratoria…
Vamos hacia la integración, tenemos que trabajar en esto, es la obligación.” 2
Introduction
The Colombian government’s commitment to integrate Venezuelan migrants as a group
in its society represents a strategic and valuable opportunity to focus on social inclusion
in the Americas. The steps to deal with integration, however, depend on the specific,
differentiated needs of the immigrant community. These steps can be replicated and
can contribute to important changes for Venezuelans and migrant host countries in the
region.
This memo presents an analysis of Venezuelan migrants in Colombia, looking at their
characterization, condition, and transnational ties.
Venezuela’s political and economic crises have included a large outmigration of people
to several countries, primarily to Colombia. The rapid influx of Venezuelans caught
Colombia unprepared, creating distortions in the entire governance system and
affecting national, regional, and municipal public policy, 3 particularly because the
majority of migrants arrived in vulnerable conditions. This population is perhaps the
second largest minority group in Colombia after Afro-Colombians.
In order to explore a pathway to integration, we analyzed the characteristics of this
population, the factors that shape those that are more fragile in the process of
regularization, and the opportunities to leverage existing capabilities and resources of
migrants themselves.
The findings are based on a random survey of 1,061 Venezuelans in five cities and
include three important insights: 4
• Regardless of how migrants arrived (through formal or informal crossings), their
gender, income, or education level, the primary reason given for leaving
Venezuela is economic hardship.
1 Manuel Orozco, Center for Migration and Economic Stabilization, Creative Associates International, Washington,
DC, January 2021.
2 Lucas Gomez, Manager of the Border in Colombia. October 26, 2020. La Opinion and Estoy en la Frontera.
3 For a review of current government efforts see, Acoger, Integrar y Crecer: Las Politicas de Colombia frente a la
Migración Proveniente de Venezuela. Diciembre 2020, Presidencia de Colombia, Felipe Muñoz Coordinador
Editorial.
4 The survey included 1061 person to person interviews in five cities across the country, Barranquilla, Bogota, Cali,
Cucuta, and Medellin, which comprise 38% of all Venezuelans in Colombia. A total of 27 questions about reasons to
migrate, intention to stay or return, remittance transfers, demographics, hardship and digital connectivity.
Interviewers using street intercept method in areas of migrant concentration in the respective cities.
1• One-third of Venezuelans surveyed are the considered to be in the most fragile
state, meaning they lack regular immigration status, sufficient income, and
identity papers. Their fragility is shaped by their age, type of work, and lack of
access to financial and government services.
• The majority of migrants maintain strong transnational ties, and those who plan
to stay in Colombia have more robust engagement back home than those who
want to return.
Characterization of Venezuelans in Colombia
Between 2015 and 2017, Colombia was overwhelmed by an influx of Venezuelans; their
immigration increased tenfold from less than 40,000 to 400,000. By 2020, the number
increased to 1.8 million — a number that excludes the thousands of others who crossed
the country’s borders to continue on to other destinations. 5 Of the estimated 5 million
Venezuelans worldwide, nearly 2 million are in Colombia. Moreover, the United Nations
expects another outmigration wave that may include more Venezuelans crossing into
Colombia this year. 6
The characteristics of this population do not suggest a wholly homogeneous group.
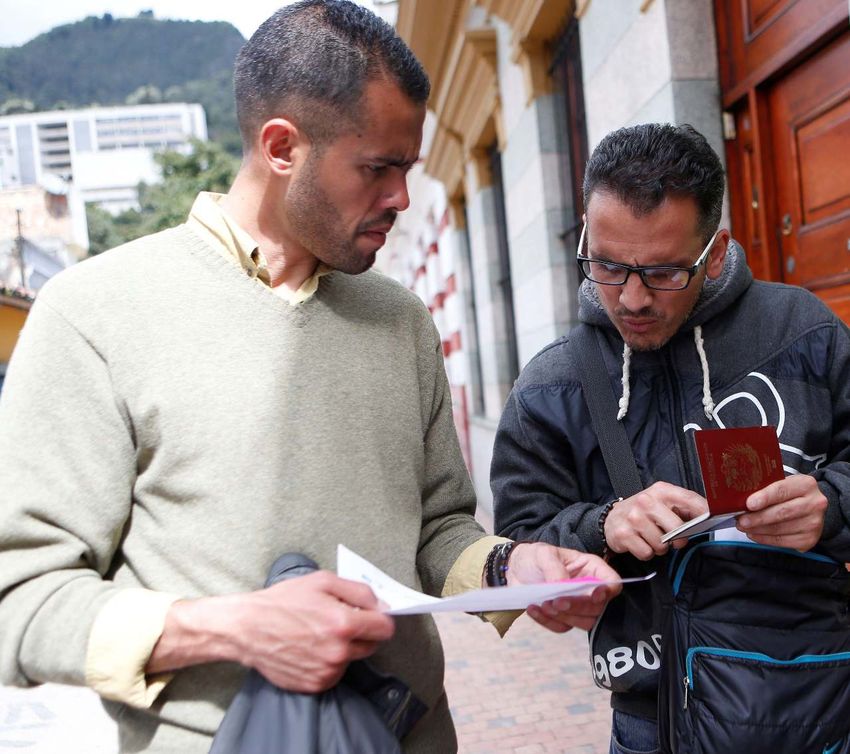
Arrival: Most migrants interviewed say they came to Colombia through the formally
established border posts. However, 37% said they crossed the border through informal
trochas, especially those living in urban areas like Bogotá or Medellín. The reasons for
migrating are both economic and political. Asked to list all reasons that apply, 52% said
they left Venezuela due to economic reasons (high cost of living, unemployment and,
primarily, food scarcity), 38% cited insecurity, and 22% claimed political reasons. One
key insight is that these responses did not change across gender, education level, legal
status, or method of entry into the country.
Moreover, this migration is indeed a dispersion. Only 33% of those surveyed emigrated
alone and left their family in Venezuela. The rest have relatives in other countries. 37%
have family in both Colombia and Venezuela; 18% have family in other countries
outside of Venezuela and Colombia; and 10% already had family settled in Colombia
when they arrived. This dispersion in the Colombian case is rather recent but significant,
given the large number of migrants who have entered the country. By the end of 2020,
Venezuelans made up 4% of Colombia’s population; two years earlier, they made up
less than 1%. In fact, 75% of those surveyed arrived in Colombia after late 2017.
Settling: Once in Colombia, migrants attest to feeling at ease in the country. Three-
quarters of respondents feel well received. However, two-thirds of respondents said
finding a job has been the most difficult experience while in the country, followed by
finding housing (16%) and getting their legal papers processed (12%). While most
5 Migración Colombia Infografía. https://www.migracioncolombia.gov.co/infografias/radiografia-venezolanos-en-
colombia-corte-a-30-de-octubre-de-2020
6 Regional Refugee and Migrant Response Plan January - December 2021, R4V, p.99.
2migrants have a job, only 18% are contributing taxes because most migrants work in the
informal economy or for employers that do not enroll them in the social security system.
Less than 10% get actual payroll deductions, even though a larger percentage should.
These numbers matter, especially because most Venezuelans in Colombia (63%) say
they want to stay rather than return (27%) to their home country or go to a third country
(10%).
Other important characteristics of Venezuelan migrants are that they are predominantly
young, under 35 (average age is 32), mostly men, and 44% have a university education,
practically double of the average Colombian population.
In Venezuela, 13% of them had professional occupations, 11% were students, and 6%
worked in personal services (like barbershops, etc.). In Colombia, their skills are
underutilized: Over 40% are working in the informal economy, 13% work in the service
industry (beauty salons, barbershops, shoe repair work), and only 4% are working in
professional occupations. In turn, their incomes are comparatively low at an average of
750,000 pesos per month (US$217). Colombians, on the other hand, earn around 1.25
million pesos a month (US$370).
Immigrant incorporation
The characteristics described above dovetail with migrants’ incorporation into the polity.
An oft ignored precursor to full immigrant integration into the host society is
incorporation, 7 the process by which a migrant establishes ties conducive to social
cohesion in the host country.
The attributes of this process include a mix of enabling circumstances in society, such
as having legal status to live in the country, establishing a formal or semi-formal
relationship with the state (contributing taxes, social security income, accessing
services), securing a job and housing, and forming a positive relationship within the
social environment. 8 Thus, we theorize that the key elements of incorporation into a
host country society are earning a living income, contributing to social security,
accessing government services, having a bank account, having legal status, possessing
identification documents, and feeling a positive social reception by host country
nationals. These aspects constitute a baseline for accessing opportunities or building
wealth in the host country.
7 Ponzo, Irene. Modes of migrant incorporation in contexts of socio-economic downward mobility, Journal of Ethnic
and Migration Studies Volume 44, 2018.
8 The concept of vulnerability is often utilized in reference to a condition in which people are at risk of being harmed,
physically, emotionally, or materially. Economic vulnerability refers to a condition by which an individual or groups
are in a weak position in society to build assets and improve their material circumstances. See for example, Orozco,
Manuel, “Economic Status and Remittance Behavior Among Latin American and Caribbean Migrants in the Post-
recession Period” in Immigrant Vulnerability and Resilience: Comparative Perspectives on Latin American Immigrants
During the Great Recession, 2015. The OECD uses a similar set of metrics to measure migrant integration, see for
example, http://www.oecd.org/els/mig/indicatorsofimmigrantintegration.htm.
3Using the above components as metrics to measure a threshold of incorporation, 9 we
identify individuals as not fully incorporated if they meet three or fewer of those
characteristics. Those who meet four of the criteria are considered somewhat
incorporated, and those who meet five or more are considered to be in good standing.
More than half of those Venezuelans interviewed in Colombia had low incomes
(earnings 15% below the minimum wage), were not contributing to the social security
system, and had not accessed government services. Nearly 60% did not have a bank
account (a key pathway of economic inclusion), and just over 40% reported not having a
regular status (see Table 1).
Table 1: Key elements of incorporation, survey results
Factor Total
Income: Less than 750,000 pesos / month 82.6%
Social security: Does not contribute 81.6%
Government services: Has not received 66.2%
Bank account: Does not have 58.0%
Legal status: Does not have 41.9%
Identification documents: Does not have any 25.4%
Social Reception: Feels as if they have been treated very 24.6%
badly, badly, or ok by Colombians
Understanding what affects a fragile incorporation can offer insights into potential
interventions that better enable migrant integration. There are many elements that
contribute to a well-incorporated population, some of which may be demographic or
situational. The analysis of determinants of fragile incorporation point to important
insights: 10
• Not having at least a high school education increases the incorporation fragility
by 84%
• Working informally increases incorporation fragility by 169%
• Having less than two years in the country increases incorporation fragility by 47%
• Considering returning to Venezuela increases the incorporation fragility by 160%
• Those under 30 years old have a 72% probability of having a weak incorporation
• Not having a bank account increases incorporation fragility by 711%
• Not having access to government services, particularly from the migration
agency, increases incorporation fragility by 14%
• Having left Venezuela for political reasons increases incorporation fragility by
81%
9 Positive incorporation variables are (a) earnings above 750,000 pesos; (b) contributing to social security; (c) having
government issued identification papers; (d) owning a bank account; (e) having legal status in the country; (f) having
accessed and received government services; (g) feeling well or very well treated by Colombians.
10 A logit regression model was used, explaining 38% of all variables. The dependent variable used was not having
papers and incomes above 750,000 pesos. The table C in the annex shows the results.
4• Having problems getting legal paperwork in order to regularize increases
incorporation fragility by 39%
Transnational ties and the intention to stay
One important trend emerging from the immigrant experience is that in addition to being
dispersed, this diaspora, even under frail conditions, maintains strong transnational ties
back home. Those ties are household-to-household connections, including calling,
maintaining regular exchanges via social media, sending money, and even in-kind
material. 74% of Venezuelans send money to their relatives (of those, 70% send to
parents), and 10% send in-kind items like food.
Most remittance transactions to Venezuela are performed informally due to the absence
of a regularized payment network. However, increasingly, many Venezuelans digitally
transfer money to their relatives, using mobile wallets to send funds to personally owned
accounts. The average yearly person-to-person transactions add up to US$455 per
person and are 5% lower than what they were sending in 2019. 11
The aggregate volume is significant and amounts to at least US$400 million. From
Colombia, Venezuelan immigrants make 15 small transactions per year of around
US$30 each on average. This flow of money is a lifeline for at least 750,000
Venezuelan households.
Their ties are also secured through regular communication with families. Migrants
consume data to stay connected with their relatives back home. The transnational ties
are more relevant to those who want to stay in Colombia rather than with those who
want to return. Those who say they want to stay in Colombia send money, call their
families more frequently, and have family members only in Venezuela. Out of six
different indicators of engagement back home, 12 those seeking to stay are more
engaged and send more money back home (see Table 3).
Table 2: Scope of migrant transnational engagement
Plans to return or move
Degree of connection elsewhere Plans to stay
Somewhat connected 72.7% 60.6%
Regularly connected 24.4% 33.4%
Very connected or engaged 2.7% 5.0%
11Orozco, Manuel. Money Transfers to Venezuela, Washington, DC:2020
12Amount over 100,000 pesos, frequency sending over 13 times a year, calling back home more than once a week,
communicating via Facebook and WhatsApp.
5Table 3: Extent of migrant transnational engagement
Plans to return or move
Connection indicators elsewhere Plans to stay
Remittance amount sent (pesos) 84,185 113,276
Frequency per year 13 17
Amount paid for in kind (pesos) 88,767 132,744
Calls per week 1 2
Regular Facebook and other Yes Yes
social media use
WhatsApp contacts per week 6 5
Making integration work
The results of this study highlight important insights moving forward toward
regularization efforts. A pathway to regularization, as desired by the Colombian
government, can be better achieved through differentiated approaches to incorporating
the migrant population while focusing on those tools that can reach out to migrants
through existing vehicles: stepping up technology-based tools for government services
and social behavior, increasing financial access by removing barriers to entry, and
registering workers to the tax authority, for example.
The prevalence of remittances, albeit informal, also indicates the potential of creating a
formalized marketplace. Establishing more formal remittance channels could increase
payments sent by 15% and provide much-needed assistance to Venezuelan families
that may, in turn, better enable them to remain in their home communities.
6Annex – data
Table A: Reasons for leaving Venezuela
Reasons for leaving Method of arrival in Gender Age Education level
Venezuela
Colombia
Informal Official Female Male Under Over Did not Completed Total
crossing border 30 30 complete high
high school school
Insecurity 14.7% 15.3% 15.1% 15.1% 14.3% 15.8% 14.8% 15.4% 15.1%
Cost of living 18.3% 17.2% 17.3% 17.9% 17.6% 17.7% 17.2% 18.3% 17.7%
Job opportunities 7.5% 7.1% 7.1% 7.0% 8.1% 6.3% 9.9% 3.3% 7.2%
Unemployment 13.4% 17.0% 15.4% 16.0% 14.6% 16.8% 15.1% 16.4% 15.7%
Family reunification 3.3% 2.3% 3.0% 2.4% 2.6% 2.6% 2.5% 2.7% 2.6%
Political situation 22.7% 22.9% 23.2% 22.7% 23.5% 22.3% 22.0% 24.2% 22.9%
Access to food 19.9% 18.1% 18.7% 18.8% 19.0% 18.5% 18.3% 19.4% 18.8%
Other 0.1% 0.1% 0.2% 0.1% 0.3% 0.0% 0.1% 0.2% 0.1%
Total 100.0% 100.0% 100.0% 100.0% 100.0% 100.0% 100.0% 100.0% 100.0%
Table B: Family dispersion
Location of family Method of arrival in Gender Age Education level
members
Colombia
Unofficial Official Female Male Under Over Did not complete Completed Total
border border 30 30 high school high
school
Doesn’t know 0.0% 0.2% 0.3% 0.0% 0.0% 0.2% 0.0% 0.2% 0.1%
Most in different 7.5% 8.0% 10.8% 6.1% 8.5% 7.4% 6.0% 10.3% 8.0%
countries
7Most are in 11.9% 10.1% 9.7% 11.9% 10.8% 10.9% 8.2% 14.0% 10.9%
Venezuela, but some
are in other countries
We’re half and half 35.6% 38.8% 35.7% 38.4% 36.9% 38.0% 37.4% 37.3% 37.4%
between Venezuela
and Colombia
Most are in Colombia 9.4% 11.2% 11.1% 9.4% 10.4% 10.7% 12.0% 9.0% 10.6%
Most are in 35.6% 31.6% 32.4% 34.2% 33.3% 32.9% 36.4% 29.3% 33.1%
Venezuela
Table C: Challenges of settling in Colombia
Most difficult Barranquilla Bogotá Cali Cúcuta Medellín Total
part of living in
Colombia
Finding work 54.70% 76.50% 16.00% 100.00% 65.50% 67.20%
Finding housing 22.00% 16.30% 28.00% 0.00% 15.50% 15.50%
People are 2.70% 3.20% 1.30% 0.00% 6.10% 2.60%
unfriendly
Securing papers 10.00% 2.30% 54.00% 0.00% 8.80% 11.70%
(PEP, visa,
license, etc.)
Getting services 1.30% 0.90% 0.00% 0.00% 4.10% 1.10%
I contracted 8.70% 0.30% 0.70% 0.00% 0.00% 1.50%
COVID-19
8You can also read