VERTICAL FARMING Leafy vegetables shelf life - NIREOS
←
→
Page content transcription
If your browser does not render page correctly, please read the page content below
HERA IPERSPETTRALE - APPLICATION NOTE   VERTICAL FARMING
                                        Leafy vegetables shelf life

                                           The monitoring of the degradation process of leafy vegetables enables
                                           the determination of their shelf life: a crucial characteristic to be studied
                                           for food safety.
                                           Through the use of the HERA hyperspectral camera it’s possible to
                                           detect senescence or illness signs in the sample’s spectra in advance
                                           with respect to visual monitoring of the plant. Interestingly, information
                                           about the chemical and nutrient composition of the sample can be
                                           derived from the spectral read-out, such as chlorophyll, anthocyanin
                                           and phenol concentration. Samples for this study were provided by
                                           Agricola Moderna, a vertical farm based in Milan.

                                           These features can be obtained by using both reflectance and
                                           fluorescence hyper spectral measurements.

                                        ADVANTAGES OF USING HERA

                                        • Staring technique (ideal for static
                                          objects)
                                        • High sensitivity
                                        • Fluorescence measurements
                                        • High spatial and spectral resolution
                                        • Plug & Play
                                        • Non destructive measurements
HERA IPERSPETTRALE - APPLICATION NOTE   VERTICAL FARMING
                                        Leafy vegetables shelf life

                                        EXPERIMENTAL SETUP

                                        The experimental setup is shown in Figure 1.
                                        The HERA camera is set on a tripod placed
                                        above the sample and the light source is
                                        composed of two 20 W halogen lamps.

                                        The HERA is connected via USB to a computer,
                                        in which the acquisition software enables the
                                        user to set measurement parameters such as
                                        integration time, number of averages, and
                                        spectral resolution.

                                        The focus and the iris aperture can be finely
                                        adjusted manually by using two sliders directly
                                        on the camera.

                                                                                                                Figure 1: Experimental setup for shelf
                                                                                                                life monitoring.
                                        RESULTS

                                        The degradation over time of mustard wasabina leaves was analyzed. During the
                                        overall measurements period (19 days post-harvest), the samples were kept in a
                                        box and stored in the refrigerator at 4°C. The experimental conditions as described
                                        in the previous paragraph were maintained constant throughout all the senescence
                                        process.

                                                                        1

                                                                       0.8
                                                    Intensity [a.u.]

                                                                       0.6                                              Day 1

                                                                                                                        Day 12
                                                                       0.4                                              Day 19

                                                                       0.2

                                                                        0
                                                                             500   600    700          800        900           1000
                                                                                         Wavelengths [nm]
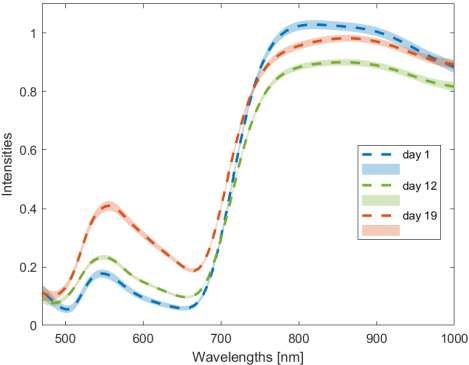
                                                    Figure 2: Reflectance spectra referring to a leaf in different days after harvesting.
HERA IPERSPETTRALE - APPLICATION NOTE   VERTICAL FARMING
                                        Leafy vegetables shelf life

                                        The spectra in Figure 2 are referred to the 1st, 12th and 19th day after harvesting.
                                        Senescence-related changes in the spectra are clearly visible. Firstly, the
                                        growth of the peak between 500 nm and 700 nm relates to the leaves’ hue shifting
                                        from green to yellow, as visually confirmed.

                                        Secondly, it’s possible to observe that the absorption in the infrared region around
                                        970 nm with respect to the plateau observed in the range 825 - 875 nm diminishes
                                        with time. Since one of the absorption peaks of water resides in that region this is
                                        most likely the sign that the leaf undergoes a process of dehydration during
                                        degradation, as it is actually confirmed by visual inspection of the sample (Figure
                                        4).

                                        To confirm this trend, a NIR index has been developed (Equation 1) comparing the
                                        intensity of the spectrum at the plateau and the absorption around 970 nm. The
                                        results confirm the reduced absorption around 970 nm (Figure 3).

                                                                                           ρ[825−875nm]
                                                                            NIRindex =
                                                                                           ρ[960−1000nm]
                                                                            Equation 1: NIR index formula.
                                                                 1.14

                                                                 1.13

                                                                                                             Day 1
                                                                 1.12                                        Day 5
                                                                                                             Day 12
                                                                                                             Day 16
                                                                 1.11                                        Day 19
                                                     NIR index

                                                                 1.1

                                                                 1.09

                                                                 1.08

                                                                 1.07
                                                                        1     5               12             16             19
                                                                                     Days after harvesting
                                                                             Figure 3: NIR absorption index.

                                                 Day 1                            Day 12                     Day 19

                                                Figure 4: RGB reconstruction of the monitored leaves.
                                                The colored squares refer to the areas analyzed for the NIR index calculation in Figure 3.
HERA IPERSPETTRALE - APPLICATION NOTE   VERTICAL FARMING
                                        Leafy vegetables shelf life

                                        FLUORESCENCE
                                        HYPERSPECTRAL IMAGING

                                        Thanks to its high sensitivity, it is very
                                        easy to measure fluorescence
                                        hyperspectral images with the HERA
                                        camera. The same samples used for
                                        reflectance measurements were
                                        excited via a 20 W blue LED at 400
                                        nm and a long pass filter was
                                        employed in detection to cut off the
                                        excitation light (experimental setup is
                                        shown in Figure 5). Fluorescence
                                        spectra related to the 1st, 12th and
                                        1 9 th d a y a fte r h a r v e s ti n g a r e
                                        displayed hereafter (Figure 6).                                         Figure 1: Experimental setup for fluorescence
                                                                                                                measurements.

                                        The principal peak at around 750 nm is related to the presence of chlorophylls in
                                        the leaf and, clearly, its degradation over time is detected. Instead, the secondary,
                                        smaller peak, is likely connected to phenols concentration. Phenolic compounds
                                        are responsible for the antioxidant properties of lettuce; however, their production
                                        is also connected to plant stress and senescence. Indeed, as displayed in Figure
                                        6, the phenolic peak increases over time as the sample in consideration degrades.

                                                                                                                 Chlorophylls-related
                                                                                                                 Peak

                                                                                                                                     Day 1

                                                                                                                                    Day 12
                                                Intensity [a.u.]

                                                                                                                                    Day 19

                                                                            Phenols-related
                                                                                      Peak

                                                                   300     400       500       600       700       800       900        1000    1100
                                                                                               Wavelengths [nm]
                                                                     Figure 6: Fluorescence spectra of the leaf in different days after harvesting.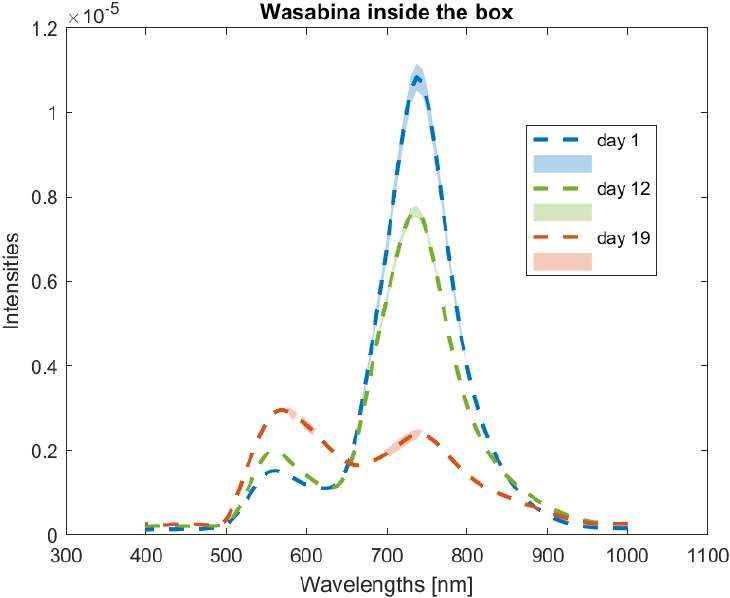
HERA IPERSPETTRALE - APPLICATION NOTE VERTICAL FARMING
Leafy vegetables shelf life
The results regarding the diminished chlorophyll concentration over time
obtained with fluorescence hyperspectral measurements were also validated
through analysis of the reflectance data. An index correlated to the chlorophyll
concentration was developed (Equation 2) and a reconstruction, based on this
index, of the analyzed leaves is displayed hereafter (Figure 7). As expected by
fluorescence measurements, the chlorophyll-related index shows that the
concentration of this molecule drops as the leaves degradate.
ρ[660−680nm]
Chlindex = 1 −
ρ[760−800nm]
Equation 2: Chlorophyll index formula.
1
1 1
1 1
1
0.95 0.95 0.95
50
0.9
0.9
50
0.9
0.9 50 0.9
0.9
100 0.85 0.85 0.85
0.8 0.8 0.8
100
0.8 0.8 100 0.8
150
0.75 0.75 0.75
150
200 0.7
0.7
0.7
0.7 150 0.7
0.7
0.65 0.65 0.65
200
250
0.6
0.6
0.6
0.6
200 0.6
0.6
300
Day 1 0.55 250 Day 12 0.55
Day 19 0.55
20 40 60 80 100 120 140 160 180 200
0.5
220
0.5
20 40 60
0.5
80 100 120 140 160 180 200 220
0.5
20 40 60 80 100 120 140 160
0.5
0.5
Figure 7: Chlorophyll index calculated over the monitored leaves.
More info on Agricola Moderna at https://agricolamoderna.com/
You can also read


