Visitor Demand Mapping for Queenstown - Update 1 - Published on Wednesday, June 3, 2020
←
→
Page content transcription
If your browser does not render page correctly, please read the page content below

Visitor Demand Mapping for Queenstown | 1

                                            Visitor Demand Mapping
                                             for Queenstown - Update 1
                                             Published on Wednesday, June 3, 2020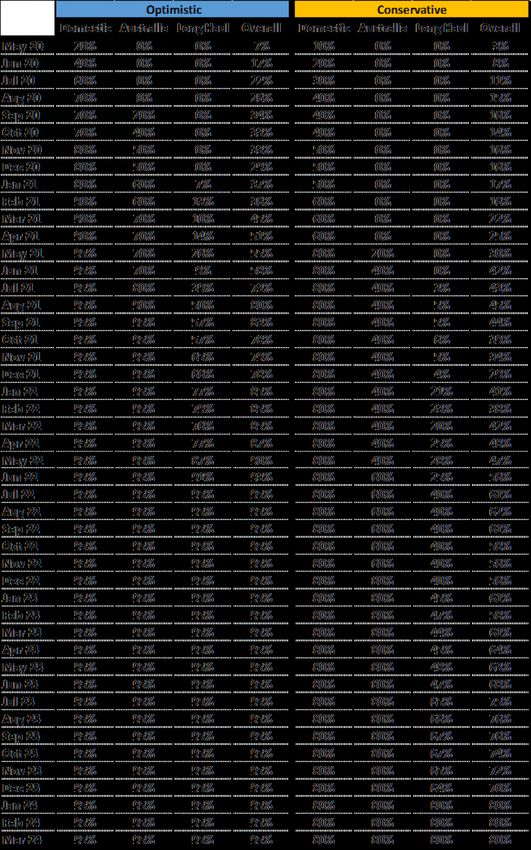
Visitor Demand Mapping for Queenstown | 2

                                            This is an update to the report on Visitor Demand Mapping for Queenstown-Lakes
                                            (2020 to 2024) published on Thursday, May 14, 2020. You can get the full version
                                            of the earlier report on this link.

                                            Recent developments to factors
                                             that impact visitation to Queenstown
                                             New Zealand economy
                                            Indicators of economic activity have recovered to being close to normal although the long term remains highly
                                            uncertain1. The post lock down “bounce back” in spend is expected to only be temporary as unemployment rises
                                            and falling asset values are likely to impact consumer spending for some time.

                                            Treasury issued a memorandum to the Macroeconomic Impact of Covid-19 report on the New Zealand economy,
                                            outlining that GDP growth is expected to be weaker in the first half of 2020 but will correct itself over the second
                                            half as the virus is contained, global growth picks up and supply conditions normalize.

                                            Treasury highlights that the most immediately and heavily impacted industry is tourism. ANZ centered its weekly
                                            focus around the tourism industry, highlighting that tourism will not return to pre-COVID levels for some time2.
                                            Pre-COVID tourism accounted for 10% of NZ GDP and while domestic tourism has restarted, specific regions will
                                            be disproportionately affected (exhibit 1) and New Zealand is particularly dependent on international tourism
                                            (exhibit 2).

                                             ANZ forecasts that reduction in tourism will result directly in a retraction in GDP for the coming year, of between
                                            -2.4% to -4.7%; which will have flow on effect to almost every industry in New Zealand.

                                            Australia economy
                                            It appears that the initial GDP hit from COVID-19 will be smaller in Australia than it will be in New Zealand3. The
                                            Reserve Bank of Australia has released a baseline scenario which is for a sharp GDP contraction in the June
                                            Quarter with recovery starting September. This will result in a -5% average GDP growth for 2020, bouncing
                                            back to a 4% growth in 2021. This is largely attributed to the extremity of the lockdown that New Zealand had in
                                            place in comparison to Australia – its estimated that 39% of New Zealand’s economy was shut at level four, unlike
                                            Australia, which never had the severity of level four restrictions, although restrictions did vary between states.

                                            Add into the equation the lower dependency on international tourism (which accounts for less than 2% of
                                            Australia’s total GDP) and Australia should be positioned for a faster recovery. Their “JobKeeper” wage subsidy,
                                            which had been expected to cost $130 billion, was recalculated to cost $70 billion, which frees up the difference
                                            for fiscal stimulus. However there are escalating tensions with China, its largest export partner, centering around
                                            increasing export tariffs. Australia’s AAA credit rating outlook was also cut to negative by Fitch Ratings Ltd,
                                            reflecting that like most of the world Australia is headed for an economic downturn4.

                                             USA Economy
                                            Despite many grim milestones such as reaching 100,000 COVID deaths, political unrest and protest in the USA,
                                            there are early indications of movements towards recovery. The stock market has shown a recovery, rallying
                                            in April and May and recovering many of the loses that occurred pre COVID (exhibit 3), but many caution this
                                            is based either on the assumption of quick recovery or the disconnect between markets and reality . Other
                                            indications like requests for direction on Apple maps, Hotel Occupancy Rates, and Air Travel T.S.A Screenings are
                                            starting to show a recovery as well (exhibit 4)6.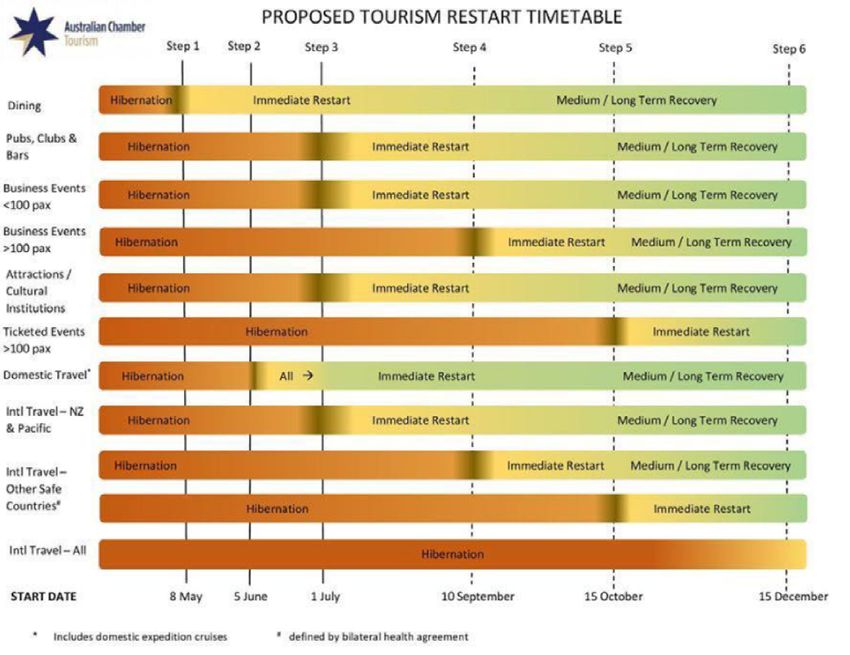
Visitor Demand Mapping for Queenstown | 3

                                            China Economy
                                            The world is closely monitoring China for early indications of what recovery could look like. Some encouraging
                                            data is now emerging - as lock-down restrictions have relaxed in China there has been a “V-Shaped” recovery in
                                            business confidence (exhibit 5). At the annual National People’s Congress, Premier Li delivered the Government
                                            Work Report focusing on building resilience in the economy to position toward growth. However, there has been
                                            no numerical GDP growth target set due to COVID related uncertainty and there is political protesting again in
                                            Hong Kong.

                                            Queenstown Lakes Economy
                                            For week ending 24th May 2020 weekly card spend and transactions have been increasing from level four lows.
                                            Compared to the same week last year spend and number of transactions for the week were down -24.6% (spend))
                                            (exhibit 6). In comparison to level four lockdown lows of -79.1% (spend) is a marked increase.7

                                            Global Aviation
                                            IATA is predicting that air travel will recover more slowly than the rest of the economy, expecting that revenue
                                            passenger kilometers (RPKs) will not recover to 2019 levels until 2023, two years behind the global GDP recovery
                                            projections (exhibit 7)8. They also are predicting that International RPKs will lag behind domestic air travel markets
                                            and international aviation will not recover until the second half of 2023 – 2024 (exhibit 8).

                                            At a global level bookings are starting to pick up, albeit from very low base levels, and focused on domestic travel.
                                            Despite travel restrictions remaining stringent, some markets are showing an increase in travel bookings, in China
                                            for example this has increased 10% vs the previous week9.

                                            Domestic Aviation
                                            At Air New Zealand’s investor update last week, they announced that their network capacity is expected to be
                                            approximately 50% lower than the prior comparative period, driven but a reduction of approximately 90% in the
                                            fourth quarter, and they are expecting to report an underlying loss for the 2020 financial year10. The domestic
                                            flight schedule into Queenstown is starting to recover seeing the return of the Wellington to Queenstown flights
                                            for Queen’s Birthday Weekend.

                                            Epidemiology
                                            The COVID-19 pandemic has infected more than 6.2 million people and spread to more than 180 countries
                                            resulting in lockdowns, halts on international travel, mass layoffs and battered financial markets. Some countries,
                                            such as China and New Zealand have “flattened the curve” while other’s daily case numbers increase to continue
                                            (exhibit 9).

                                            The biomedical community continue to work at an accelerated pace in the search for a vaccine and rapid testing.
                                            The World Health Organization has implemented a draft landscape blue print to monitor the vaccine related
                                            developments and currently have recorded 10 candidates as being in clinical evaluation11. Last week New
                                            Zealand joined the global search for a vaccine with the Government allocating $37 million for the development of
                                            a vaccine, $10 million of which will be for domestic research and development12.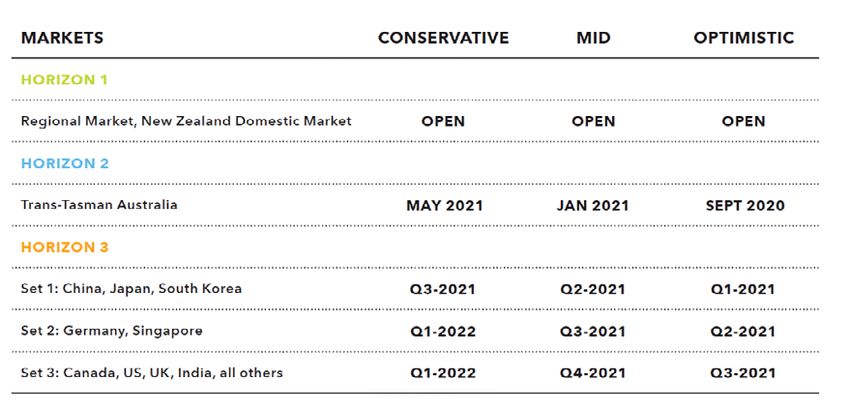
Visitor Demand Mapping for Queenstown | 4

                                            Domestic Market
                                            As New Zealander’s regain freedom to move around the country, Queenstown is ranking as a popular destination.
                                            More than 1.22 million Kiwis plan to holiday domestically within 12 months, and of that an estimated 812,500
                                            people would like to visit the Queenstown region in that time13. AirBnB is showing a strong recovery of bookings
                                            (recovering to 85% of pre COVID levels compared to the same period in the previous years)14 and there is an
                                            increase in search interest for Queenstown from both Expedia and Skyscanner reports15.

                                            Tourism New Zealand (TNZ) and the Tourism Export Council (TEC) have published scenarios since the initial DQ
                                            demand mapping was published. DQ has analysed and made the appropriate adjustments in our scenarios. TNZ’s
                                            models indicate that while domestic tourism is not likely to fill the gap left by international tourism, it will help to
                                            partially sustain the sector while it works toward recovering to pre-COVID 19 levels over the next 2-3 years. The
                                            report states recovery is a matter of “when, not if”16.

                                            TNZ outlines the biggest opportunities and risks that will impact the recovery of the tourism industry are: the
                                            Trans-Tasman border reopening, the rest of the world re-opening, demand pacing and business ability to survive,
                                            pivot and compete. To read the full TNZ scenario models please click here. The Tourism Export scenarios (not
                                            publically available yet) also followed similar sentiments to both DQ’s and TNZ’s scenarios.

                                            Australia Market
                                            The trans-Tasman bubble idea has gathered momentum in the past few weeks, Prime Minister Jacinda Ardern
                                            saying “it won’t be too long” before trans-Tasman travel begins, as new case numbers remain low on both sides of
                                            the Tasman (exhibit 10).

                                            The Australians Chamber of Commerce and the newly formed Tourism Restart Taskforce has approved a timetable
                                            for international and domestic travel resuming, outlining that all domestic tourism will have restarted from 5th
                                            June and from 1st July Australians will be able to visit New Zealand (exhibit 11)17.

                                            However, international travel is not expected to resume until after the 15th December 2020. Draft guidelines of
                                            how quarantine – free flights can safely operate will be handed to both governments by the Trans-Tasman Safe
                                            Border Group in early June, with the optimistic aim of flights restarting from July 2020. Details are still emerging
                                            of what the flight process would look like but it is expected there will be health declarations, contact tracing
                                            measures and potential health tests18.

                                            The Australian market accounts for 30% of all international visitors to Queenstown. Australian visitation peaks
                                            over the July/August/September months in line with the winter ski season (exhibit 12), so having the trans-Tasman
                                            bubble established to capture this visitation would be hugely beneficial for Queenstown.

                                            China
                                            Interest in leisure travel in China is returning. As in New Zealand, they are limited to domestic travel and are
                                            hesitant to holiday in the immediate future or too far from home19. 13% expect to holiday over the coming
                                            summer (June–August) and a further 56% are intending to holiday between September–October, with the majority
                                            aligning with a national holiday week in October. It is expected that it will be the young, single and experienced
                                            travelers that will travel first, trips will focused around food and family and organised travel groups will not be a
                                            popular way to travel.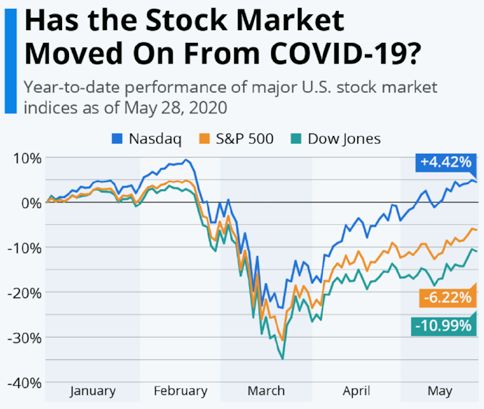
Visitor Demand Mapping for Queenstown | 5
Updates in Destination Queenstown
Assumptions
Australia
In line with the gaining momentum for the Trans-Tasman bubble DQ has moved our Australian border reopening
date to be September 2020 for the optimistic scenario; and May 2021 for the conservative scenario. This
movement to a September date is in line with TEC and TNZ’s optimistic scenarios.
Updated Scenarios
Below are the updated scenarios, which has the Australian Border opening in September 2020. This will have a
significant impact on the all market view of spend for the September, which will be due to the high number of
Australian visitors coming over for ski holidays.
Queenstown – All markets
$350m
$300m
Forecast
Historic
$250m
Mid
$200m
$150m
Optimistic
$100m
$50m
Conservative
0
APR 2017
JUL 2017
OCT 2017
JAN 2018
APR 2018
JUL 2018
OCT 2018
JAN 2019
APR 2019
JUL 2019
OCT 2019
JAN 2020
APR 2020
JUL 2020
OCT 2020
JAN 2017
JAN 2021
APR 2021
JUL 2021
OCT 2021
JAN 2022
APR 2022
JUL 2022
OCT 2022
JAN 2023
APR 2023
JUL 2023
OCT 2023
JAN 2024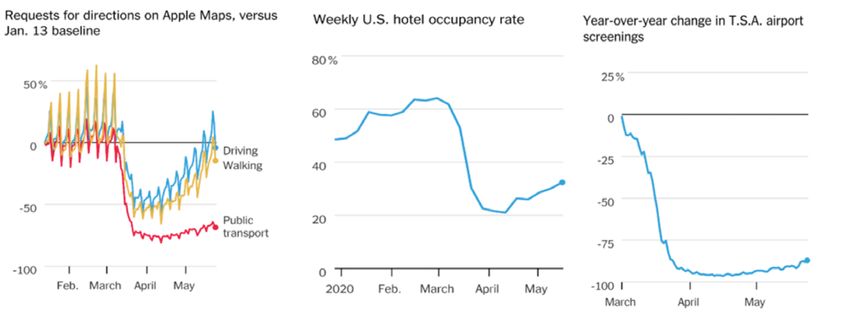
Visitor Demand Mapping for Queenstown | 6

           0
               $50m
                      $100m
                                             $150m
                                                     $200m
                                                             $250m
                                                                     $300m
                                                                                        $350m
                                                                                                                                                            0
                                                                                                                                                                $50m
                                                                                                                                                                        $100m
                                                                                                                                                                                             $150m
                                                                                                                                                                                                     $200m
                                                                                                                                                                                                             $250m
                                                                                                                                                                                                                     $300m
                                                                                                                                                                                                                                        $350m

APR 2020                                                                                                                                         APR 2020

JUL 2020                                                                                                                                         JUL 2020

OCT 2020                                                                                                                                         OCT 2020

JAN 2021                                                                                                                                         JAN 2021

APR 2021                                                                                                                                         APR 2021
                                                                                                                                                                                Optimistic

JUL 2021                                                                                                                                         JUL 2021
                                                                                                                                                                                                                                                Queenstown – All Markets Optimistic Scenario

OCT 2021                                                                                                                                         OCT 2021

                                                                                                Queenstown – All Markets Conservative Scenario
JAN 2022                                                                                                                                         JAN 2022

                                                                             Forecast
                                                                                                                                                                                                                             Forecast

APR 2022                                                                                                                                         APR 2022

JUL 2022                                                                                                                                         JUL 2022

OCT 2022                                                                                                                                         OCT 2022

JAN 2023                                                                                                                                         JAN 2023

APR 2023                                                                                                                                         APR 2023

JUL 2023                                                                                                                                         JUL 2023

OCT 2023                                                                                                                                         OCT 2023

                              Conservative
JAN 2024                                                                                                                                         JAN 2024
Visitor Demand Mapping for Queenstown | 7

                                            Percentage of Market Spend Recovery Compared to MBIE 2019
                                            – 2024 Forecasts (Monthly, Queenstown Region)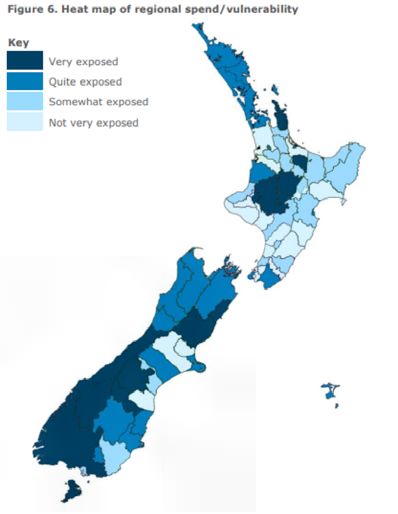
Visitor Demand Mapping for Queenstown | 8

                                            Exhibits

                                            Exhibit 1.
                                            ANZ Weekly Focus: Flightless Kiwis.
                                            Published May 25th 2020 link

                                            Heat map of regional spend/vulnerability

                                            Exhibit 2.
                                            ANZ Weekly Focus: Flightless Kiwis.
                                            Published May 25th 2020 link

                                            Travel and tourism direct
                                            contribution to GDP by country

                                            Exhibit 3.
                                            Statista: Economic Impact of
                                            COVID-19: Has the Stock Market
                                            Moved On From COVID-19?
                                            Published 29th May 2020 link
Visitor Demand Mapping for Queenstown | 9

                                            Exhibit 4.
                                            New York Times: The Reopening, in 5 Charts. Published on 26th May 2020 link

                                            Exhibit 5.
                                            IATA: Outlook for Air Travel in the Next 5 years. Published 13th May 2020 link

                                            Exhibit 6.
                                            Verisk Financial: Marketview.
                                            Weekly Spend compared to
                                            same week last year.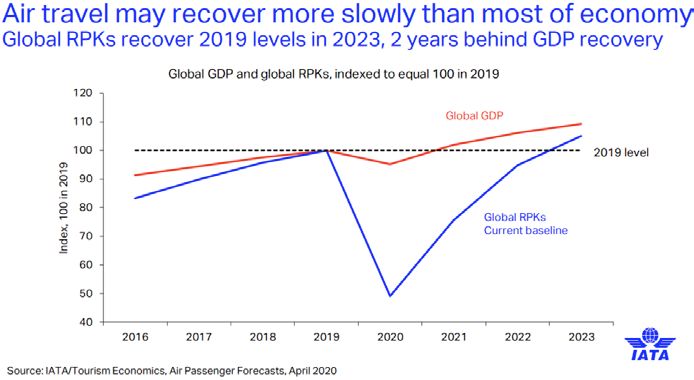
Visitor Demand Mapping for Queenstown | 10

                                             Exhibit 7.
                                             IATA: Outlook for Air Travel in the Next 5 years. Published 13th May 2020 link

                                             Exhibit 8.
                                             IATA: Outlook for Air Travel in the Next 5 years. Published 13th May 2020 link

                                             Exhibit 9.
                                             Bloomberg: Mapping the Coronavirus Outbreak Across the World. Updated 2nd June 2020. Link
Visitor Demand Mapping for Queenstown | 11
Exhibit 11.
Covid-19 WHO bell curves (Current as of 02-06-2020) (World Health Organisation: WHO Coronavirus Disease
(COVID-19) Dashboard. (Link))
Global
New Zealand
Australia
China
United States
United KingdomVisitor Demand Mapping for Queenstown | 12
India
Japan
Germany
Singapore
South KoreaVisitor Demand Mapping for Queenstown | 13
Exhibit 11.
Travel Weekly: The Timeline for International Travel’s Restart has just become a whole lot clearer, thanks to a new
chart detailing Australia’s Plans. Published 28th May 2020. Link
Exhibit 12.
Statistics New Zealand: 2019 International Visitor Arrivals. Pulled March 15th 2020Visitor Demand Mapping for Queenstown | 14
Sources and
References
1
The New Zealand Treasury: Weekly Economic Update. 29th May 2020 link
2
ANZ Weekly Focus: Flightless Kiwis. Published May 25th 2020 link
3
BNZ Markets Outlook: Unbearable! Australia Out In Front. Published 25th May 2020 link
4
Bloomberg: Australia’s Credit Rating Outlook Cut to Negative by Fitch. Published 22nd May 2020 link
5
Statista: ECONOMIC IMPACT OF COVID-19: Has the Stock Market Moved On From COVID-19? Published 29th
May 2020 link
6
New York Times: The Reopening, in 5 Charts. Published on 26th May 2020 link
7
Verisk Financial: Marketview: Weekly Card Transaction Measure Queenstown Lakes District: Week Ending 26th
May 2020
8
IATA: Outlook for Air Travel in the Next 5 years. Published 13th May 2020 link
9
McKinsey: A New Approach in Tracking Travel Demand link
10
Air New Zealand: Market Announcement, Air New Zealand liquidity and 2020 earnings update. Published May
26th 2020.
11
World Health Organisation: DRAFT landscape of COVID-19 candidate vaccines – 30 May 2020. Published 30th
May 2020 link
12
New Zealand Hearld: Covid-10 Coronavirus: $37m for vaccine research and to join global development.
Published 26th May 2020. link
13
Horizon Poll: 1.22 million adults intend taking a domestic holiday. Link
14
NewsHub: Airbnb data reveals massive increase in New Zealand domestic travel bookings. Published 21st May
2020 link
15
Skyscanner. Weekly Travel Insights – 21 May. Published 21st May 2020. Link
16
Tourism New Zealand: TNZ Scenario Models April-May 2020. Link
17
Travel Weekly: The timeline for international travel’s restart has just become a whole lot clearer, thanks to a new
chart detailing Australia’s plans. Published 28th May 2020. Link
18
Bloomberg: Quarantine- Free Flights from Australia Could Start Within Weeks. Published 27th May 2020. Link
19
McKinsey: Hitting the road again: How Chinese Travelers are thinking about their first trip after COVID-19.
Published 14th May 2020. LinkYou can also read


