Vitamin D deficiency and disease risk among aboriginal
←
→
Page content transcription
If your browser does not render page correctly, please read the page content below
Special Article

Vitamin D deficiency and disease risk among aboriginal
Arctic populations                        nure_406   468..478

Sangita Sharma, Alison B Barr, Helen M Macdonald, Tony Sheehy, Rachel Novotny, and Andre Corriveau

                     Aboriginal populations living above the Arctic Circle are at particularly high risk of
                     vitamin D deficiency due to limited ultraviolet B exposure (related to geographic
                     latitude) and inadequate dietary intake (recently related to decreased traditional
                     food consumption). Major changes in diet and lifestyle over the past 50 years in
                     these populations have coincided with increased prevalence rates of rickets, cancer,
                     diabetes, and obesity, each of which may be associated with vitamin D inadequacy.
                     This review examines the risk factors for vitamin D inadequacy, the associations
                     between vitamin D and disease risk at high geographic latitudes, and the
                     recommendations for improving vitamin D status particularly among aboriginal
                     Arctic populations. Traditional foods, such as fatty fish and marine mammals, are
                     rich sources of vitamin D and should continue to be promoted to improve dietary
                     vitamin D intake. Supplementation protocols may also be necessary to ensure
                     adequate vitamin D status in the Arctic.
                     © 2011 International Life Sciences Institute

                        INTRODUCTION
Table 1 Informal definitions of deficient, insufficient, and optimal serum 25(OH)D concentrations.
Range of serum 25(OH)D Source
Deficiency 75 nmol/L, Garland et al. (2009)10;
90–100 nmol/L, Bischoff-Ferrari et al. (2006)9;
100–150 nmol/L Whiting and Calvo (2005)6
Units of nmol/L can be converted to ng/mL by dividing by 2.496.
sometimes defined as deficient (Table 1).8 The appropri- consisting mainly of imported non-nutrient-dense foods
ate definition for insufficiency is more controversial; it is due to acculturation and, possibly, climate change.14–16 As
often defined as serum levels of 50–80 nmol/L,7,8 a result, widespread dietary inadequacy has become
although some studies use lower values. Most evidence evident, and chronic disease rates are rising among these
suggests better health outcomes are achieved with con- populations.15–19
centrations >75 nmol/L, while the most optimal range This review aims to examine the risk factors for
may be 90–100 nmol/L or even 100–150 nmol/L.6,9,10 It vitamin D deficiency and the associations between
should be noted that some studies report serum concen- vitamin D and chronic and infectious diseases among
trations in international system (SI) units, as nmol/L, aboriginal populations in the Arctic. Relevant research
while others report values as ng/mL (1 ng/mL = conducted at northern geographic latitudes (primarily
2.496 nmol/L); all values are reported as nmol/L in this ⱖ55°), including Norway, Greenland, Finland, Denmark,
review. Assay methods to measure serum 25(OH)D also Estonia, the United Kingdom, and Canada, was reviewed.
vary among studies. Key words used for the literature search included the
The Arctic Circle, located at approximately 66° 33′ N following: vitamin D, Arctic, aboriginal, latitude, UVB,
latitude, runs through the northernmost areas of Canada, traditional foods, dietary intake, bone, cancer, obesity,
Denmark (i.e., Greenland), Iceland, Norway, Sweden, diabetes, and infectious disease. The data gathered may be
Finland, Russia, and the United States (i.e., Alaska). The useful in making important decisions for an intervention
land within the Arctic Circle is often referred to as the to improve vitamin D intake and status among aboriginal
“land of the midnight sun” because the sun does not set Arctic populations.
for approximately 3 months during the summer. As
autumn approaches, the amount of daylight decreases
steadily until the sun is no longer visible for up to 2 RISK FACTORS FOR ABORIGINAL ARCTIC POPULATIONS
months in the winter, a phenomenon referred to as “polar
night” or “polar twilight.” However, any time the sun is Latitude, season, and sunlight exposure
present at these latitudes, the solar zenith angle is such
that it causes significantly less UVB radiation to reach the Upon solar UVB exposure, vitamin D is synthesized in
earth’s surface.11 Because solar UVB exposure is consid- the skin; therefore, geographic latitude and season are
ered the principal source of vitamin D, the latitude and, critical factors to consider when assessing vitamin D
thereby, limited UVB exposure in this region of the world status. It has long been recognized that vitamin D cannot
play a critical role in the vitamin D status of its be produced in the skin at latitudes as low as 42° N from
inhabitants. November through February due to the increased angle
The Arctic is inhabited by approximately 4 million of the sun during these winter months, which decreases
people, approximately 10% of whom are aboriginal the intensity of UVB radiation.11 As latitude increases, so
people, including (but not limited to) Inuit, Inuvialuit, does the length of the year during which cutaneous
First Nations, Metis,Yup’ik,Aleut, and Saami.12 According vitamin D production is impossible.11 It is also believed
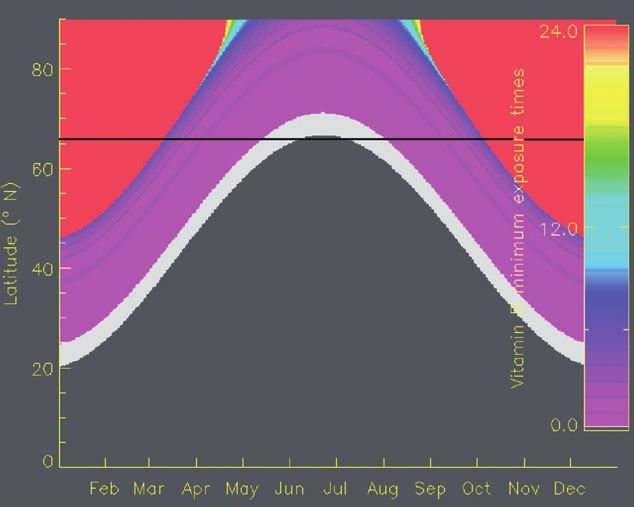
to the Arctic Human Development Report published in that during summer months, those living at higher lati-
2004, aboriginal populations range from approximately tudes (particularly >60° N) require much longer UVB
88% in Greenland, 51% in Arctic Canada, 16% in Alaska, exposure times than those living at lower latitudes to
5% in Arctic Norway, Sweden, and Finland, to less than cutaneously synthesize equivalent amounts of vitamin
4% in Arctic Russia.13 Over the past 50 years, aboriginal D.20 Figure 1 illustrates Webb’s20 model of the effect of
Arctic populations have experienced a rapid transition in latitude on the ability to synthesize vitamin D throughout
diet and lifestyle, largely a result of increased accultura- the year. There are a set of assumptions made in this
tion.13 Particularly, the diet within this population has model (including fixed atmospheric conditions, horizon-
changed from one based primarily on traditional foods, tal skin surface, and skin type), which are further
including caribou, fish, and marine mammals, to a diet described in the original paper.20 Dowdy et al.21 suggest
Nutrition Reviews® Vol. 69(8):468–478 469compared to women. It should be noted that in Estonia,
dairy products are not fortified with vitamin D, few people
use supplements, and the typical diet does not contain
vitamin-D-rich foods; therefore, this population depends
heavily on sunlight exposure for vitamin D. This study
concludes that summertime build-up of vitamin D is not
adequate to achieve optimal vitamin D status throughout
the year at northern latitudes.22
Macdonald et al.23 assessed 25(OH)D status in rela-
tion to sunlight exposure, dietary vitamin D intake, bone
health, and overweight in 3,113 postmenopausal women
living at latitude 57° N in the UK (Aberdeen, Scotland).
Mean 25(OH)D concentrations were higher in summer
and fall due to greater sunlight exposure compared to
winter and spring. However, during each season, between
73% and 84% of the study population had serum
Figure 1 Minimum exposure time (hours) needed to
25(OH)D levels ofthe Arctic Circle. As long as UVB radiation is inadequate 70 years.25 In the NWT, 83–100% of all age and contributed significantly to vitamin D intake: 26.8% in
gender groups did not meet the vitamin D recommenda- the NWT and 57.7% in Nunavut; therefore, the authors
tions, with the exception of men between the ages of 51 suggested these foods should be promoted to help
and 70 years; in this group, 63% did not meet the recom- improve dietary adequacy.28,29
mendation.16 Women in the NWT had a lower mean daily Kuhnlein et al.18,31 evaluated the impact of TF con-
intake of vitamin D than men, 1.9 mg and 6.4 mg, respec- sumption on nutrient intake in Yukon First Nations,
tively. Further dietary analysis in the same populations Dene/Me’tis, and Inuit adults (n = 3,404) and in Yukon
confirmed inadequate dietary intake of vitamin D.Among and Dene children (n = 98) residing in Yukon, the NWT,
75 Inuit men and women in Nunavut, more than 60% had Nunavut, and Labrador. Twenty-four-hour recalls were
low vitamin D intake, with mean daily intakes of 1.9 mg collected during two seasons to estimate mean vitamin D
and 3.1 mg, respectively.28 In the NWT, 84–100% of intake for each group. When a minimum of one TF was
64 Inuvialuit women were found to have lower-than- consumed in a day, vitamin D intake (and many other
recommended intakes (mean 3.0 mg/day), while most nutrients) was significantly higher in all adults. Mean
men met the recommendation (mean 7.7 mg/day).29 It vitamin D intake was three times higher among Inuit
should be noted that some studies report vitamin D intake (25.1 mg/day) than among Yukon First Nations and Dene/
in international units (IU), while others report vitamin D Metis populations (7.3 mg/day and 7.9 mg/day, respec-
intake in micrograms (mg) (1 mg = 40 IU); all intake tively) when TF were consumed. Older adults (>40 years)
values in this review are reported in micrograms. in all groups consumed significantly more TF than
Conversely, adequate vitamin D intake was reported younger adults, and older Inuit (ⱖ61 years) consumed
among Canadian aboriginal and white women (n = 356) the most TF of any group.18,31
living in Manitoba (49°–58° N); total mean daily intake Rejnmark et al.32 measured various plasma indica-
from food and supplements was 8.6–18.8 mg/day.30 Rural tors of calcium homeostasis and bone metabolism in
aboriginal women obtained significantly more vitamin Inuit Greenlanders and Danes (n = 188) consuming a tra-
D from food than urban aboriginal and urban white ditional Inuit diet (defined as including seal and/or whale
women, who also used supplements, and older women at least once a week) or a Westernized diet (defined as
(ⱖ51 years) consumed more vitamin-D-rich foods than including seal and/or whale 3 times or less per month)
younger women. Despite adequate intake, the prevalence and living in Greenland (at 64° N), and Denmark (55° N).
of vitamin D deficiency was higher among Canadian These data showed decreased vitamin D plasma concen-
aboriginal women than among Canadian white women. trations related to a diet that included less TF. Inuit
Thirty-two percent of rural aboriginal and 30.4% of Greenlanders consuming a traditional diet had higher
urban aboriginal women, compared to 18.6% of urban 25(OH)D concentrations (53 nmol/L) than the other
white women, had a serum 25(OH)D concentration of Inuit groups living in either Greenland or Denmark
Nutrition Reviews® Vol. 69(8):468–478 471Table 2 Dietary vitamin D intake among aboriginal Canadian populations.
Author (year) Population Reported mean daily
vitamin D intake†
Sharma et al. (2010)16 Inuit adults (in Nunavut) 2.3 mg for men
2.1 mg for women
Inuvialuit adults (in NWT) 6.4 mg for men
1.9 mg for women
Hopping et al. (2010)28 Inuit adults (in Nunavut) 1.9 mg for men
3.2 mg for women
Erber et al. (2010)29 Inuvialuit adults (in NWT) 7.7 mg for men
3.0 mg for women
Kuhnlein et al. (2004)18 First Nations adults (in Yukon) 7.3 mg with traditional foods
2.1 mg without traditional foods
Dene/Metis adults (in NWT) 7.9 mg with traditional foods
3.5 mg without traditional foods
Inuit adults (in NWT, Nunavut, and Labrador) 25.1 mg with traditional foods
8.6 mg without traditional foods
Weiler et al.(2004)30 Rural aboriginal women (in Manitoba) 13.9 mg from food
13.9 mg from food + supplements
Urban aboriginal women (in Manitoba) 7.8 mg from food
10.8 mg from food + supplements
Urban white women (in Manitoba) 6.0 mg from food
10.6 mg from food + supplements
†
1 mg = 40 IU.
Abbreviation: NWT, Northwest Territories.
and consuming a Westernized diet (32 nmol/L and contaminants (e.g., methylmercury) and suggest that
44 nmol/L, respectively). In addition to diet, this study supplementation is warranted in this population.33
found ethnicity, age, and season were also significant Further investigation of possible genetic differences
independent determinants of vitamin D status, while lati- in vitamin D metabolism will provide valuable data to
tude was not. This study suggests ethnicity should be help determine appropriate dietary approaches to pre-
considered in future research of similar populations, as venting vitamin D inadequacy. Evidence of dietary
genetic differences in calcium and vitamin D metabolism vitamin D intake among aboriginal Arctic populations is
may exist between Inuits and Caucasians.32 summarized in Table 2.
In contrast, a recent study that investigated vitamin
D status and its determinants among elderly subjects
(n = 669) in the Faroe Islands (latitude 62° N) indicated VITAMIN D AND DISEASE
that high intake of marine foods may not be enough to
protect high-latitude populations from vitamin D inad- Bone health
equacy.33 The subjects were from a fishing population that
regularly consumes fish and pilot whale blubber; since Recognized in 1645, rickets was the first observed health
vitamin D fortification is not mandated, these food items effect of vitamin D deficiency.34 Since food (and infant
comprise their primary source of vitamin D. However, formula) fortification, sunlight exposure, and supplemen-
approximately 54% of the study population had serum tation were identified as appropriate treatments for
25(OH)D levels 80 nmol/L, with median values being persistence or re-emergence of rickets in children and
higher in the summer than in the winter. Overall fish osteomalacia in adults, along with more recent associa-
intake was not significantly correlated with vitamin D tions between vitamin D and bone health, has placed
status; however, the most frequently consumed fish were vitamin D back in the spotlight in recent years.
cod and haddock, which are not as high in vitamin D as Vitamin D deficiency rickets continues to be
more fatty fish. Whale blubber intake, at least once a reported among children throughout the world, includ-
month, increased the odds of 25(OH)D levels being above ing the United States, Canada, and the United King-
80 nmol/L by 56%. BMI, female gender, and summer dom.35,36 In Canada, Ward et al.36 confirmed 104 cases of
season were also positively associated with higher vitamin rickets in children between 2002 and 2004, reporting an
D status. Finally, these authors raised the concern that a overall annual incidence of 2.9 cases per 100,000. The
traditional diet also increases exposure to environmental incidence was greater among children over 1 year of age
472 Nutrition Reviews® Vol. 69(8):468–478living in the North (Yukon Territory, the NWT, and Vitamin D and calcium supplementation during
Nunavut). By ethnicity, 13% of the children were First winter may prevent seasonal changes in vitamin D status
Nations and 12% were Inuit. Overall, 89% of the children and bone loss in some populations40; however, there is no
were classified as having intermediate or darker skin, and consensus on the optimal level or duration of supplemen-
94% were breastfed. Maternal factors were low sun expo- tation or on whether supplementation is most effective
sure and low intake of vitamin D (from diet or supple- with calcium alone or in combination with vitamin D for
ments) during pregnancy and lactation. This study bone health. Several drug therapies also show good effi-
highlighted the need for increased attention to maternal cacy for improving bone density,41 but the focus of this
and infant vitamin D status, particularly in people with review is dietary strategies for improving vitamin D status
darker skin and in aboriginal women and children living at high latitudes.
in Canada’s northern territories.36 The Canadian Paedi-
atric Society acknowledges the health issues related to Cancer
vitamin D status in mothers and children and has con-
firmed that deficiency is especially common among It is believed the incidence of malignant diseases, includ-
aboriginal people, many of whom live in the Arctic. A ing cancer, was exceptionally low among Inuit popula-
position statement on the topic recommends routine tions historically, but this is no longer the case.13
vitamin D supplementation for children and pregnant Coinciding with major changes in diet and lifestyle over
and lactating women living in the northern regions of the past 50 years, a significantly increased incidence of
Canada.37 cancer, especially lung, colorectal, breast, and stomach
Although there is limited evidence, it has been cancer, has been observed among the Inuit.13 The inci-
reported that aboriginal people may have significantly dence of colorectal cancer is currently higher in Alaskan
higher rates of fracture than non-aboriginal people.38 A Inuit than in whites living in the United States.13 Further-
study of the First Nations population in Manitoba (lati- more, cancer is now the leading cause of death among
tude 49–58° N) evaluated risk of all fractures and found Alaska Native people, and cancer mortality rates in Alaska
that First Nations people had a twofold higher incidence are significantly higher than those in the mainland United
of any type of fracture than non-First-Nations people. States.42 While environmental, geographical, and genetic
Vitamin D status and intake were not assessed; however, factors are important to consider, poor diet quality and
this study was the first to identify this population as being lifestyle changes are also plausible contributors to these
at higher risk for fracture, suggesting that ethnicity and/or numbers.
higher prevalence of osteoporosis may be factors in frac- A link between sun exposure, latitude, and cancer
ture rates in this population.38 mortality was first suggested in 1915.43 What is referred to
Low vitamin D status is associated with elevated as the UVB/vitamin D/cancer theory was proposed in
parathyroid hormone, which is associated with increased 1980 by Garland and Garland on the basis of an observa-
bone loss and turnover. In southern Finland (latitude tion that colon cancer rates were lowest in the sunniest
60° N), the relationships between intact parathyroid parts of the United States,44 and support for this theory
hormone (iPTH), serum 25(OH)D, and bone health in has grown to be scientifically strong enough that vitamin
young healthy adults aged 31–43 years were assessed.39 D is currently used in cancer prevention and treatment.45
This study reported that one-third of the study popula- To date, evidence has linked UVB exposure with the inci-
tion (n = 328) was vitamin D deficient [25(OH)D < dence of approximately 18 types of cancer, including
25 nmol/L] during the winter despite adequate mean colon, breast, lung, stomach, and prostate cancer.45–47 Spe-
daily vitamin D intake by men and nearly adequate cifically, age-adjusted incidence of breast cancer was
intake by women. Serum iPTH concentrations were higher in countries at higher latitudes (including Iceland
found to increase with 25(OH)D levels < 80 nmol/L in and Norway) when incidence rates in 107 countries were
women and 75 nmol/L) vitamin D status on the risk of colon,
D status needed to maintain normal iPTH concentra- breast, prostate, and ovarian cancer.48 Several large epide-
tions in the wintertime and to prevent decreased bone miological studies linked lower dietary vitamin D intake
mineral density. with higher risk of colon cancer48; lower dietary vitamin
Nutrition Reviews® Vol. 69(8):468–478 473D intake has also been associated with breast cancer.46 At betes.57 Stene and Joner58 also observed a reduced risk of
high latitudes, survival rates of several types of cancer type 1 diabetes in Norway (latitude 58–71° N) in chil-
have been associated with season of diagnosis as a result dren who were supplemented with cod liver oil
of seasonal variations in UVB irradiance and vitamin D (approximately 400 IU/day or 10 mg at least 5 times per
status. In Norway (latitude 58–71° N), Robsahm et al.49 week) during the first year of life. In a previous study,
found a significant variation in prognosis based on the the same authors observed a reduced risk of type 1 dia-
season of diagnosis in 115,096 breast, colon, and prostate betes in offspring when mothers used cod liver oil
cancer patients. Those diagnosed in summer or fall, when during pregnancy, but no significant benefit was found
serum 25(OH)D levels were highest, had a lower risk of with the use of other vitamin D supplements in this
death. There was no difference in prognosis between study.59 The authors suggested the effects could be
those living in northern or southern regions of Norway; attributed to the fatty acids in cod liver oil, which are
the authors suggested that dietary intake of fatty fish and also found in other marine sources of vitamin D con-
cod liver, which are commonly consumed in northern sumed by aboriginal Arctic people (such as fatty fish,
Norway, may explain this finding. This study also suggests seal, and whale blubber). Additionally, the authors sug-
that higher vitamin D levels during cancer treatment may gested the bioavailability of vitamin D may be better in
improve treatment effects.49 Further research on the rela- cod liver oil than in other supplements; however, Holvik
tionships between vitamin D and cancer is warranted et al.60 reported no difference in the bioavailability of
among aboriginal Arctic populations. vitamin D between fish oil capsules and a multivitamin
tablet containing the same dose of cholecalciferol.
Diabetes
Infectious disease
Alaska Native people have the highest rate of increase in
diabetes of any people in North America,50 and the preva- Antimicrobial drug resistance, the re-emergence of
lence of diabetes among aboriginal people in northern tuberculosis, and the emergence of HIV and other viruses
Canada is also increasing.17,19 Vitamin D is believed to in Arctic communities has caused increased concern
play a role in glucose intolerance, type 2 diabetes, and among governments and medical and public health offi-
metabolic syndrome due to its effects on insulin secretion cials.61 Besides crowded housing, the cold climate,
and sensitivity,51,52 and it may also be an environmental overuse and/or lack of antimicrobial drugs in the Arctic,61
factor in the development of type 1, or juvenile, diabetes.53 vitamin D status may also be a determinant of some
As diabetes rates continue to rise in Arctic populations, infectious diseases. Vitamin D deficiency has been asso-
the public health implications of vitamin D status are ciated with increased rates of infection, including respi-
becoming increasingly significant. ratory infections, influenza, and active tuberculosis, as
The incidence of type 2 diabetes was associated with reviewed by Gombart.5 Discussion of the mechanisms by
low serum vitamin D status in Finland (latitude >60° N) which vitamin D is involved in immunity is beyond the
in a pooled analysis of two cohorts (in which similar scope of this review.
results were found previously).52 Men with the highest In 2006, the highest rates of tuberculosis in Canada
serum vitamin D concentrations (range, 54–148 nmol/L; were reported in Nunavut (155.9 cases per 100,000
mean, 69.1 nmol/L) had an 82% lower risk than those people). Overall, rates were higher among Canadian-born
with the lowest concentrations (range, 9–29 nmol/L; aboriginal people than among Canadian-born non-
mean, 22.3 nmol/L) after adjustment for BMI, physical aboriginal people and were higher in the North (Yukon,
activity, smoking, and education. Vitamin D insufficiency the NWT, and Nunavut) than in the rest of Canada.62 A
[serum 25(OH)D < 50 nmol/L or 20 ng/mL] was also recent meta-analysis found that patients with tuberculo-
reported in the winter among a small cohort with type 2 sis had lower serum 25(OH)D levels than controls
diabetes in Scotland at approximately 56° N.54 matched on age, sex, ethnicity, diet, and location;
Results of randomized controlled trials of vitamin D however, the authors did not control for sunlight expo-
supplementation related to diabetes, including some trials sure and smoking.63 Vitamin D, cod liver oil, and sunlight
conducted at higher latitudes, have varied.55 However, it were used to treat patients with tuberculosis before anti-
has been suggested that promoting higher intakes of both biotics were available; although current studies are incon-
vitamin D and calcium may be an inexpensive interven- clusive, vitamin D has been suggested as a possible safe,
tion for prevention of type 2 diabetes.56 low-cost prophylaxis and supplemental treatment for
A birth-cohort study in northern Finland (latitude tuberculosis and other bacterial infections.64,65 It has also
65–68° N) showed that regular vitamin D supplementa- been suggested that higher vitamin D levels may be
tion of ⱖ2,000 IU/day (or 50 mg/day) in infancy was required for optimal innate immune function,64 which
associated with a reduced risk of developing type 1 dia- further brings into question the adequacy of current
474 Nutrition Reviews® Vol. 69(8):468–478recommendations, especially for populations with limited increased to 15 mg/day (600 IU) for all individuals 1 to 70 UVB exposure. years of age and 20 mg/day (800 IU) for adults
within food systems is essential to determine sustainable              13. Friborg JT, Melbye M. Cancer patterns in Inuit populations.
approaches to improving health in the Arctic. A better                     Lancet Oncol. 2008;9:892–900.
                                                                       14. Receveur O, Boulay M, Kuhnlein HV. Decreasing traditional
understanding of these matters will guide researchers
                                                                           food use affects diet quality for adult Dene/Metis in 16 com-
and health professionals in developing appropriate,                        munities of the Canadian Northwest Territories. J Nutr. 1997;
evidenced-based recommendations and effective inter-                        127:2179–2186.
ventions for Arctic populations.                                       15. Sharma S, De Roose E, Cao X, Pokiak A, Gittelsohn J,
                                                                           Corriveau A. Dietary intake in a population undergoing a
                                                                           rapid transition in diet and lifestyle: the Inuvialuit in the
Acknowledgments                                                            Northwest Territories of Arctic Canada. Can J Public Health.
                                                                           2009;100:442–448.
The authors thank the members of the Healthy Foods                     16. Sharma S, Cao X, Roache C, Buchan A, Reid R, Gittelsohn J.
North team for their tireless efforts and their dedication                  Assessing dietary intake in a population undergoing a rapid
                                                                           transition in diet and lifestyle: the Arctic Inuit in Nunavut,
to improving the health of aboriginal Arctic populations.                  Canada. Br J Nutr. 2010;103:749–759.
                                                                       17. Bjerregaard P, Young TK, Dewailly E, Ebbesson SO.
Funding. This work was supported by the American Dia-                      Indigenous health in the Arctic: an overview of the
betes Association Clinical Research award (1-08-CR-57).                    circumpolar Inuit population. Scand J Public Health. 2004;32:
                                                                           390–395.
Declaration of interest. The authors have no relevant                  18. Kuhnlein HV, Receveur O, Soueida R, Egeland GM. Arctic
                                                                           indigenous peoples experience the nutrition transition with
interests to declare.                                                      changing dietary patterns and obesity. J Nutr. 2004;134:
                                                                           1447–1453.
                          REFERENCES                                   19. Lix LM, Bruce S, Sarkar J, Young TK. Risk factors and chronic
                                                                           conditions among aboriginal and non-aboriginal popula-
 1. Holick MF. Vitamin D deficiency. N Engl J Med. 2007;357:266–            tions. Statistics Canada, catalogue no. 82-003-XPE. Health
    281.                                                                   Rep. 2009;20:1–9.
 2. Calvo MS, Whiting SJ, Barton CN. Vitamin D intake: a global        20. Webb AR. Who, what, where and when—influences on cuta-
    perspective of current status. J Nutr. 2005;135:310–316.               neous vitamin D synthesis. Prog Biophys Mol Biol. 2006;92:
 3. Bandeira F, Griz L, Dreyer P, Eufrazino C, Bandeira C, Freese E.       17–25.
    Vitamin D deficiency: a global perspective. Arq Bras Endo-          21. Dowdy JC, Sayre RM, Holick MF. Holick’s rule and vitamin
    crinol Metabo. 2006;50:640–646.                                        D from sunlight. J Steroid Biochem Mol Biol. 2010;121:328–
 4. Kulie T, Groff A, Redmer J, Hounshell J, Schrager S. Vitamin D:         330.
    an evidence-based review. J Am Board Fam Med. 2009;22:             22. Kull M Jr, Kallikorm R, Tamm A, Lember M. Seasonal variance
    698–706.                                                               of 25-(OH) vitamin D in the general population of Estonia, a
 5. Gombart A. The vitamin D-antimicrobial peptide pathway                 Northern European country. BMC Public Health. 2009;9:22–
    and its role in protection against infection. Future Microbiol.        29.
    2009;4:1151–1165.                                                  23. Macdonald HM, Mavroeidi A, Barr RJ, Black AJ, Fraser WD,
 6. Whiting SJ, Calvo MS. Dietary recommendations for vitamin              Reid DX. Vitamin D status in postmenopausal women living
    D: a critical need for functional end points to establish              at higher latitudes in the UK in relation to bone health, over-
    an estimated average requirement. J Nutr. 2005;135:304–                weight, sunlight exposure and dietary vitamin D. Bone.
    309.                                                                   2008;42:996–1003.
 7. Hanley DA, Davison KS. Vitamin D insufficiency in North              24. Brustad M, Alsaker E, Engelsen O, Aksnes L, Lund E. Vitamin D
    America. J Nutr. 2005;135:332–337.                                     status of middle-aged women at 65–71 degrees N in relation
 8. Holick MF. Vitamin D and sunlight: strategies for cancer pre-          to dietary intake and exposure to ultraviolet radiation. Public
    vention and other health benefits. Clin J Am Soc Nephrol.               Health Nutr. 2004;7:327–335.
    2008;3:1548–1554.                                                  25. Institute of Medicine, Food and Nutrition Board. Dietary
 9. Bischoff-Ferrari HA, Giovannucci E, Willett WC, Dietrich T,             Reference Intakes for Calcium and Vitamin D. Washington,
    Dawson-Hughes B. Estimation of optimal serum concentra-                DC: National Academy Press; 2010.
    tions of 25-hydroxyvitamin D for multiple health outcomes.         26. Pakseresht M, Sharma S. Validation of a quantitative food
    Am J Clin Nutr. 2006;84:18–28. [Erratum, Am J Clin Nutr.               frequency questionnaire for Inuit population in Nunavut,
    2006;84: 1253.]                                                        Canada. J Hum Nutr Diet. 2010;23(Suppl 1):S67–S74.
10. Garland CF, Gorham ED, Mohr SB, Garland FC. Vitamin D for          27. Pakseresht M, Sharma S. Validation of a culturally appropriate
    cancer prevention: global perspective. Ann Epidemiol. 2009;            quantitative food frequency questionnaire for Inuvialuit
    19:468–483.                                                            population in the Northwest Territories, Canada. J Hum Nutr
11. Webb AR, Kline L, Holick MF. Influence of season and latitude           Diet. 2010;23(Suppl 1):S75–S82.
    on the cutaneous synthesis of vitamin D3: exposure to winter       28. Hopping BN, Mead E, Erber E, Sheehy T, Roache C, Sharma S.
    sunlight in Boston and Edmonton will not promote vitamin               Dietary adequacy of Inuit in the Canadian Arctic. J Hum Nutr
    D3 synthesis in human skin. J Clin Endocrinol Metab. 1988;             Diet. 2010;23(Suppl 1):S27–S34.
    67:373–378.                                                        29. Erber E, Hopping BN, Beck L, Sheehy T, De Roose E, Sharma S.
12. Young OR, Elnarsson N. Arctic Human Development                        Assessment of dietary adequacy in a remote Inuvialuit popu-
    Report. 2004; Available at: http://hdr.undp.org/en/reports/            lation. J Hum Nutr Diet. 2010;23(Suppl 1):S35–S42.
    regionalreports/other/arctic_2004_en.pdf. Accessed 16 April        30. Weiler HA, Leslie WD, Krahn J, Steiman PW, Metge CJ. Cana-
    2010.                                                                  dian aboriginal women have a higher prevalence of vitamin

476                                                                                                   Nutrition Reviews® Vol. 69(8):468–478
D deficiency than non-aboriginal women despite similar 50. Naylor JL, Schraer CD, Mayer AM, Lanier AP, Treat CA,
dietary vitamin D intakes. J Nutr. 2007;137:461–465. Murphy NJ. Diabetes among Alaska Natives: a review. Int J
31. Kuhnlein HV, Receveur O. Local cultural animal food contrib- Circumpolar Health. 2003;62:363–387.
utes high levels of nutrients for Arctic Canadian indigenous 51. Chiu KC, Chu A, Go VL, Saad MF. Hypovitaminosis D is asso-
adults and children. J Nutr. 2007;137:1110–1114. ciated with insulin resistance and beta cell dysfunction. Am J
32. Rejnmark L, Jørgensen ME, Pedersen MB, et al. Vitamin D Clin Nutr. 2004;79:820–825.
insufficiency in Greenlanders on a westernized fare: ethnic 52. Knekt P, Laaksonen M, Mattila C, et al. Serum vitamin D and
differences in calcitropic hormones between Greenlanders subsequent occurrence of type 2 diabetes. Epidemiology.
and Danes. Calcif Tissue Int. 2004;74:255–263. 2008;19:666–671.
33. Dalgård C, Petersen MS, Schmedes AV, Brandslund I, Weihe P, 53. Cantorna MT. Vitamin D and autoimmunity: is vitamin D status
Grandjean P. High latitude and marine diet: vitamin D status an environmental factor affecting autoimmune disease
in elderly Faroese. Br J Nutr. 2010;104:914–918. prevalence? Proc Soc Exp Biol Med. 2000;223:230–233.
34. Rajakumar K. Vitamin D, cod-liver oil, sunlight, and rickets: a 54. Sugden JA, Davies JI, Witham MD, Morris AD, Struthers AD.
historical perspective. Pediatrics. 2003;112:132–135. Vitamin D improves endothelial function in patients with
35. Weisberg P, Scanlon KS, Li R, Cogswell ME. Nutritional rickets Type 2 diabetes mellitus and low vitamin D levels. Diabet
among children in the United States: review of cases reported Med. 2008;25:320–325.
between 1986 and 2003. Am J Clin Nutr. 2004;80(Suppl 55. Pittas AG, Dawson-Hughes B. Vitamin D and diabetes.
6):S1697–S1705. J Steroid Biochem Mol Biol. 2010;121:425–429.
36. Ward LM, Gaboury I, Ladhani M, Zlotkin S. Vitamin 56. Pittas AG, Dawson-Hughes B, Li T, et al. Vitamin D and
D-deficiency rickets among children in Canada. CMAJ. 2007; calcium intake in relation to type 2 diabetes in women. Dia-
177:161–166. betes Care. 2006;29:650–656.
37. Canadian Paediatric Association. Position statement: FNIM 57. Hyppönen E, Läärä E, Reunanen A, Järvelin MR, Virtanen SM.
2007-01. Vitamin D supplementation: recommendations for Intake of vitamin D and risk of type 1 diabetes: a birth-cohort
Canadian mothers and infants. Paediatr Child Health. 2007; study. Lancet. 2001;358:1500–1503.
12:583–589. 58. Stene LC, Joner G, Norwegian Childhood Diabetes Study
38. Leslie WD, Derksen S, Metge C, et al. Fracture risk among First Group. Use of cod liver oil during the first year of life is asso-
Nations people: a retrospective matched cohort study. CMAJ. ciated with lower risk of childhood-onset type 1 diabetes: a
2004;171:869–873. large, population-based, case-control study. Am J Clin Nutr.
39. Lamberg-Allardt CJ, Outila TA, Kärkkainen MU, Rita HJ, 2003;78:1128–1134.
Valsta LM. Vitamin D deficiency and bone health in healthy 59. Stene LC, Ulriksen J, Magnus P, Joner G. Use of cod liver oil
adults in Finland: could this be a concern in other parts of during pregnancy associated with lower risk of type I diabe-
Europe? J Bone Miner Res. 2001;16:2066–2073. tes in the offspring. Diabetologia. 2000;43:1093–1098.
40. Meier C, Woitge HW, Witte K, Lemmer B, Seibel MJ. 60. Holvik K, Madar AA, Meyer HE, Lofthus CM, Stene LC. A ran-
Supplementation with oral vitamin D3 and calcium during domised comparison of increase in serum 25-hydroxyvitamin
winter prevents seasonal bone loss: a randomized controlled D concentration after 4 weeks of daily oral intake of 10
open-label prospective trial. J Bone Miner Res. 2004;19:1221– microg cholecalciferol from multivitamin tablets or fish
1230. oil capsules in healthy young adults. Br J Nutr. 2007;98:620–
41. Compston J. Clinical and therapeutic aspects of osteoporosis. 625.
Eur J Radiol. 2009;71:388–391. 61. Parkinson AJ, Bruce MG, Zulz T. International Circumpolar
42. Lanier AP, Day GE, Kelly JJ, Provost E. Disparities in cancer Surveillance, an Arctic network for the surveillance of infec-
mortality among Alaska Native people, 1994–2003. Alaska tious diseases. Emerg Infect Dis. 2008;14:18–24.
Med. 2008;49:120–125. 62. Public Health Agency of Canada. Tuberculosis in Canada 2006
43. Apperly FL. The relation of solar radiation to cancer mortality Pre-Release. 2006; Available at: http://www.phac-aspc.gc.ca/
in North America. Cancer Res. 1941;1:191–195. publicat/2007/tbcanpre06/. Accessed 5 May 2010.
44. Garland CF, Garland FC. Do sunlight and vitamin D reduce 63. Nnoaham KE, Clarke A. Low serum vitamin D levels and tuber-
the likelihood of colon cancer? Int J Epidemiol. 1980;9:227– culosis: a systematic review and meta-analysis. Int J Epide-
237. miol. 2008;37:113–119.
45. Grant WB, Mohr SB. Ecological studies of ultraviolet B, 64. Zasloff M. Fighting infections with vitamin D. Nat Med.
vitamin D and cancer since 2000. Ann Epidemiol. 2009; 2006;12:388–390.
19:446–454. 65. Wejse C, Gomes VF, Rabna P, et al. Vitamin D as supplemen-
46. Mohr SB, Garland CF, Gorham ED, Grant WB, Garland FC. tary treatment for tuberculosis: a double-blind, randomized,
Relationship between low ultraviolet B irradiance and placebo-controlled trial. Am J Respir Crit Care Med. 2009;
higher breast cancer risk in 107 countries. Breast J. 2008; 179:843–850.
14:255–260. 66. Välimäki VV, Löyttyniemi E, Välimäki MJ. Vitamin D fortifica-
47. Mohr SB, Garland CF, Gorham ED, Grant WB, Garland FC. tion of milk products does not resolve hypovitaminosis D in
Could ultraviolet B irradiance and vitamin D be associated young Finnish men. Eur J Clin Nutr. 2007;61:493–497.
with lower incidence rates of lung cancer? J Epidemiol. 67. Piirainen T, Laitinen K, Isolauri E. Impact of national fortifica-
2008;62:69–74. tion of fluid milks and margarines with vitamin D on dietary
48. Garland CF, Garland FC, Gorham E, et al. The role of vitamin D intake and serum 25-hydroxyvitamin D concentration in
in cancer prevention. Am J Public Health. 2006;96:252–261. 4-year-old children. Eur J Clin Nutr. 2007;61:123–128.
49. Robsahm TE, Tretli S, Dahlback A, Moan J. Vitamin D3 from 68. Vatanparast H, Calvo MS, Green TJ, Whiting SJ. Despite man-
sunlight may improve the prognosis of breast-, colon- and datory fortification of staple foods, vitamin D intakes of Cana-
prostate cancer (Norway). Cancer Causes Control. 2004;15: dian children and adults are inadequate. J Steroid Biochem
149–158. Mol Biol. 2010;121:301–303.
Nutrition Reviews® Vol. 69(8):468–478 47769. Vieth R, Bischoff-Ferrari H, Boucher BJ, et al. The urgent need 75. Gittelsohn J, Roache C, Kratzmann M, Reid R, Ogina J,
to recommend an intake of vitamin D that is effective. Am J Sharma S. Participatory research for chronic disease preven-
Clin Nutr. 2007;85:649–650. tion in Inuit communities. Am J Health Behav. 2010;34:453–
70. Rasmussen LB, Hansen GL, Hansen E, et al. Vitamin D: should 464.
the supply in the Danish population be increased? Int J Food 76. Sharma S. Assessing diet and lifestyle in the Canadian Arctic
Sci Nutr. 2000;51:209–215. Inuit and Inuvialuit to inform a nutrition and physical activity
71. Hollis BW, Wagner CL. Assessment of dietary vitamin D intervention programme. J Hum Nutr Diet. 2010;23(Suppl
requirements during pregnancy and lactation. Am J Clin Nutr. 1):S5–S17.
2004;79:717–726. 77. Sharma S, Gittelsohn J, Rosol R, Beck L. Addressing the public
72. Weaver CM, Fleet JC. Vitamin D requirements: current and health burden caused by the nutrition transition through the
future. Am J Clin Nutr. 2004;80(Suppl 6):S1735–S1739. Healthy Foods North nutrition and lifestyle intervention pro-
73. Cashman KD, Hill TR, Lucey AJ, et al. Estimation of the dietary gramme. J Hum Nutr Diet. 2010;23(Suppl 1):S120–S127.
requirement for vitamin D in healthy adults. Am J Clin Nutr. 78. World Health Organization. Joint FAO/WHO Expert Con-
2008;88:1535–1542. sultation on the Risks and Benefits of Fish Consumption; Exe-
74. Pedersen JI. Vitamin D requirement and setting recommen- cutive Summary. 2010; Available at: http://www.who.int/
dation levels – current Nordic view. Nutr Rev. 2008;66(Suppl foodsafety/chem/meetings/jan2010/en/index.html.
2):S165–S169. Accessed 8 October 2010.
478 Nutrition Reviews® Vol. 69(8):468–478You can also read