Volume 46 April 2021 - The Ecological Consultants ...
←
→
Page content transcription
If your browser does not render page correctly, please read the page content below
Volume 46                                        April 2021

     www.ecansw.org.au                     ISSN 1836 – 6813
    Journal of the Ecological Consultants Association of NSW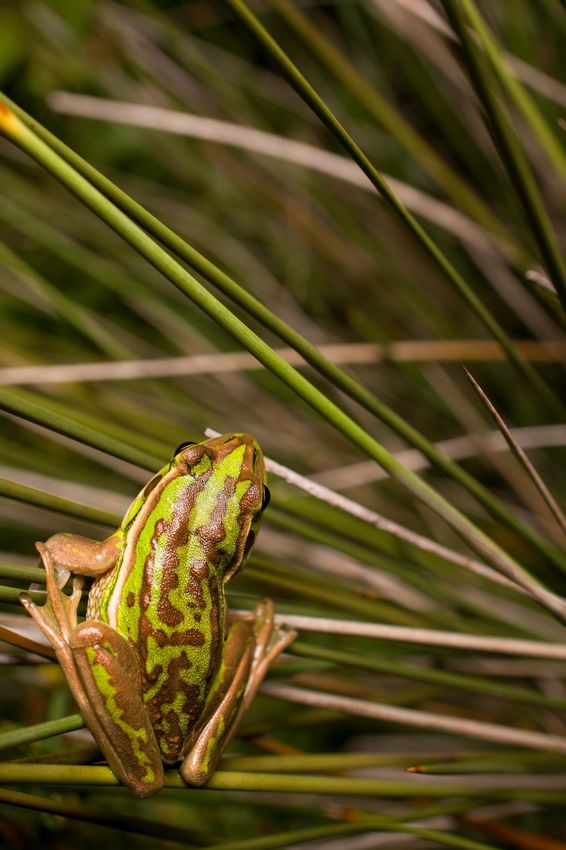
VOLUME 46                April 2021

INSIDE THIS ISSUE!
1    ECA Office Bearers 2020—2021
1    Message from the President
2    Photo Competition
3    Interesting Observations, Tips and Facts
           Scattered Trees and Widely Cultivated Native Species
           Water Rat Tracks a Long Way from Water
           Eastern Pygmy-possums Survive the Fire
           When is a Gumnut Not a Gumnut
           High Success Rate Detecting Eastern Pygmy-possums with a Thermal Camera
           Cat’s Claw Creeper and Fire

6    Upcoming ECA Events
6    Membership Report
6    DAWE EPBC ACT Review: Stakeholder Meeting Summary, February 2021
8    ECA Research Grants
8    Real Time Monitoring with Camera Trapping: An Emailing System Sending Images Direct from the Field
12   Moving Threatened Plants: Story and Practice
16   Ecology and Conservation of Mahony’s Toadlet (Uperoleia mahonyi): Determining the Required Survey
     Effort for an Endangered Frog
24   Hairy Jointgrass - When Paddocks Become Threatened Species Habitat
27   A Record of the Sand Goanna Varanus gouldii (Varanidae) from the Footslopes of the NSW Snowy
     Mountains
33   An Isolated Population of the Spinifex Delma (Delma butleri) (Pygopodidae): Records from the Barrier
     Ranges near Broken Hill, Western NSW and Implications for their Future Survival
36   Koala Survey and the SEPP (Koala Habitat Protection) 2019 and 2021
38   Studies of the Barking Owl in the NSW Northern Rivers District
40   Buildings and Birds: The Good, Bad and the Ugly
60   Contributions to the Newsletter, Volume 47
                                                                       Front Cover Photo: Green and Golden
Centre and back cover      ECA Photo Gallery                           Bell Frog Litoria aurea.

Editor: Ian Colvin, Steve Sass and Stephanie Clark                     Courtesy of Nick Weigner

Design and Layout: Amy Rowles
Message from the President
ECA Office Bearers 2020-2021
                                        Dear Members,
President:
Stephen Ambrose                         The role of the ECA is to represent the interests of our members,
president@ecansw.org.au                 provide training opportunities, provide relevant information, keep

Vice-President:
                                        up to date with changes that will impact our members and industry,
Belinda Pellow                          encourage and promote membership and support areas of research
                                        that will benefit our industry. ECA meets its obligations via the
Secretary:
                                        ECA council and a number of sub committees which deal with:
Yogesh Nair
secretary@ecansw.org.au                 •     Annual conference organisation
                                        •     Training and information workshops
Treasurer:                              •     NSW Government Liaison (DPIE)
Andrew Lothian
                                        •     Commonwealth Government Liaison (DAWE)
treasurer@ecansw.org.au
                                        •     CPEC accreditation
Councillors:                            •     Annual student grant scheme
Alison Hunt                             •     Publication of the ECA journal.
Narawan Williams
Ashleigh McTackett
Adam Greenhalgh                         While training and information workshops were not available in
Paul Burcher                            2020 due to Covid, the ECA has been busy making sure that
Ian Colvin
Steve Sass
                                        obligations to its members are being met.
Stephanie Clark
                                        This year we will once again be holding our Annual conference,
Michael Murray
Daniel McDonald                         Annual General Meeting and a workshop in Wollongong (Covid
Rebecca Hogan                           restrictions permitting). Details of the program will be provided
                                        soon, but we expect to provide an interesting conference
                                        concentrating on subjects that often get overlooked in addition to a
Administration Assistant:
Membership Officer:                     topical workshop on the new East Coast PCT mapping and how to
Amy Rowles                              use the VIS to determine PCT’s.
admin@ecansw.org.au
                                        The ECA is planning a workshop regime to start up later this year
                                        or early 2022 with a back to basics approach dealing with topics
Contact Us:
                                        such as flora and fauna survey methods to address changes to
admin@ecansw.org.au
415 Parishs Road,                       survey requirements. If you have any suggestions on workshops
Hilldale NSW 2420                       you would be interested in attending, please contact a councillor
                                        and let us know.

                                        An ECA councillor has been attending stakeholder meetings with
     ECA COUNCIL MEETINGS               DAWE with regards to the EPBC Act review. The committee have
                                        taken on board the official review study and comments from public
     The ECA Council meet every
                                        submissions.    They have processed these and are working on
    three months to discuss and deal
     with any current business of the   changes to address shortfalls and issues. It appears there will not be
      association. Any member who       so much an overhaul of the legislation itself, but more an overhaul
     wishes to view the minutes from    of the procedures in places that are failing to achieve intended
    any of the ECA council meetings     outcomes. If you would like to know more about what is going on,
       may do so by contacting the
                                        please see the short article in this copy of the Journal.
      Administration Assistant Amy
      Rowles admin@ecansw.org.au        Liaison meetings with NSW DPIE, where we raise issues around the
                                        BAM and its execution are due to be held and the relevant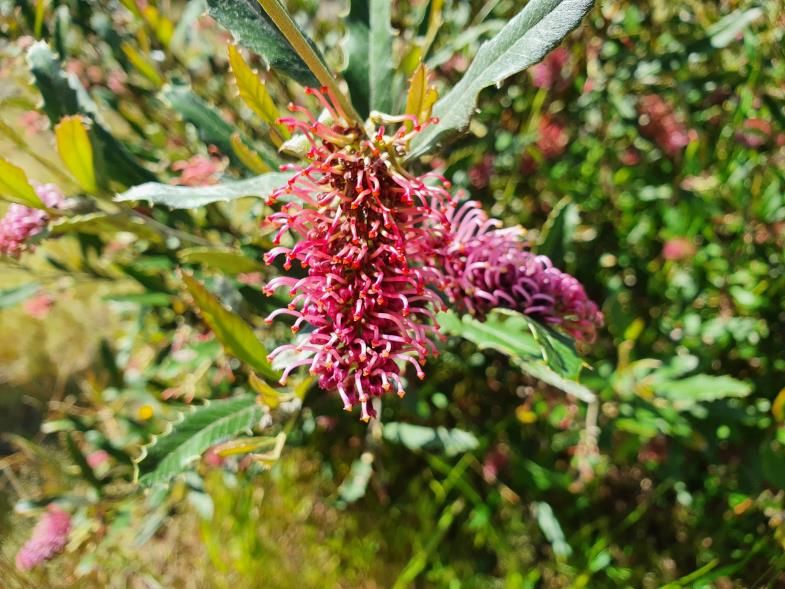
subcommittee is hoping to hear more on this from DPIE soon. Last year a number of issues were raised by ECA
representatives at these meetings including The Biodiversity Credit Market and the Role of the Biodiversity
Conservation Trust, Koala Habitat SEPP and Linkages to the BOS, Offset and Survey Requirements for Microbats
in Man-made Structures, Assessor Accreditation and Renewal and Membership of the BAM Accreditation Panel.

The CPEC program is still seeking experienced elders from the consulting industry to sign up and the relevant
subcommittee is working on ways in which this can be encouraged.

Applications for the 2021 student grants have been received and are currently being reviewed by the student
grant subcommittee.

The publication team have given their time to prepare this issue of our journal and I am sure you will find the
articles within of interest.

Provision of information relevant to members as it comes to hand is also an important role of the ECA. Our
administration officer regularly forwards information received to members and the ECA council has also
established an ECA Facebook page. Information is regularly added to the Facebook page covering a range of
topics such as disruption of shorebird behaviour due to vehicle access to beaches, recent results from research
into the Regent Honeyeater, latest on the Koala SEPP, digital white cards, camera trap projects, etc.

Covid 19 has caused many people across the world and in Australia great difficulties, disruption and personal
loss. We are extremely lucky that our industry appears to
suffered little impact and that business has remained
strong in our sector. This is supported by the steady
stream of job advertisements appearing on our webpage.
                                                                          PHOTO
So, if you are a member of the ECA please be assured                    COMPETITION
that the ECA council is doing its best, at a very busy time
for our industry, to meet its obligations to its members.        Congratulations! to Nick Weigner for winning the
                                                                last photo competition with his photograph featured
Best wishes                                                     on the front cover of a Green and Golden Bell Frog
                                                                                   Litoria aurea.
Belinda Pellow (Acting President)                                  Thank you to everyone who entered our photo
                                                                 competition. As we received so many entries, we
                                                                   have retained a random selection for the next
                                                                 competition. All entries for this competition have
                                                                been included in the ECA Photo Gallery on the back
                                                                              cover and centre pages.

                                                                    Email your favourite flora or fauna photo to
                                                               admin@ecansw.org.au to enter a competition and have
                                                                your photo on the cover of the next ECA newsletter.
                                                                Win your choice of one year free membership or free
                                                               entry into the next ECA annual conference. The winner
              FOR SALE / WANTED                                 will be selected by the ECA council. Runners up will
                                                                 be printed in the photo gallery. Please ensure that
                                                                     your photo is clear with a high resolution.
If you have 2nd hand ecological equipment that you would        Photos entered in the competition may also be used on
like to sell or would like to purchase you can place an ad
in this newsletter. Free for members or $40 for non-                              the ECA website
members. Contact admin@ecansw.org.au.

                                                                                                                       2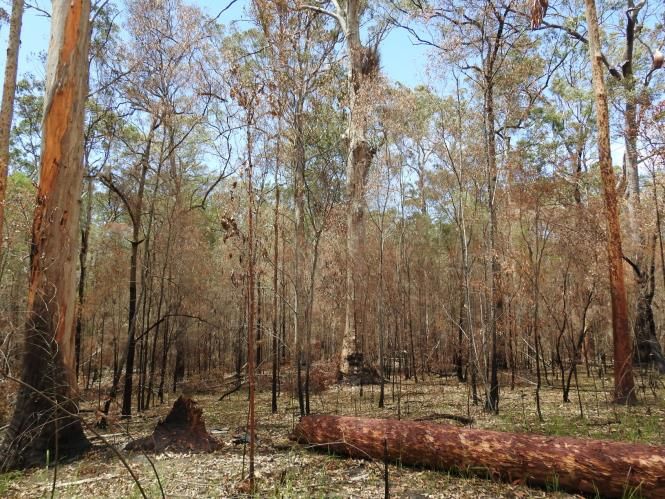
INTERESTING OBSERVATIONS, TIPS AND FACTS
                        Scattered Trees and Widely Cultivated Native Species
                                                      Ian Colvin, GeoLink
Appendix B of BAM 2020 addresses the requirements for assessing ‘scattered trees’. The module utilises three
definitions for scattered trees, two of which reference “ground cover species on the widely cultivated native species
list”. The BAM provides this definition:

“Widely cultivated native species: a variety of a native species developed in cultivation, usually for the purposes of
agriculture, forestry or horticulture, and which, when reproduced retains its distinguishing features, and any native species
listed on the high threat weeds list published in the BAM-C”.

I made an enquiry to DPIE about this mysterious list in November 2020 and have followed up twice since
then. The final response received (late April) is as follows:

Unfortunately progress on the widely cultivated native species list has been impacted by competing priorities and is now
anticipated to be released in the third quarter of 2021. Our previous advice has not changed i.e. When the list is finalised and
approved, it will be published on the BAM-C home page with the high threat weeds list.

In the interim, if you have a BAM assessment that the widely cultivated native species list is required for, please reply by
outlining as many relevant details as possible for assistance. As you have referred to, relevant details will need to align with
BAM 2020 Appendix B (for scattered trees) or D (for planted native vegetation) and the glossary definition of widely
cultivated native species.

In the absence of this information, using the scattered tree module seems basically unworkable! Any feedback
from others as to information and/or practice with this issue would be helpful.

                                     Water Rat Tracks a Long Way from Water
                                       Andrew Lothian, Biodiversity Monitoring Services
Interesting find from camera trap positioned over a sand pad on Newnes Plateau, a long way from any
significant creek lines or body of water. Maps suggest the site is at least 400m from the nearest drainage lines
(which     are   unlikely      to    contain   any    water
flows).    Likely sources of nearby water are the
Wollongambe River 1.1km to the south west and
south east of the site. The nearest water source to
the north is 2km away (Dumbano Creek). A quick
Bionet search reveals three close sightings; the
Lithgow      drinking        water    supply   dam,     the
Wollongambe River near Mt Wilson, and the
Wolgan River near the old Newnes township.
Photos were confirmed by a colleague who has
experience in tracking Water Rats around Sydney
Harbour.

                                                                                                                          3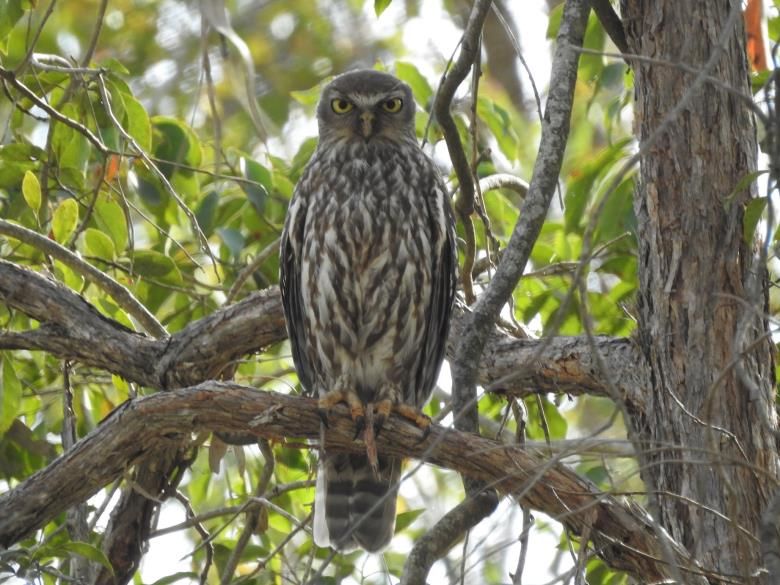
Eastern Pygmy-possums Survive the Fire
                                 Andrew Lothian, Biodiversity Monitoring Services
After an absence of Eastern Pygmy-possums from
post fire surveys on Newnes Plateau in Spring 2020,
we have had our first record for 2021 in one of our
nest boxes.    These were made by the Lithgow
Womens Shed after the Gospers Mountain fire
destroyed extensive areas of habitat around Lithgow
in December 2019.

                                   When is a Gumnut Not a Gumnut
                                      Rebecca Hayes, Hayes Environmental

                                                                  I took these photos recently on a site in Belrose,
                                                                  northern Sydney – When is a gumnut not a
                                                                  gumnut? I’ve seen them around before so don’t
                                                                  know if they’re too common to be interesting. I
                                                                  don’t   actually   know   what   little   critter   is
                                                                  responsible for it.   There was a little spider in
                                                                  residence.

   High Success Rate Detecting Eastern Pygmy-possums with a Thermal Camera
                                         Amy Rowles, Corymbia Ecology
Eastern Pygmy Possums can be difficult to detect using traditional spotlighting techniques. A couple of years ago,
I had the opportunity to use a thermal camera whilst spotlighting. The camera readily picked up the Pygmy
Possums as well as sleeping birds. Once the small warm body was detected, we would then use a torch to verify
the species. I would recommend including the use of a thermal camera for anyone targeting Eastern Pygmy
Possum.

Interestingly, a moving Brushtail Possum glowed much brighter on the camera image than a still one, illustrating
how insulative their fur is.

It is worth noting that thermal cameras work best when the contrast between the target and the background is
greater, therefore this technique works best in cooler weather.

                                                                                                                 4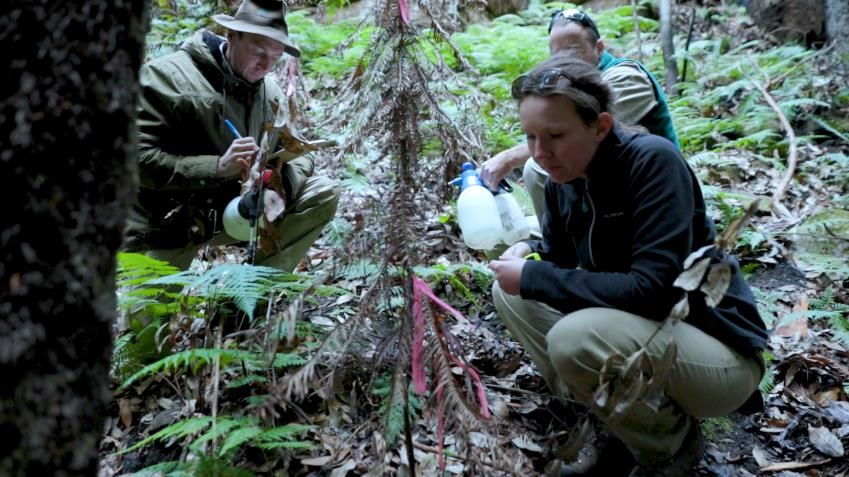
Cat’s Claw Creeper and Fire
                                              Ian Colvin, GeoLink
A site near Casino in northern NSW (Myrtle Creek) was subject to high intensity wildfire in late 2019 and the
riparian corridor was completely burnt out. Driving past in December 2020 (about one year on) I noticed Cats’
Claw Creeper (CCC) was recovering vigorously and creeping up the stems of fire killed eucalypts and rainforest
trees, with few signs of native regeneration. In a drive by in March 2021, the CCC was more vigorous than before
and was thriving and enveloping all the dead native stems and forming a carpet along the ground layer. Has
anyone else observed CCC to be so aggressive and adaptive post-fire?

                                                                                                           5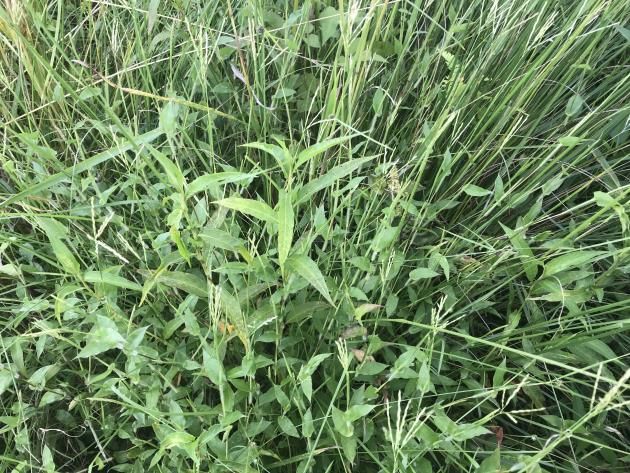
ECOLOGICAL CONSULTANTS ASSOCIATION of NSW
                     EVENTS                                                Membership Report

                                                             Membership Category                      Total
ECA ANNUAL GENERAL MEETING 2021
                                                             Full Member
Date: 12.15-1.00pm, 19 July 2021
                                                             Practising Ecological Consultant         122
Location: Sage Hotel, Wollongong
                                                             Early Career Ecological Consultant       7
ECA ANNUAL CONFERENCE and WORKSHOP                           Retired Ecological Consultant            2
Date: 19-20 July 2021                                        Associate
Conference Theme: The Forgotten, Neglected or Ignored: Government Ecological / Environment            27
                                                             Officer (Associate)
Biodiversity Issues Requiring Attention.
Workshop Theme: The Bionet Vegetation Database:              Non-practising (Associate)               6
updates and application.                                     Student                                  2
Location: Sage Hotel, Wollongong                             Subscriber (Associate)                   1
See page 29 for details
                                                             Grand Total                              167

                                   DAWE EPBC ACT REVIEW:
                     Stakeholder Meeting Summary, February 2021
Andrew Lothian
ECA Treasurer

Here is a quick summary of the February 2021 stakeholder meeting with DAWE, in regard to the EPBC Act
review. DAWE provided updates on where each little cog in the system is at. The committee have taken on
board the official review study and comments from public submissions. They have processed these and are
working on changes to address shortfalls and issues. It appears that it is not so much an overhaul of the
legislation itself, but more an overhaul of the procedures in place that are failing to achieve the intended
outcomes.

Six sections that are dealing with the changes include:
•    Online portal
•    Policy development/advice
•    Australian National Audit Office (ANAO) review
•    Training/skills, development/sector engagement, local government engagement and website
•    Gateway (referrals in) to help applicants with first stage of entry into the system
•    Governance and correspondence

The current chair for the review committee is Mary Colreavy. Her role is also to see to implementation of eight
key recommendations from the ANAO audit including: improve information collection and use; improve
governance and oversight; improve measuring and reporting of admin; the need for a quality assurance
framework; strengthen quality controls (consult with proponents before approval); and better compliance
monitoring.
                                                                                                           6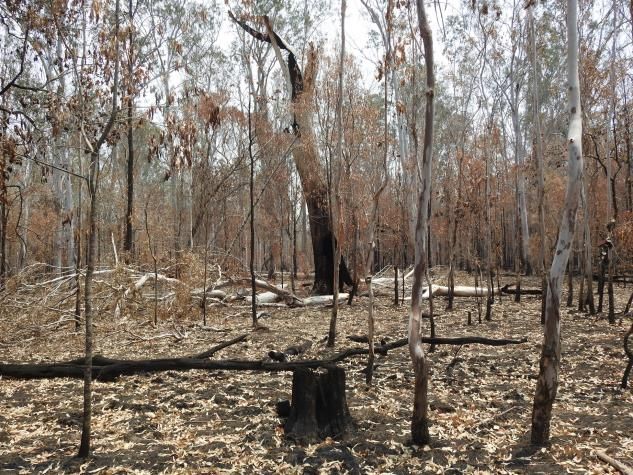
There are new internal training modules for DAWE staff, with a push to have this extended to consultants. This
training has a potential to be adapted to a Cert IV qualification in the future.

The Reform Division are working on changes as a result of the Samuel Review Report. Recommendations have
been grouped into 6 pillars of reform. Key priorities include national environmental standards, compliance and
single touch approvals. I asked about approvals outside of the ratified state system (i.e. part 5 developments not
opting into BAM). The state will need to put forward legislation to meet federal approval accreditation and meet
standards. Some proposals may need to go to federal assessment separately.

Evaluation and assurance division are coordinating a response to the ANAO audit (this deals with systems and
processes, holes in governance, shortfalls in IT systems, absence of monitoring and reporting). This really drives
the changes we will notice with the portal and assessment system.

Gateway: A new gateway for lodging referrals will track everything and let every party see what the next step is,
and what still needs to be done. Associated guidance documents will be available. Increased file size for
attachment is a welcome addition. Christmas referrals will be deferred for two weeks in future to stop things
sneaking through while people are on holidays. Recent workshops have been feeding into the development of
this new gateway.

Portal and Assessment System: DAWE are piloting new digital program with the WA Environment online
system, which will cover both state and federal assessment. This mainly consists of a mapped workflow for the
approval with interaction points and expectations specified. Workshops have also been feeding into this. If you
haven’t had a chance to be part of one of these workshops it is a great way for you to raise issues with the
programmers so it gets designed the way you want to use it. I highly recommend you take part in these
workshops. I have done about 4 or so now and they rarely take more than an hour. The final release is planned
for November 2021.

Biodiversity Data Repository: This appears to be like a national BioNet. Still looking for a partner to build the
repository. National species list previously only included plants. They are currently funding integration of
fauna.   They are looking to include an app for data capture as well so a consistent national dataset is
available. Will be tested later this year.

Major Projects Division: Because timeframes are being met, not as many projects are being escalated to major
projects to expedite via this pathway. More time is being spent at the pre-approvals stage in meetings about clear
expectations. Consultation is dealing with project nuances better than prescribed conditions.

PMSTool: Beta release of the PMSTool - Go try it. Currently waiting for funding to finish it off and still taking
feedback to improve functionality. At the moment, you can get different results depending on the version you
use as the background calculations are different. You can export the data as an excel file and can get the report
immediately.

Offset Guidelines and Register: This is in internal review at the moment. DAWE will take on feedback and test
application, then it will go for external user testing. It will allow public view of offset metadata. Should help
with the landscape level assessment which will be expected going forward. Not intended as a marketplace.

If there are any questions from the sector, please forward them to me and I will pass them along to Valerie Hush
or Mary Colreavy who will facilitate response from the appropriate party. I strongly encourage anyone with
EPBC referral experience to sign up for one of the workshops. Have a say in what is being produced for us so you
don’t sit and whinge about how useless it is later.

                                                                                                             7
ECA RESEARCH GRANTS
                                  2021 Grant Recipients
         Grant                    Recipient                       Project Title                  Affiliation
Ray Williams Mammal        Jana Stewart              Soil biota responses to reintroduced     University of
Research Grant 2021                                  semi-fossorial mammals: a temporal       NSW
                                                     comparison of soil biodiversity and
                                                     ecosystem function
ECA Conservation           Thayanne Lima Barros      Microphytobenthos biomass as             University of
Grant 2021                                           indicator of ecological impacts of the   NSW
                                                     2019/2020 bushfire season on
                                                     estuaries in New South Wales,
                                                     Australia

                                              Ana Gracinin
      Ray Williams Mammal Research Grant Recipient- 2016
     Real Time Monitoring with Camera Trapping: An Emailing System
                 Sending Images Direct from the Field
Ana Gracanin and Dr. Katarina Mikac, Centre for Sustainable Ecosystem Solutions, School of Earth, Atmospheric
and Life Sciences, Faculty of Science, Medicine & Health, University of Wollongong NSW 2522 Australia

Abstract
Camera trapping is a highly useful and effective method for studying wildlife ecology. Used at both short- and
long-term scales, camera trapping can be used to detect threatened species or threatening processes, such as
invasive species or disease. Real time monitoring of wildlife is particularly promising as a management strategy
for development projects, or conservation programs, as it allows data collection and analysis to occur
immediately, with minimal delay between interpretation and management techniques to be implemented. Here
we test the applicability of cameras with capabilities of emailing photos right as they are taken. We compare the
time delay of emailed photos using extension antennas. We also test the use of a long-term bait station and
observe behavioural responses over time to the bait. We found that the cameras could provide a long-term record
(five months tested) of wildlife by a continuous baiting system drawing in a range of species, particularly
possums, bandicoots, wombats, small mammal species (Antechinus and Rattus sp.) and foxes. Further testing
however is required over greater temporal scales, and with more cameras. We believe these cameras can be used
for invasive species management, threatened species monitoring, and as a monitoring requirement during
development projects.

Introduction
Camera trapping is a versatile, cost effective and low invasive method for studying the ecology, behaviour, and
health condition of a variety of wildlife (O’Connell et al. 2010). For highly sensitive and threatened species,
camera trapping may provide much needed information on condition, reproductive status, and threatening
                                                                                                              8
processes (Michler et al. 2008, Towerton et al. 2011, Carricondo-Sanchez et al. 2017). However, there may be a
significant delay between important data collection by the camera, data acquisition from the field, analysis and
interpretation, and the management decisions made in response. One example of this includes the tracking of
disease through camera trapping, such as the devil facial tumour disease in Tasmanian Devils (Sarcophilus
harrisii). Monitoring the progression of this disease would be greatly benefited by real time data acquisition
(Fleming et al. 2014).
As trail cameras become increasingly technologically advanced and relatively cheaper, one promising aspect is
the use of a ‘live feed’ of camera trapping. Trail cameras that can email or MMS over a network, provide a
possible method for real time monitoring of wildlife. These cameras can be implemented through a ‘set-&-forget’
method. Cameras are placed in distant and hard to reach terrain, are connected to solar power, and send images
as they are taken (real-time) to a selected email account. The testing of ‘set-&-forget’ cameras has important
implications in research and ecological consulting where budget and time constraints often impact upon the
quality of data that can be obtained. The ‘set-&-forget’ system allows users to access a remote or difficult to reach
sites only twice (at set-up and removal), reducing the need for site visits to change batteries, memory cards and
bait (if bait is being used).
We aimed to test technical aspects of a ‘set-&-forget’ camera set-up for continuous monitoring including: the use
of solar power, extra antenna, protective materials for against the elements, and a long-term baiting system. We
also compared behavioural responses of wildlife to this long-term bait station over time.
Materials and methods
Eight Suntek HC-300M IR cameras were placed in remote and difficult to reach locations of Budderoo National
Park. Four cameras had 3.5m wired antennas attached, and the other four used the included camera model’s
antenna (10cm long). Time delays were calculated by the difference between the time stamped on the photo
taken, and the time of the email received of the photo sent. Time delays were compared for cameras using the
extended antenna and the camera model antenna. Due to the initial zero success in photos being received via
email for cameras without the extended antenna, an additional four extension antennas were attached on the
remaining cameras.
Cameras were attached to trees, facing a long-term bait station. The bait consisted of a one litre bottle of tuna oil
attached to a tree or rock 30cm above the ground. The bottle was inverted with multiple punctures made around
the base of the bottle. This meant that over time as rain fell, water would enter, forcing the less dense oil to rise
and drip out of the bottle.
Cameras were set to photograph once and video record for 30 seconds to detect behavioural responses to the long
-term bait over time. A one minute delay was set between triggers. Four trail camera solar power batteries were
randomly assigned to cameras. Cameras were set to email each photo to a specified email address over the Telstra
2G network (each email costing approximately 50kb of mobile data). Cameras were left in the field for eight
months, between March 2016 and November 2016. Each camera had four to five months with bait, and the
remaining months without bait.
Results and Discussion
Of the eight trail cameras, six were successful in maintaining a long-term record of wildlife, whilst the remaining
two experienced technical issues and recorded intermittently. Cameras recorded consistent visitations over the
baited four and five month periods, as the long-term bait source was successful in delivering an olfactory cue
over a long timeframe. The use of extended antennas reduced the time delay significantly, with an average delay
of 96sec from the time the photo was taken to the time the photo was received in email. Extension antennas were
9Plate 1. From left to right: Trail camera solar panel, camera with sun and rain shield, long term bait station with inverted
bottle of tuna oil and an additional ruler for measurements.
pivotal in accessing reception, and we experienced initial difficulty on many occasions in connecting to the
network. We recommend placing antennas as high as possibly up trees, and that initial surveys are made into
finding areas with network coverage. Unfortunately, in our study, the 2G network was discontinued halfway
through our study.
Across all sites, 10 mammal species were identified (Table 1). Sites were highly variable, with habitats ranging
from rainforest, open woodland, upland heath, and dense forests, indicating why sites varied greatly in species
detection. Our relative low number of records is also due to a high rate of false triggers.
Table 1. Species recorded across all eight camera sites in Budderoo National Park.
Common Name (Scientific Name) Number of Camera Sites where
Species was Recorded
Swamp Wallaby (Wallabia bicolor) 5
Common Wombat (Vombatus ursinus) 3
Common Ringtail Possum (Pseudocheirus peregrinus) 1
Common Brushtail Possum (Trichosurus vulpecula) 2
Short-beaked Echidna (Tachyglossus aculeatus) 1
Long-nosed bandicoot (Perameles nasuta) 1
Long-nosed potoroo (Potorous tridactylus) 3
Small Mammals (e.g. Antechinus stuartii, Rattus fuscipes) 6
Red fox (Vulpes vulpes) 4
Domestic Cat (Felis catus) 1
Images emailed had a resolution of 640x480 pixels, compared to the original photo taken by the camera, which
recorded at 3200x2400 pixels. Despite the low quality, species were easily identified, however timestamps were
often difficult to read on emailed, coloured photos. One significant limitation of the study was the high rate of
10false triggers caused by wind moving vegetation: 40% of all triggers were false. Despite using plastic covers as a
shield from sun, the sensitivity of the camera model to vegetation movement caused this high rate of false
triggers (despite sensitivity set to low). Only one of the eight cameras experienced water damage with small
amounts of rust inside. The use of a plastic shield, desiccant sachets, and waterproofing spray, aided greatly in
reducing any water related damage for the remaining cameras.
The use of additional power through trail camera solar panels, were not a consistent reliable source of power.
Depending on available current, the camera could switch between internal battery source and external solar.
However, with the camera’s preference to connect via external, the solar would connect whenever enough charge
was present, but then disconnect repeatedly. This created a disrupted record as the camera would be turned off
for certain amounts of time. It is recommended a high-quality solar panel connected to a large deep cycle battery,
is to be used as a consistent long-term source of power.
To determine changes in behavioural responses to a long-term bait source, videos were analysed, and individual
responses were identified as either interested (directly interacting with the bait bottle) or not interested (walking
past in background or foreground but not stopping or pausing to investigate bait). Wombats, crows, brushtail
possums and smaller mammals (Antechinus and Rattus sp.), showed a distinct interest over the four to five-month
period (Table 2). We were unable to individually identify species and therefore if there were numerous repeated
visits by select individuals. Fox interactions were nearly all described as fearful or cautious at our camera trap
sites, possibly due to remains of human scent and/or sounds emitted from the camera (Meek et al. 2014). After
nearly three months, foxes were first observed displaying direct interest in the bait without fear.
One record of our target species, the cryptic and threatened spotted-tailed quoll, occurred at a non-baited site.
The quoll displayed interested in the ruler attached to the tree. The low resolution of the emailed photo meant
individual identification via spot patterns, was unachievable.
In summary, this study has identified the possibility of using remote cameras with emailing capabilities to create
a live monitoring program. The long-term bait stations can last up to five or more months at a time, before
needing replenishment. These long-term placements reduce fort-nightly or monthly field effort and reduces the
influence of human scent on visitation by certain wildlife. The camera is also able to notify researchers that
battery levels are low, meaning visits are efficient as they occur only when needed.
Table 2. Number of visits to baited and non-baited sites, and behavioural responses to long term bait stations.
Species Baited cameras Non-baited cameras Comments and
Observations
Interaction No interaction
with bait with bait
Wombat 13 4 8 Interested
Fox 10 4 4 Interested/fear
Ringtail Possum 1 1 0 Interested
Brushtail possum 7 1 0 Interested
Wallaby 6 2 14 Interested
Bandicoot 1 3 1 Interested
Potoroo 0 7 19 Not interested
Crow 50 0 0 Interested/feeding
Quoll 0 0 1 Interested
Smaller mammals 203 49 21 Interested/feeding
Cat 1 0 0 Interested
Lyrebird 0 19 3 Not interested
11References
Carricondo-Sanchez, D., Odden, M., Linnell, J. D., & Odden, J. (2017). The range of the mange: Spatiotemporal patterns of sarcoptic
mange in red foxes (Vulpes vulpes) as revealed by camera trapping. PloS one, 12(4), e0176200.
Fleming, P., Meek, P., Banks, P., Claridge, A., Sanderson, J., & Swann, D. (2014). Camera trapping: wildlife management and research.
Csiro Publishing.
Meek, P. D., Ballard, G. A., Fleming, P. J., Schaefer, M., Williams, W., & Falzon, G. (2014). Camera traps can be heard and seen by
animals. PLoS One, 9(10), e110832.
Michler, F. U., Köhnemann, B. A., & Roth, M. (2008). Camera traps–a suitable method to investigate the population ecology of raccoons
(Procyon lotor L., 1758). Poster. DGS, Wenen, Oostenrijk.
O'Connell, A. F., Nichols, J. D., & Karanth, K. U. (Eds.). (2010). Camera traps in animal ecology: methods and analyses. Springer
Science & Business Media.
Towerton, A. L., Penman, T. D., Kavanagh, R. P., & Dickman, C. R. (2011). Detecting pest and prey responses to fox control across the
landscape using remote cameras. Wildlife Research, 38(3), 208-220.
Chantelle Doyle
ECA Conservation Research Grant Recipient- 2019
Moving Threatened Plants: Story and Practice
Chantelle Doyle,1 Mark Ooi1
1
Centre for Ecosystem Sciences, School of Biological Earth and Environmental Sciences, University of New South
Wales, Sydney, Australia.
Email: chantelle.doyle@student.unsw.edu.au
The question
What are the common surprises, successes and pitfalls of translocating threatened plant species?
To find out, researchers at The University of New South Wales (UNSW) are partnering with the Australian
Network for Plant Conservation (ANPC) to ask these questions using mixed methods of research.
Translocation is defined as the movement or direct transport of plant material from one place to another, and
encompasses salvage (or mitigation), introduction, reintroduction and augmentation (Commander, 2018).
However, the term translocation refers only to the action of moving plants, underlying this action, practitioners
have different motivations and perspectives, and are drawn from diverse and varied fields.
Undertaking a translocation relies on multiple factors, which may include location, time, cost, client expectation,
species life history and ecology, type of translocation, population relatedness, propagule type and propagule
quantity. Translocation is a simple word, which belies the potential complexity of numerous associated actions.
Answering the question then, “What are the common surprises, successes and pitfalls of translocating threatened
plant species?”, is also subjective and dependent on intentions and expectations. Our research needs to reflect
individual experiences, that is why we are asking you to contribute your perspective.
Currently we are seeking consultants who have experience in moving threatened plants to contribute to our
research through either:
• A confidential interview where participants can nominate to remain unidentified and/or
• A showcase story of your work communicated in a 30 min podcast and 5-minute mini documentary. An
example of our first three stories can be found at www.plant-heroes.com
The documentary series will also be promoted by the ANPC through social media and in a series of three
translocation workshops planned for 2022.
12To date we have commenced three mini documentaries all of which were conducted for conservation purposes.
These were Allocasuarina portuensis (Nielsen Park She-oak) (Plate 1), Wollemia nobilis (Wollemi Pine) (Plate 2) and
Grevillea wilkinsonii (Tumut Grevillea) (Plate 3). However, we want to explore the other side of translocation;
those projects conducted as part of mitigation or salvage.
Why is this relevant?
Although there have been reviews into translocation (Falk et al., 1996; Gallagher et al., 2015; Godefroid et al.,
2016; Godefroid et al., 2011; Hancock et al., 2014) and guidelines are in place to inform planning and preparation
(Commander, 2018; IUCN, 2013; Maschinski et al., 2017), these are not intended to represent the subjective
experiences of practitioners, per se, despite the inclusion and even dedicated production of valuable case studies
(e.g. IUCN Global Reintroduction Perspective series). These documents are not intended to directly portray the
complexities (and realities) of stakeholder relationships, budgets, legislative requirements, funding cycles and
timeline variations. Further, the communication medium for more detailed published results is often accessible
only to those within the intended audience. Thanks to the work of Silcock et al., (2019) we know that of 1181
translocations documented in Australia, 787 have occurred for conservation purposes, of which only 109 have
been published in peer reviewed literature. Of those, how many are behind pay walls inaccessible to non-
academic audiences? A further 390 translocations were conducted as mitigation or salvage translocations, all with
unknown publication status. These reports are commonly restricted to grey literature and difficult to access due
to client confidentiality or a required knowledge of the project or may not be stored in a publicly accessible
database.
Given that translocation practice has doubled in Australia since 2010 (Silcock et al., 2019) and will surely continue
to rise under pressures of urbanisation and increasing population, conserving threatened flora will rely on
iterative and shared learning. Certainly, it is important to understand what has worked, but of equal importance
to learning is an understanding of the challenges, limitations, setbacks and outright failures, and how these were
navigated. Planning for a best practice translocation also requires, where possible, a thorough estimate of
necessary resources (labour and cost), time requirements, as well as an adequate understanding of the target
species ecology and potential ecological limitations to establishment of a long-term self-sustaining population,
assuming self-sustaining is the agreed measure of success (Menges, 2008; Monks et al., 2012).
What research is being conducted?
Using qualitative research, our project draws on practitioner experience to critique practical requirements of
translocations and draw (some) conclusions about its application. Specifically, we aim to identify:
1. Timelines, resources and cost requirements (including in-kind/volunteer) of a translocation.
2. Practitioner experiences in and opinions of translocation practice, including successes and challenges.
3. If there is a difference between salvage/mitigation translocations (normally undertaken for developments or
part of conditions of consent) and conservation translocations (i.e. those undertaken purely to reduce
extinction risk, without a legislative compulsion).
We are using semi structured interviews with a range of practitioners (e.g. researchers, consultants, community
groups) to combine the opinions into:
a) a review of trends between individual experiences and projects
b) an analysis of some of the most commonly shared perspectives and
c) a sharable and accessible mini documentary and podcast series which will complement existing guidelines
(Commander, 2018; Maschinski et al., 2017). This information can be disseminated publicly to raise interest
in plant conservation and link different stakeholders working in both conservation and mitigation
translocation.
13We hope that this research and mini documentary series will provide a novel communication tool to help inform
effective decision making about the appropriateness of translocation as a conservation or mitigation action
(Germano et al., 2015). Open accessibility will also mean that the series can be used as an introductory platform
for non-academic audiences, including community groups, developers and legislators, without the time or need
to access academic literature and a way to share the experience of consultants, who may not normally share
results outside client reports. This series also aims to acknowledge the individuals and teams that donate,
provide “in-kind” or un-costed overtime to and whose efforts are often critical to maintaining and monitoring
translocated populations.
Get involved!
If you would like to know more, or think you have a story to tell, please get in touch via www.plant-heroes.com
or email chantelle.doyle@student.unsw.edu.au. We would also appreciate any feedback to improve our series to
be submitted via Plant Heroes Survey.
References
Commander, L. E., Coates, D.J.,Broadhurst, L. ,Offord, C.A., Makinson, R.O. and Matthes M. (2018). Guidelines for the Translocation
of Threatened Plants Third Ed.: Australian Network for Plant Conservation Inc
Falk, D. A., Millar, C. I., and Olwell, M. (1996) Restoring diversity: strategies for reintroduction of endangered plants: Island Press,
Washington, DC.
Gallagher, R. V., Makinson, R. O., Hogbin, P. M., and Hancock, N. (2015) Assisted colonization as a climate change adaptation tool.
Austral Ecology, 40, 12-20.
Germano, J. M., Field, K. J., Griffiths, R. A., Clulow, S., Foster, J., Harding, G., and Swaisgood, R. R. (2015) Mitigation‐driven
translocations: are we moving wildlife in the right direction? Frontiers in Ecology and the Environment, 13, 100-105.
Godefroid, S., Le Pajolec, S., and Van Rossum, F. (2016) Pre-translocation considerations in rare plant reintroductions: implications for
designing protocols. Plant ecology, 217, 169-182.
Godefroid, S., Piazza, C., Rossi, G., Buord, S., Stevens, A.-D., Aguraiuja, R., . . . Iriondo, J. M. (2011) How successful are plant species
reintroductions? Biological Conservation, 144, 672-682.
Hancock, N., Gallagher, R., and Makinson, R. (2014). Monitoring and prioritisation of flora translocations: a survey of opinions from
practitioners and researchers. In Report to the Biodiversity Hub of the NSW Office of Environment and Heritage https://
www.mq.edu.au/__data/assets/pdf_file/0009/82557/Monitoring20and20prioritising20translocations.pdf.
IUCN, S. (2013) Guidelines for reintroductions and other conservation translocations. Gland Switz Camb UK IUCNSSC Re-Introd Spec
Group.
Maschinski, J., and Albrecht, M. A. (2017) Center for Plant Conservation's Best Practice Guidelines for the reintroduction of rare plants.
Plant Diversity, 39, 390-395.
Menges, E. S. (2008) Restoration demography and genetics of plants: when is a translocation successful? %J Australian Journal of
Botany. 56, 187-196. doi:https://doi.org/10.1071/BT07173
Monks, L., Coates, D., Bell, T., and Bowles, M. L. (2012). Determining success criteria for reintroductions of threatened long-lived
plants. In Plant Reintroduction in a Changing Climate (pp. 189-208): Springer.
Silcock, J. L., Simmons, C. L., Monks, L., Dillon, R., Reiter, N., Jusaitis, M., . . . Coates, D. J. (2019) Threatened plant translocation in
Australia: A review. Biological Conservation, 236, 211-222. doi:https://doi.org/10.1016/j.biocon.2019.05.002
14Plate 1. Filming for case study of Allocasuarina
portuensis translocation project. Pictured Mark
Viler (Australian Botanic Garden Mt Annan
and videographer Michael Lawrence-Taylor)
Photo: Chantelle Doyle
Plate 2. Heidi Zimmer (NSW Department of
Planning Industry and Environment) and Ian
Allen inspecting translocated Wollemi Pine,
burnt in 2019/2020 fires. Photo: Michael Lawrence
-Taylor
Plate 3. Tumut Grevillea flower, a
critically endangered species restricted
to a 6km stretch of the Goobarragandra
River near Tumut. Photo: Chantelle
Doyle
15Grant Webster
Terrestrial Ecology Research Grant Recipient- 2019
Ecology and Conservation of Mahony’s Toadlet (Uperoleia mahonyi):
Determining the Required Survey Effort for an Endangered Frog
Grant N. Webster
Supervisors: Dr Deborah Bower and Dr Simon Clulow
Abstract
Vegetation mapping frequently acts as a proxy for threatened species occurrence in environmental impact
assessments. One threatened species listed as Endangered in New South Wales, and subject to ongoing
development in its range, is the recently described and apparently range restricted myobatrachid frog Uperoleia
mahonyi (Mahony’s Toadlet). Despite this, its ecology and habitat preferences remain largely unknown
preventing effective conservation action. Broadly, associations with eight particular plant community types
(PCTs) have been observed for U. mahonyi including affinities for forest and sedgeland on coastal sands; swamp
oak forest; swamp sclerophyll forests; and heath, wallum and forest on sandplains. We investigated the
relationship between U. mahonyi occurrence and PCTs throughout its range. We determined detection probability
by conducting repeated surveys at five sites where U. mahonyi presence is known, followed by conducting
occupancy surveys throughout areas predicted to be “occupied” and “unoccupied” based on models created
from vegetation mapping provided by the New South Wales Department of Planning, Infrastructure and the
Environment. Two hundred surveys sites were identified and surveys were carried out at 56 of these sites to date
(the remainder are ongoing). This tests the hypothesis that vegetation mapping can act as a suitable proxy for
threatened amphibian occurrence, allowing us to examine the efficacy of “like-for-like” vegetation offsetting as a
means of mitigating impacts to threatened species. We have also gathered data on calling phenology through
establishing AudioMoth automated acoustic recorders at ten known breeding sites, and contributed to studies on
the prevalence of chytrid fungus throughout its range. Additionally, we collected tissues to investigate where
distinct populations occur and how much gene flow is occurring across the landscape.
Plate 1. Mahony’s Toadlet (Uperoleia
mahonyi) from Norah Head showing
characteristic colour patches and mark-
ings. Photo by Grant Webster.
16Results to Date
Determining detection probability and seasonality for U. mahonyi
We established detection probability under an occupancy modelling framework through repeated surveying of
five sites that we knew were occupied by U. mahonyi (Table 1). Survey sites consisted of a 50 x 50 m quadrat and
included both an area of land prone to inundation (“water area”) and an area which remained permanently dry
(“land area”). Surveys lasted one hour and were conducted after sunset. Each survey consisted of, 5 minutes
listening at the start of the hour for calling males, followed by 55 minutes of active searching. Habitat and climatic
covariates recorded at the start of each survey included:
• Water availability i.e. the relative fullness of the pond (or “water area”) on a scale of 0-10;
• Relative humidity (%);
• Weekly rainfall (mm); and
• Air temperature (°C).
Water availability, relative humidity and weekly rainfall were all positively associated with detection, while air
temperature was negatively associated. Detection time (i.e. duration of the survey in minutes before the species
was detected) was recorded, with greater water availability, high humidity, more rainfall and cooler
temperatures being associated with shorter detection time. A total of 142 detection surveys were carried out with
surveys occurring in all months of the year to test for seasonality.
Table 1. Location of sites surveyed to calculate detection probability and the resulting naïve and modelled detection probabilities
at each.
Site No. Detections No. Surveys Naïve Probability Modelled Probability
All 70 142 0.49 0.49
Norah Head 10 34 0.29 0.65
Masonite
2 12 0.17 0.30
Road
Oyster Cove 16 28 0.57 0.43
Fingal Bay 40 46 0.87 0.54
Treachery
2 22 0.09 0.36
Swamp
Uperoleia mahonyi was detected on 70 of the surveys resulting in an overall detection probability of 0.49. There
was substantial variation in naïve detection probability between the five sites ranging from 0.09 to 0.87 (Table 1).
For detection probability, models with the most support all included water availability (fullness) and humidity
(Table 2) indicating that these were the most important covariates influencing detection. Perhaps surprisingly,
season was not significantly correlated with detection and U. mahonyi was detectable in all months of the year,
although active chorusing appeared to commence in mid-July and continued until mid-April. The average time to
first detection was 13.8 minutes (although ranged between 0 and 60 minutes), with 95% of all detections occurring
by 44 minutes. Modelled detection probability, which incorporated the influence of covariates also varied
between sites ranging from 0.30 to 0.65 (Table 1), was then used to guide the appropriate number of surveys
required to obtain 95% confidence of absences at sites.
17Table 2. Occupancy models used to establish the influence of covariates on detection probability.
Rank Model DAIC Weight
1 psi~1,p~fullness+humidity 0 0.45
2 psi~1,p~fullness+humidity+rainfall 0.39 0.37
3 psi~1,p~fullness+temperature+humidity 1.79 0.18
Occupancy surveys and model evaluation
We then conducted surveys to test the accuracy of the vegetation model using a similar methodology to the
detection surveys; however survey time was reduced to 44 minutes. Sites were repeatedly surveyed to establish
either (1) presence of U. mahonyi at the site; or (2) a 95% confidence of an absence based on the corresponding
number of surveys required to achieve this level of confidence, by incorporating the modelled detection
probability for specific survey conditions, using the following formulae:
1. k = log(1-p*)/log(1-p) and;
2. p* = 1–(1-p1)(1-p2)(1-p3)…(1-pk)
Where:
• k = number of surveys
• p = detection probability
• p* = overall detection probability (i.e. at least 0.95)
Formula 1 was used when p was constant for each survey, while formula 2 was used when p varied between
surveys. Detection probability of each survey was established following the completion of the survey by
incorporating the covariates of water availability, humidity, air temperature and weekly rainfall and is based on
the detection probability modelling following the initial detection probability surveys.
Based on the modelled detection probability, water availability and relative humidity had a large positive effect
on detection and the required number of surveys varied widely depending on these covariates (Table 3). For
example, to reach a 95% confidence of a true absence, 55 surveys would be required if water availability was 0
and humidity was 41.3%; however if humidity was 100% only four surveys are needed. Further, if water
availability was 10, the number of required surveys ranges from eight to two, given humidity values of 41.3% and
100% respectively. However, this is true when air temperature and weekly rainfall are held at the observed
median values and the number of required surveys changes slightly under different values for temperature and
rainfall. Our analysis demonstrates how important it is to survey in favourable conditions in order to maximise
detection probability. Consequently, surveys for this species should be conducted when breeding ponds contain
water and humidity is high; and ideally from late winter to early autumn.
At the time of writing, 170 surveys from 56 sites have been conducted, with surveys completed at 47 sites to the
level of either confirmed presence, or 95% confidence of true absence. Uperoleia mahonyi was detected at 16 of
these sites (Figure 1) and at other locations incidentally during fieldwork, bringing the total number of point
localities for the species to 167. This is an increase of 76 localities since the start of this project, with almost all of
these resulting from this study. As the fieldwork has not yet been completed, and thus the final accuracy of the
vegetation model has not been determined, although U. mahonyi has so far only been detected at 36% of sites
predicted to be “occupied” under the models and at no sites predicted to be “unoccupied”.
18Table 3. Number of surveys required to achieve a 95% confidence of an absence for different values of relative humidity (%) (x-
axis) and water availability (pond fullness) (y-axis).
41.3 52.5 61.5 66 69.7 75.1 80 82.6 85 90.1 94.8 100
16.
0 54.6 31.0 19.8 13.4 10.4 8.4 7.2 6.7 5.4 4.5 3.7
0
13.
1 44.2 25.2 16.2 11.0 8.6 7.0 6.0 5.7 4.6 3.9 3.2
1
10.
2 35.9 20.6 13.4 9.2 7.2 5.9 5.1 4.8 4.0 3.3 2.8
8
3 29.2 16.8 11.0 9.0 7.6 6.1 5.0 4.3 4.1 3.4 2.9 2.5
4 23.8 13.8 9.1 7.5 6.4 5.1 4.2 3.7 3.5 3.0 2.6 2.2
5 19.4 11.4 7.6 6.3 5.4 4.4 3.6 3.2 3.1 2.6 2.3 2.0
6 15.9 9.4 6.4 5.3 4.6 3.7 3.2 2.8 2.7 2.3 2.0 1.8
7 13.1 7.9 5.4 4.5 3.9 3.2 2.8 2.5 2.4 2.0 1.8 1.6
8 10.8 6.6 4.6 3.9 3.4 2.8 2.4 2.2 2.1 1.8 1.6 1.4
9 9.0 5.6 3.9 3.3 2.9 2.5 2.1 2.0 1.9 1.6 1.5 1.3
1
7.5 4.7 3.4 2.9 2.6 2.2 1.9 1.8 1.7 1.5 1.4 1.2
0
Figure 1. Occupancy surveys conducted to date. Circles indicate sites predicted to be “occupied” by the models, while diamonds
indicate sites predicted to be “unoccupied”. Red indicates a site where surveys have been completed but the species was not
found. Green indicates a site where surveys have been completed and the species was detected. Yellow indicates a site where sur-
veys have been completed and the species was detected adjacent to the site, although not at the site itself. Grey indicates sites that
have commenced but not yet been completed and black dots show sites that will be surveyed in coming months.
19Assessing the Ecological Impacts of Edge Effects
James Gleeson
Resource Strategies
It is common for developments to be constructed adjoining the boundaries of natural habitats or for
developments to create new habitat edges via clearance or disturbance of natural vegetation. Under the New
South Wales (NSW) Biodiversity Assessment Method (Department of Planning Infrastructure and Environment
[DPIE], 2020), it is a requirement to assess how ‘edge effects’ due to a development might reduce the viability of
natural habitat. In order to do this, there needs to be an understanding of what edge effects are, how they
influence ecological processes and what factors might need to be considered.
I have prepared this short article as it is apparent that there is room for improvement in the way edge effects are
assessed and, although there is a wealth of scientific research on edge effects, there is a lack of literature on how
edge effects might be assessed in the context of ecological impact assessment.
What are Edge Effects?
Edge effects describe changes in biological and physical conditions that occur both at an ecosystem boundary and
within the adjoining habitat as a result of those changes at the boundary. In natural ecosystems, edge effects
occur at ecotones between ecological communities, often adding to the complexity or variety of habitats in that
location. For example, Berry (2001) found an increased diversity of birds at edges compared with a forest interior
due to increased foraging opportunities. Interestingly, the creation of edges through forestry activities was once
promoted as a means of enhancing habitat for wildlife prior to ecological research in the late 1970s which
highlighted the negative impacts from modifying formerly intact habitat (Temple and Flaspohler, 1998). Creation
of new habitat edges is often coupled with other impacts such as habitat fragmentation or patch shape changes
(e.g. increased perimeter to area ratios).
Edge effects can be complex, so for the purpose of assessing the likelihood of potential impacts, the concept can
be broken down into simple components as described below.
Clearance or Disturbance
Creation of a new edge in a development context generally begins with clearance or disturbance. The estimate of
the clearance footprint should account for all physical damage to trees and other vegetation that occurs along
boundaries, including any fallen timber or soil disturbance. In terms of a development, there may be other
disturbances on the edge, e.g. pollution, fertiliser, dust (Farmer, 1993) or artificial lighting (Barber-Meyer, 2007).
Abiotic Changes
Abiotic environmental changes typically occur on the newly created edge; this could include more intense or
longer duration of sunlight, change in temperature, altered evapotranspiration, increased wind or changes to
surface water flow (Pohlman et. al., 2009; Harper et. al., 2005; Hobbs and Yates, 2003). Closed habitats (forests with
microhabitats) may be more likely to be susceptible to abiotic environmental changes than open habitats due to
what is known as patch (or edge) contrast - the difference in composition, structure, function, or microclimate between
adjoining ecosystems on both sides of the edge (Harper et. al., 2005; Ries et. al., 2004; Hobbs and Yates, 2003).
Structural Changes
Environmental changes at a newly created edge can effect plant productivity, nutrient cycling, decomposition
and dispersal (Harper et. al., 2005). This can lead to structural responses such as changes to canopy cover, tree
density, downed wood, leaf area and vegetative biomass. For example, for closed habitats (e.g. forests), there can
20be an increase in growth of light-demanding flora at the expense of light-sensitive species, as well as increases in
sapling density, recruitment and understorey cover along an edge (Bach et. al., 2005). The author has observed
that the structure changes are likely to be less in open Eucalypt woodlands where the edge habitat is not as
readily distinguished from the interior habitat of the patch. Lindenmayer and Fischer (2013) recognise that
Eucalypt woodlands may have a lower edge contrast with surrounding cleared areas compared to tropical
forests.
Species Response
The species response to edge effects varies depending on the ecological traits of the species and characteristics of
the edge. Some species live solely within a patch and avoid habitat edges, other species use the edges as part of a
larger home range, and some species prefer only the edges. For example, Bragg (2005) identified three reptile
species with different responses to habitat edges delimiting open-forest and regenerating sand-mined areas at
Tomago, NSW. Indirect biotic edge effects (e.g. predation, competition [e.g. aggressive behaviour of noisy miners
(Piper and Catterall, 2003)], breeding and dispersal) have been shown to occur in some situations and not in
others. For example, the results from nest predation studies are mixed (Ries, 2017; Boulton and Clarke, 2003;
Lahti, 2001).
Assessing the Ecological Impacts of Edge Effects
From a review of literature on the topic, additional survey data may need to be gathered beyond that prescribed
in the NSW Biodiversity Assessment Method (DPIE, 2020) to better describe the edge effects from a development.
The information listed in Table 1 may be worth documenting in an ecological impact assessment to estimate
possible or likely impacts from edge effects.
In the context of ecological impact assessment, edge effects are often assessed as a certain distance of possible
adverse impacts into natural habitat. In the literature, the term ‘Distance of Influence’ is used to describe the
distance from the edge into the community over which there is a significant influence – typically a gradient from
the edge to the core habitat (Harper et. al., 2005). The gradients are highly variable and can be sharp or gradual
depending on the ecological attributes of the relevant habitat.
Edge effects are not always limited to a change in the habitat at the ecosystem boundary, but rather can influence
the ecology of the patch as a whole or the ability of some species to use the patch. This is particularly true of small
patches of habitat that may suffer reduced species diversity due to edge effects (Lindenmayer and Fischer, 2013;
Bennett and Saunders, 2010; Ries et. al., 2004).
Measures to Avoid or Mitigate Ecological Impacts from Edge Effects
Edge effects result from local impacts on extant vegetation next to a development. Therefore, local measures to
avoid or minimise the adverse impacts of edge effects (where it is possible to do so) are likely to be more
successful at addressing the issue rather than creating a biodiversity offset elsewhere. Measures that may be
worth considering to avoid or minimise impacts from edge effects include (but are not limited to):
• re-positioning the development to avoid habitat that may have a higher sensitivity to edge effects (e.g. more
elevated dryer woodland would likely be less susceptible than a closed riparian forest);
• re-positioning the development to result in edges that maintain viable patch sizes and reduce
fragmentation;
• setting the development back from (buffering) existing habitat edges;
• careful clearing of vegetation to avoid excess damage;
• revegetation along habitat edges to maintain a greater area of core habitat;
• improving quality of the remaining habitat or core habitat through management measures (to compensate
for edge impacts);
21You can also read