Voter Engagement and Satisfaction with California's Local School Governance
←
→
Page content transcription
If your browser does not render page correctly, please read the page content below
Voter Engagement and Satisfaction
with California’s Local School
Governance
Evidence from the 2021
PACE/USC Rossier Poll

Jacob D. Alonso
Julie A. Marsh
Eupha Jeanne Daramola

In this brief, we use data from the 2021 PACE/USC Rossier Poll to report on California voters’ attitudes
towards and engagement with local school district governance. Generally, our findings show relatively
high support for school boards among California voters, although voters were less satisfied with school
board performance in the context of the pandemic. Patterns of engagement also changed during
the past year: some voters, particularly parents and higher income individuals, became more engaged
in educational issues; others felt compelled to be more involved because they were unhappy or
dissatisfied with educational systems. Our findings also highlight patterns of racial, socioeconomic, and
partisan divisions in school district governance. In particular, Black voters and low-income voters
were most likely to report dissatisfaction and feel less valued by their local school boards.

August 2021
Introduction

            California has long invested in local control of its K–12 public schools. While the
    state’s education code directs many actions, local leaders in the 1,037 school districts retain
    considerable authority over decisions governing how children are educated. School boards are
    particularly influential, providing fiscal oversight and accountability for the actions of professional
    administrators and educators. In 2013, state leaders doubled down on this belief with the Local
    Control Funding Formula (LCFF), a finance and accountability system granting district leaders
    more say over the allocation of state funding. State requirements for stakeholder engagement
    in LCFF decisions further endorsed principles of local control—defining new roles for parents,
    educators, and other community members.

            The events of the past year have put local control to the test. While the majority of
    California schools closed in March 2020, state leaders left decisions about reopening and the
    nature of online, hybrid, and in-person learning during the pandemic to local leaders. Faced
    with often competing pressures from parents, public health officials, educators, and their unions,
    as well as intense media attention and public scrutiny, school boards were asked to make
    consequential decisions affecting the education, health, and well-being of millions of children
    (and their families). Social unrest and heightened awareness around issues of racial injustice
    during this past year also compelled some school boards to act—be it through proclamations
    that Black Lives Matter, renaming schools, or instituting new programs and curricula focused on
    highlighting structural racism.

            In this report, we take stock of the local governance of public schools during the turbulence
    of the past year. During the LCFF years, we learned from past PACE/USC Rossier polls1 that, despite
    state and local efforts to engage the public in local education decision-making, few voters were
    aware of these opportunities and even fewer participated. Yet many voters also expressed interest
    in being involved in decisions affecting local schools.2 Years of research also demonstrate that voter
    turnout in local school board elections is consistently low3 and that lower income and historically
    marginalized individuals are less likely to participate in district decision-making.4 Now, the pandemic
    has created new local dynamics; most importantly, public education has moved to the center of
    public debate, and political and racial polarization has increased statewide.5 How have the events
    of this past year affected local engagement in educational decision-making? To what extent
    were voters engaged in local educational decisions and issues, and why? How do they perceive
    their local school boards, whose members are ostensibly elected to represent voter needs and
    interests?

2   Voter Engagement and Satisfaction with California’s Local School Governance
Policy Analysis for California Education
We answered these questions using data from the May 2021 PACE/USC Rossier poll of
registered California voters6 to highlight five main findings:
1. Voters rated boards as generally effective, but they felt less positive about board
impact and performance during the pandemic, with divisions by race/ethnicity
and party
2. Voters were similarly divided on whether boards were responsive to community
needs during the pandemic
3. Voters wanted to be more involved in education decisions and felt that boards
valued their input, with important differences along race and party lines
4. Voter involvement in educational issues changed substantially during the
pandemic, especially for parents
5. The biggest reported drivers of increased voter engagement in educational
issues were dissatisfaction with education systems and increased prominence of
education in public discourse
1. Voters rated boards as generally effective, but they felt less positive about board impact
and performance during the pandemic, with divisions by race/ethnicity and party
When asked whether school boards have a positive or negative impact on the quality of
education in K–12 schools in California, voters were split. More voters believed school boards had
a positive impact (44 percent) than negative (32 percent), and only a small percentage believed
they did not have much impact at all (6 percent, with 18 percent reporting “don’t know”). As
Figure 1 shows, perception of school board impact varied substantially by voter characteristics;
the majority of Democrats (54 percent) reported a positive impact while 46 percent of Republicans
reported a negative impact. And more Black (50 percent) and Latinx (51 percent) voters also
felt that the impact was positive, compared to White (43 percent) and Asian (36 percent) voters.
We also observed differences based on whether voters were parents: 59 percent of parents
believed boards had a positive impact compared to 40 percent of non-parents.
edpolicyinca.org 3Figure 1. Perceptions of School Board Impact on the Quality of Education in K–12 Schools
in California7
70
59
60
54
50 51
Percentage of voters
50 46
44 43
40
40 36 34
32 32 34 33
30 27 26
23 24
20
10
0
All voters Democrat Republican Black Latinx Asian White Parents Non-parents
Positive Negative
Note. Respondents were also given a response option of “don’t know” and “not much impact.”
At the same time, school boards had the lowest approval relative to other public officials
when voters were asked about board handling of education during the pandemic (see Figure 2).
Nearly half of voters approved of how school boards handled the pandemic, but their approval
(47 percent) trailed behind that of other officials, particularly public health departments
(66 percent), which also played a highly prominent role during the COVID-19 pandemic. Approval
was also heavily associated with political affiliation: although 55 percent of Democrats felt that
school boards handled pandemic schooling well, only 39 percent of Republicans felt the same.
Figure 2. Approval of the Reopening of Schools and Educating Students During the Pandemic
for Various Local Leaders
70
60
Percentage of voters
50
40
66
30 59
49 47
20
23 22 25
10 18
0
Public health department Mayor Superintendent School board
Approve Disapprove
4 Voter Engagement and Satisfaction with California’s Local School GovernancePolicy Analysis for California Education
In general, voters seemed to have a more negative view of the school board’s role during
the pandemic than historically. In the poll, we asked a series of questions in which we asked half
of the respondents about their perceptions of school boards in general and the other half about
their perceptions of school boards during the pandemic.8 While 58 percent of voters believed
that local school boards effectively manage schools “generally,” only 45 percent agreed that this
was true “during the pandemic,” with substantial differences by party affiliation (see Figure 3).
Figure 3. Perception of School Board Effectiveness in Managing Schools, Generally and
During the Pandemic
70
Percentage of voters agreeing
60
50
40
30 63
58 54 52
45
20
32
10
0
All voters Democrat Republican
Generally During the Pandemic
These partisan divisions are consistent with other findings from this poll, which show that
78 percent of voters believed that the state of California was becoming more divided politically,
and 70 percent felt it was more divided on matters of race. California voters still felt that those
divisions existed in their own communities but were not as extreme, with 59 percent believing
their local communities were more divided politically and 47 percent on matters of race.9
2. Voters were similarly divided on whether boards were responsive to community needs
during the pandemic
One of the primary arguments in favor of school boards is that they should be well
positioned to represent community constituents’ local needs and interests in education decision-
making because they are locally elected members of the communities they serve.10 Indeed, a
large majority of voters (63 percent) agreed that school boards are generally important because
they ensure that decisions in education are made close to those who will be affected. However,
when framed around the pandemic, only 51 percent of voters believed this was true.
edpolicyinca.org 5Yet Figure 4 suggests large variation by income in whether voters perceived that boards
have lived up to their charge of responding to their communities. While higher income voters
in our sample felt the most positive about board responsiveness in general, they were less likely
to view boards as responsive when framed in terms of the pandemic. Conversely, lower income
voters were more likely to view boards as responsive during the pandemic.
Figure 4. Agreement that School Boards Are/Have Been Responsive to Community Needs,
by Income
70
60
Percentage of voters
50
40
30
53 55 55
50 48 47 46 49 46
45
20
10
0
All votersPolicy Analysis for California Education
in being involved than White voters (48 percent). At the same time, Black voters expressed the
lowest level of agreement (49 percent) that their input would be valued when making important
decisions. Democrats were much more likely than Republicans to indicate they wanted to be
more involved (56 percent and 49 percent, respectively) and similarly felt that their input would
be more valued (60 percent and 42 percent, respectively).
Figure 5. Interest in Involvement and Trust that School Boards Would Value Input in Education
Decisions, by Race/Ethnicity and Party
70
64
60
Percentage of voters agreeing
60 59 59
56
52 52
49 49 50 52 50
50 48
42
40
30
20
10
0
All voters Democrat Republican Black Latinx Asian White
"I would like to be involved in decisions about education in my community."
"I trust that school district leaders value parent and community input when making important decisions."
4. Voter involvement in educational issues changed substantially during the pandemic,
especially for parents
The COVID-19 pandemic had far-reaching effects on voters’ reported participation in local
education issues. Education issues, particularly around school closures and reopening, impacted
millions of Americans. As Figure 6 shows, 34 percent of voters reported following news on
local and state education policy decisions more in 2021 than they did before the pandemic. In
contrast, when asked about other forms of engagement, the patterns were varied. Many voters
indicated they had become less involved—or their involvement had stayed the same (representing
the majority of voters in each category)—in areas of direct political activities, including contacting
local officials, attending board meetings, contributing to or organizing campaigns, and attending
or organizing protests.
edpolicyinca.org 7Figure 6. Voter Involvement in Public Activities This Year Compared to Before the Pandemic
70
60 60 61
60 58
Percentage of voters
50 48
40
34
30
22
19 20 19
20
12 12 11 12
10
10
0
Following news on Contacting local Attending local Donating to Attending or organizing
local and state education officials board meetings elected officials, demonstrations,
education policy to express views (online or in person) campaigns, or protests, or
decisions organizations on rallies around
education issues education issues
More involved Less involved Same
Our results were complicated by two groups: parents and higher income voters.
Not surprisingly, parents stood out as the most engaged in education issues of any group in our
sample. Figure 7 indicates that more parents became involved than non-parents in every area of
political engagement compared to last year. For example, only 6 percent of non-parents attended
board meetings—either online or in person—compared to 27 percent of parents.
Figure 7. Voter Involvement in Public Activities This Year Compared to Before the Pandemic,
Parent and Non-Parent
60
50 46
Percentage of voters who
became more involved
40
30
30 27 27
22 21
20
9
10 7 6 7
0
Following news on Contacting local Attending local Donating to Attending or organizing
local and state education officials board meetings elected officials, demonstrations,
education policy to express views (online or in person) campaigns, or protests, or
decisions organizations on rallies around
education issues education issues
Parents Non-parents
8 Voter Engagement and Satisfaction with California’s Local School GovernancePolicy Analysis for California Education
Yet involvement was also closely related to income (Figure 8). Voters making over $150,000
indicated that they had become more involved in each activity we surveyed, at rates higher than
other groups. The opposite was true for those making under $35,000. Voters in the lowest income
ranges instead became consistently less involved over the past year.
Figure 8. Voter Involvement in Public Activities This Year Compared to Before the Pandemic,
by Income
Following news on Contacting local Attending local Donating to Attending or organizing
local and state education officials board meetings elected officials, demonstrations,
education policy to express views (online or in person) campaigns, or protests, or
decisions organizations on rallies around
education issues education issues
40
36 37
35 33
31
Percentage of voters
30
25
20 18
15 16
15 14 13
12 12 12
9 10 9 10 10 11 10 9
10
5
0
More involved
40
35
Percentage of voters
30 27 26 28
25 24 24
21 21 20 21
20 18 19 19 19
17 16 16
15 14 14
10 10
10
5
0
Less involved
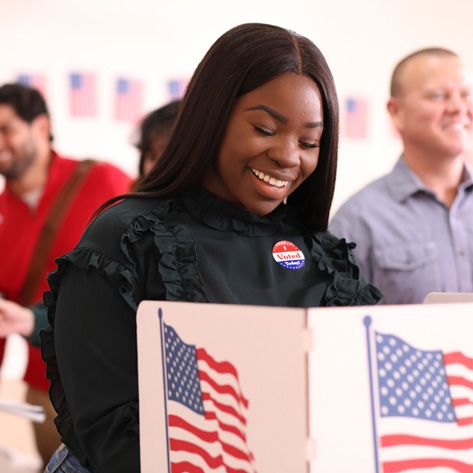
5. The biggest reported drivers of increased voter engagement in educational issues
were dissatisfaction with education systems and increased prominence of education in
public discourse
We asked voters who indicated that they had become more engaged in education issues
this past year during the pandemic what reasons contributed to that engagement.11 Although
researchers and media reports have suggested that the availability of online forums for political
engagement could increase involvement, Figure 9 illustrates that only 24 percent of voters
indicated it was important to their increased engagement. Instead, voters said they became
more engaged for two main reasons: education issues had been more prominent in national
and local news (43 percent) and dissatisfaction with the quality of education or unhappiness with
educational decisions made during the pandemic (43 percent).
Figure 9 also shows that the reasons for engagement were divided along party and race
lines, particularly so for dissatisfaction. While 53 percent of Republicans reported being more
engaged because they were unhappy with educational decisions or dissatisfied with the quality
of education, only 38 percent of Democrats reported being more engaged for these reasons.
Dissatisfaction represented the single largest motivator for increased engagement among Black
voters. While 51 percent of Black voters became more engaged due to dissatisfaction, this was
true for 40 percent of White voters and only 35 percent of Asian voters.
Conversely, some voters were pushed to be more engaged by showing support for
educators, but this motivation was divided along party lines. Of these voters who became more
involved, 44 percent were Democrats compared to 21 percent who were Republicans.12
Figure 9. Contributors to Increased Engagement in Education Issues During the Pandemic,
by Party and Race/Ethnicity
60
44 53
51
50 48
46
Percentage of more
44 45
43 43
involved voters
41 40 41 40
40 36 38 38 36 36
34 35
30 28
24 25 24
21 19 21 23
20
10
0
All voters Democrat Republican Black Latinx Asian White
Dissatisfied with the quality of education or unhappy with educational decisions
Education issues have been more prominent in national and local news
Wanting to show support for educators
Easier to engage with new technology or online offerings
10 Voter Engagement and Satisfaction with California’s Local School GovernancePolicy Analysis for California Education
As Figure 10 shows, dissatisfaction and unhappiness with educational decisions were
also substantial motivators for voters making under $35,000 per year, more than half of whom
(56 percent) indicated they were more involved due to dissatisfaction or unhappiness, while
this was true for far less than half of upper income voters.
Figure 10. Dissatisfaction and Unhappiness as Contributors to Increased Engagement in
Education Issues During the Pandemic, by Income
60
50
Percentage of more
involved voters
40
30 56
20 43
39 39
10
0ideals in practice. In this brief, we highlighted patterns of racial, socioeconomic, and partisan
political divisions in many areas of school district governance. These persistent divides were
observed in perceptions of school board effectiveness and handling of the pandemic, whether
boards responded to community needs and valued community input, motivators for engagement,
and patterns of involvement in political activities. Our findings also suggest that there are voters
who do not trust their local school boards to respond to their needs and that voters are becoming
more engaged due to dissatisfaction with board decisions. In particular, Black voters and low-
income voters were most likely to report dissatisfaction and feel less valued by their local boards.
In the coming year, local school districts will be receiving an unprecedented influx of
new federal and state funds. They will face critical decisions around health and safety, learning
loss and remediation, and racial justice. As local leaders grapple with spending these funds and
addressing students’ varied social, emotional, and academic needs in the wake of the pandemic,
we must monitor how the divisions, mistrust, and dissatisfaction that surfaced in this poll affect
their decisions. As we transition from pandemic to recovery, it will also be important to track how
school boards engage local stakeholders and which constituents’ voices are privileged in these
important conversations.
Endnotes
1
edpolicyinca.org/initiatives/pace-usc-rossier-annual-voter-poll
2
Allbright, T. N., & Marsh, J. (2019, March). Voter awareness, support, and participation in California’s Local Control Funding
Formula [Policy brief]. Policy Analysis for California Education. edpolicyinca.org/publications/voter-awareness-support-
participation-california-local-control-funding-formula
3
Allen, A., & Plank, D. N. (2005). School board election structure and democratic representation. Educational Policy, 19(3), 510–527.
doi.org/10.1177/0895904805276144; Bartanen, B., Grissom, J. A., Joshi, E., & Meredith, M. (2018). Mapping inequalities in local
political representation: Evidence from Ohio school boards. AERA Open. doi.org/10.1177/2332858418818074
4
Ishimaru, A. M., Torres, K. E., Salvador, J. E., Lott, J., Williams, D. M. C., & Tran, C. (2016). Reinforcing deficit, journeying toward
equity: Cultural brokering in family engagement initiatives. American Educational Research Journal, 53(4), 850–882;
Luet, Kathryn McGinn. 2015. Disengaging parents in urban schooling. Educational Policy 31(5):674–702. doi.org/10.1177/
0895904815616481; Marsh, J. A., Dhaliwal, T. K., Hall, M., & Polikoff, M. S. (2020). Civic engagement in education: Insights
from California’s Local Control Funding Formula. Education Finance and Policy, 15(4), 761–774; Marsh, J. A., Strunk, K. O.,
Bush-Mecenas, S. C., & Huguet, A. (2015). Democratic engagement in district reform: The evolving role of parents in the
Los Angeles Public School Choice Initiative. Educational Policy, 29(1), 51–84.
5
The first report released based on these poll results showed that more than three quarters of California voters believe the state
is becoming more divided politically, and 70 percent more divided on matters of race. See Hough, H., Marsh, J., Myung, J.,
Plank, D., & Polikoff, M. (2021, July). Californians and K–12 education amid COVID-19 recovery: Views from the 2021 PACE/USC
Rossier Poll [Report]. Policy Analysis for California Education. edpolicyinca.org/publications/pace-and-usc-rossier-polls-2021
6
Hough et al., 2021.
7
Not shown are response options “Not much impact” and “Don’t know” for the question “Agree/Disagree with the following
statement about parent and community involvement in the decision-making of local public schools and districts: During the
pandemic, locally elected school boards have been effective at overseeing and managing schools.”
8
Full results for each split can be found on the PACE website here: edpolicyinca.org/initiatives/pace-usc-rossier-annual-voter-poll/
poll-archive
9
Hough et al., 2021.
10
Marsh, J. A. (2007). Democratic dilemmas: Joint work, education politics, and community. SUNY Press; Morel, D. (2018).
Takeover: Race, education, and American democracy. Oxford University Press.
12 Voter Engagement and Satisfaction with California’s Local School GovernancePolicy Analysis for California Education
11
Respondents were given the options “My community encouraged or motivated me to act,” “It was easier to engage in these
activities with new technology or online offerings,” “Education issues have been more prominent in national and local news,”
“I have been dissatisfied with the quality of education for children in my community,” “I have been unhappy with educational
decisions made during the pandemic,” “I wanted to show my support for educators and leaders during this difficult time,”
“I needed information that was not provided elsewhere,” “Other,” and “Don’t know.”
12
Despite these partisan differences in motivators for engagement, overall, 62 percent of voters would encourage a young person
to become an educator, up from 56 percent in 2020. Hough et al., 2021.
Author Biographies
Jacob D. Alonso is a PhD student in Urban Education Policy at the University of Southern California Rossier
School of Education.
Julie A. Marsh is a professor of education policy at the University of Southern California Rossier School of
Education and a faculty director of PACE.
Eupha Jeanne Daramola is a doctoral candidate in the Urban Education Policy program at the University of
Southern California Rossier School of Education.
edpolicyinca.org 13Policy Analysis for California Education (PACE)
Improving education policy and practice and advancing equity through evidence
PACE is an independent, non-partisan research center led by faculty directors at Stanford
University, the University of Southern California, the University of California Davis, the University
of California Los Angeles, and the University of California Berkeley. Founded in 1983, PACE
bridges the gap between research, policy, and practice, working with scholars from California’s
leading universities and with state and local decision makers to achieve improvement in
performance and more equitable outcomes at all levels of California’s education system, from
early childhood to postsecondary education and training. We do this through:
1 bringing evidence to bear on the most critical issues facing our state;
2 making research evidence accessible; and
3 leveraging partnership and collaboration to drive system improvement.
Related Publications
Allbright, T. N., & Marsh, J. (2019, March). Voter Koppich, J., Humphrey, D. C., Marsh, J., Polikoff, M.,
awareness, support, and participation in California’s & Willis, J. (2018, September). Getting down to
Local Control Funding Formula [Policy brief]. facts II: The Local Control Funding Formula after
Policy Analysis for California Education. four years. What do we know? [Policy brief].
Policy Analysis for California Education.
Hough, H., Marsh, J., Myung, J., Plank, D., & Polikoff,
M. (2021, July). Californians and K–12 education Perry, M., Higbee, B., Kanga, D., Jaffe, C., & Corpuz,
amid COVID-19 recovery: Views from the 2021 G. M. (2019, April). Promising practices in local
PACE/USC Rossier Poll [Report]. Policy Analysis for stakeholder engagement in school governance
California Education. [Practice brief]. Policy Analysis for California Education.
Stanford Graduate School of Education
520 Galvez Mall, Suite 444
Stanford, CA 94305
Phone: (650) 724-2832 • Fax: (650) 723-9931
edpolicyinca.orgYou can also read