WALK. ROLL. CONNECT. Getting you where you want to go - STATE ACTIVE TRANSPORTATION PLAN PART 2 DRAFT - Online open houses
←
→
Page content transcription
If your browser does not render page correctly, please read the page content below
WALK. ROLL. CONNECT.
Getting you where you want to go

    STATE ACTIVE TRANSPORTATION PLAN
    PART 2 DRAFT
    Plan Overview Webinars
    Sept. 22, 5:30-6:30 p.m.
    Sept. 23, noon-1 p.m.
    Oct. 12, 11:30 a.m.-12:30 p.m.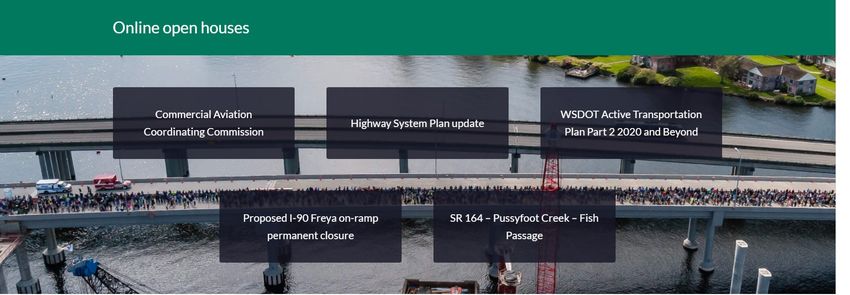
Logistics
Tech issues: If audio or slides
disappear or glitch, tell us through
the QUESTION pane and stay on the
line.
Audio: We have all participants
muted.
Recording: This presentation is
being recorded and will be linked in
online open house through Oct. 29.
Questions/Comments: Use the
QUESTION pane to ask questions
and share comments. We will read
and answer questions after the
presentation and will refer you to the
plan document for more specifics.
2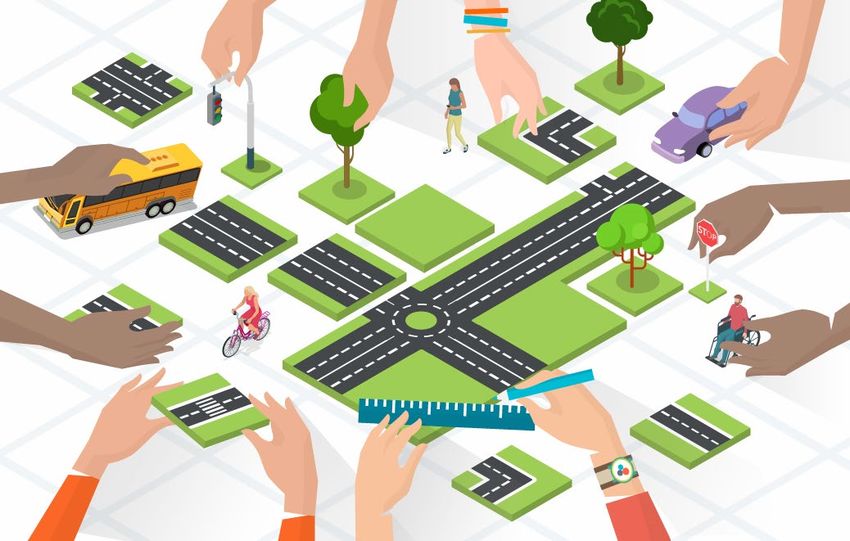
What we plan to cover

• Who the plan is for
• How to review the plan and provide input
• Overall structure of the plan
• Brief review of Part 1, published May 2021
• Performance metrics selected; more in Chapter 6
• Strategies; more in Chapter 7
• Q&A as time permits
• Next steps

WSDOT Online Open House

• Current online open houses always available at engage.wsdot.wa.gov

Active Transportation Plan
Online Open House

Statutory context
The Active Transportation Plan
(ATP) serves as a statewide
needs assessment required under
state law (RCW 47.06.100) to
address:
►statewide strategy
►integration of bicycle and
pedestrian pathways with
other road users
►coordination with local and
regional government
►the role of such facilities in
reducing traffic congestion
6
6
Definitions FYI
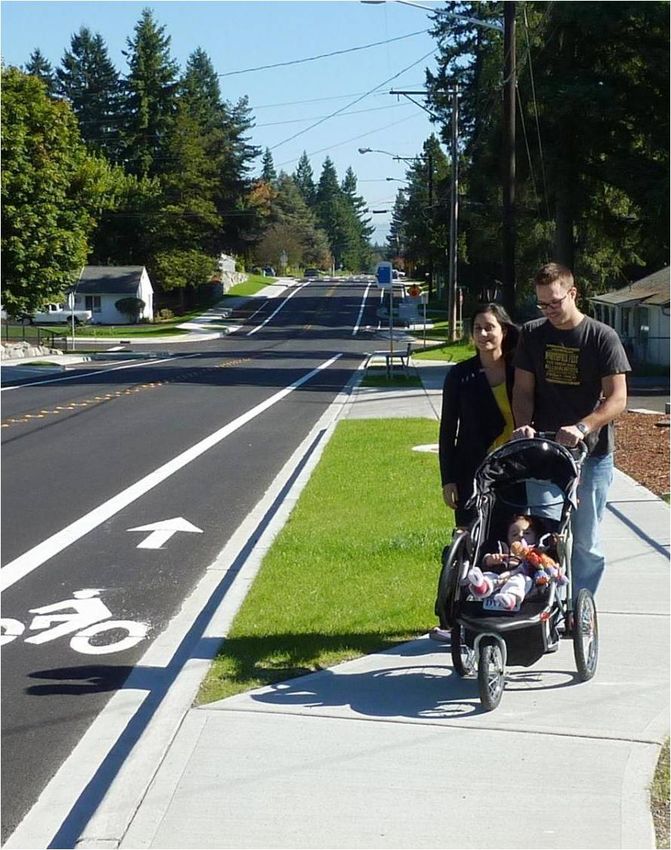
What Is Active Transportation? Who Is a Pedestrian?
Active transportation is human-scale A person walking or rolling. This term as
and often human-powered we use it includes using personal
transportation, and everyone uses it at mobility devices such as skateboards
some point in their day. It refers to and foot scooters and using mobility
getting from one place to another using assistance such as a wheelchair, cane,
walking, cycling, or rolling. 100% of or walker. This matches usage in
Washingtonians use active federal safety statistics.
transportation. More Information
Who Is a Bicyclist? You’ll find a list of terms with definitions
in Part 1 at the end of Chapter 1,
A person using some version of a
repeated in Part 2.
bicycle. This includes e-bikes and
tricycles under Washington state law.
7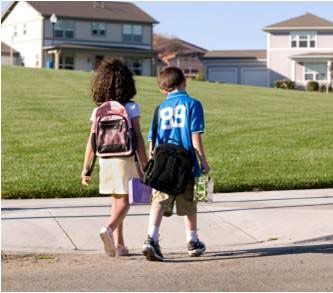
Who the plan is for
Decision makers: Context and analysis to understand needs and priorities
Transportation agencies and their constituents: Research and best
practices, information to integrate plans across jurisdictional boundaries
Public: Reference on state of active transportation, current concepts in
planning and design, baseline performance metrics WSDOT will report on in
future
WSDOT: Tools, data, and analysis to improve what we do
8
8Structure for ATP
• Part 1, 2020: Identifies the purpose and need of statewide active
transportation plan, current state and benefits of active transportation use,
results of public input during plan development, methodology and results of a
statewide needs assessment
• Part 2, 2021: Discussion of performance metrics, strategies and next steps
• In future: Regular updates to this plan, other topics addressed, crosswalk
from this plan into other plans
9
9Core concepts in plan’s focus on facilities
Safe System Approach underpinning Use of demographic information helps us
analysis: Proactive, reduce crash impact address disproportionate serious
energy injuries and deaths by applying equity
factors + safety + demand in evaluation
Level of traffic stress gives us an and future prioritization
objective, quantitative set of design
and operations factors that define gaps Estimates cost of improvements in
to improve over time (1=low, 4=high) population centers needed to reduce LTS
Focus on population centers lets us to 1 or 2
address critical safety needs and tap into Describes the concept of a statewide
latent demand where potential is highest bikeways and trails network
and majority of serious/fatal crashes occur
It takes partnership to find the best way
Latent demand is only unleashed when through for network connectivity across
you can get all the way to your jurisdiction boundaries.
destination; importance of route – Best solution for a gap on state right of
directness and crossing availability in way may be on the local system
the context of travel need
– More on ATP web page
10
10ATP goals
Connectivity: Create and connect comfortable and efficient walking and
rolling networks so people can reach their destinations and other forms
of transportation and have everyday access to physical activity.
Safety: Eliminate deaths and serious injuries of people walking and
rolling.
Opportunity: Eliminate disparities in access to safe active
transportation connections for people and communities most dependent
on walking, bicycling and transit.
Participation: Increase the percentage of everyday trips made by
walking or bicycling.
Partnership: Collaborate and coordinate with public, tribal, nonprofit,
and private partners to complete and improve the network across
11
11
boundaries.Part 2 contents
Part 2 Executive Summary
Part 1 Recap: This will be deleted when Part 1 and Part 2 are combined
Terms used in this plan
Chapter 6, Measuring and Reporting Performance and Progress: Discussion of
equity checks, performance metrics by goal, future metrics for consideration,
takeaways
Chapter 7, Strategies and Actions: Background and context, strategies by goal
area, “future watch” topics, takeaways
Chapter 8, Conclusion: Updated from Part 1 Conclusion
List of all appendices
Appendix G, Plans: Updated from Part 1 version. (Help us) Find your local plans!
Appendix K, Progress and Challenges, 2008-2021: Policy timeline
12
12Chapter 6: Performance metrics
We have performance metrics under What would you add or revise on the
each ATP goal metrics to measure meaningful actions
and outputs that lead to outcomes?
Some are required for or relate to
various state/federal reports, some Are we setting the right “target” for each
arose from our research and findings metric?
They need to be things we can
calculate statewide and collect data
on over time
We didn’t establish any timelines or
deadlines yet; implementation plan
will help put a time frame on these;
most are subject to funding
availability; many rely on partners
13Performance metrics: Connectivity
Metric Calculation Baseline Goal
Linear facilities; Network quality on Current # of miles 100% of miles in
separate calculations state routes (or on with low level of population centers
for bicyclist and nearby local route traffic stress LTS 1 or 2
pedestrian that closes the gap)
Crossings and ramp Level of traffic stress Current # of crossings 100% of crossings
junctions and ramp junctions and ramp junctions
with low level of in population centers
traffic stress LTS 1 or 2
Miles of trails or Total length in miles 1,600 miles 4,092 miles
multi-use paths of multi-use paths (estimated in
serving a conceptual plan)
transportation
function and
connecting
population centersPerformance metrics: Safety
Metric Type of measure Baseline Goal
Serious injuries and Serious injuries and 2019: 107 0 serious
deaths from traffic deaths of people pedestrians, 9 injuries/deaths
crashes walking or rolling bicyclists killed; 358 (outcome)
pedestrians, 103
bicyclists seriously
injured
Injury minimization State highway miles 90 miles 100% of highway
speed limits in population centers miles in population
with speed limit centers where
25mph or less people are permitted
to walk or bike
25mph speed limit or
lessPerformance metrics: Equity check example
Population American Asian or Black Hispanic Multiracial Other/ White
Race/Ethnicity Group Indian or Pacific Unkown Non-
Alaska Islander Hispanic
Native
Pedestrian & bicyclist 31 43 27 81 7 8 367
traffic fatalities by
population group
Percent of pedestrian 5% 8% 5% 14% 1% 1% 65%
& bicyclist traffic
fatalities
Percent of 2% 9% 4% 12% 5% N/A 70%
race/ethnicity group
in total populationPerformance metrics: Opportunity
Metric Type of Baseline Goal
measure
Percentage of
ADA-accessible highway miles with
active transportation ADA-accessible TBD 100%
facilities sidewalks in
population centers
Highway miles in
population centers
Elimination of
with pedestrian or
transportation
bicyclist LTS 1 or 2
disparities for
in places with 100% of miles in
BIPOC or low- TBD miles
higher percentage these census blocks
income people
of Black,
walking and
Indigenous, people
bicycling
of color or low-
income householdsPerformance metrics: Opportunity
Metric Type of Baseline Goal
measure
Total greenhouse
gas emissions in
Air pollution
MMT avoided Based on walk/bike Tied to Participation
emissions
(millions of metric miles traveled goal below
prevented
tons) by walking
and biking
Applications
received and
funded for the Safe
Participation in Routes to School
SRTS applications
agency grantmaking and Pedestrian/ At least 40% in
in 2020: 38.4%
by high-need Bicyclist Program each program
PBP: 16.8%
communities awards that score at
or above the 75th
percentile on equity
criteriaPerformance metrics: Participation
Metric Type of Baseline Goal
measure
Percentage of trips
Share of trips taken by (1) walking 12% (2017 NHTS) What should it be?
or (2) bicycling
Increase the
number of miles of
LTS 1 or 2 state
Bicyclist: 19 miles
Access to highways (or
on state highways Bicyclist: 779 miles
multimodal parallel local facility)
Pedestrian: 13 Pedestrian: 237
transportation within 3 miles of a
miles on state miles
connections modal connection
highways
(transit, ferry,
commuter rail, and
air)Performance metrics: Participation
Metric Type of Baseline Goal
measure
Percentage of
Transit access by people who use
85% (2017 NHTS) TBD
walking/biking active transportation
to reach transit
Ferry passengers
Walk-on or bike-on (1) 7,903,831; (2)
by (1) walk-on or (2) TBD
ferry trips 286,841 (2018)
bicycle-on
Percentage of trips
Children walking/
to school made by 11.7% 26%
biking to school
walking or biking
Percentage adults
≥18 getting
Physical activity 57.9% (2017) 67.9%
recommended
weekly levelPerformance metrics: Partnership
Metric Type of Baseline Goal
measure
# of regions with
Active
plans directly 18 (100% of MPOs
transportation TBD
addressing facility and RTPOs)
plans—regional
needs
Percentage of
Extent of reach for population served
regional active by regional active TBD 100%
transportation plans transportation
plans.
Active Counties,
39 counties and 281
transportation cities/towns with TBD
cities/towns
plans—local plans
Active
Tribal governments All 29 federally
transportation TBD
with plans recognized tribes
plans—tribalStrategies
Strategies mostly aim at WSDOT internal Do these strategies seem to be ones
processes; most are suitable for other that will improve active transportation in
agencies too the direction of the plan’s goals?
Several strategies could fit under multiple Are these the right strategies right now,
goals; tried for some balance and best fit given what we know? What would you
They operate at different levels of an
add, revise, save for later?
organization, from policy to everyday
Is a particular strategy a better fit under
practice
a different goal? Can it be combined
Strategies aren’t numbered or listed in a
with another?
hierarchy
We didn’t establish any timelines or Do you have any specific actions to
deadlines yet recommend that we can consider for
Some are subject to funding availability, the implementation phase?
some will leverage ongoing work
Sample actions in the draft aren’t a
comprehensive list
22Connectivity Strategies
Goal: Create and connect comfortable and efficient walking and rolling networks so people can reach
their destinations and other forms of transportation and have everyday access to physical activity.
• Adopt or update policies in support of network connectivity and comfort.
• Coordinate with partners for development of active transportation infrastructure
across jurisdictional boundaries.
• Identify and address data gaps including the need for comprehensive facilities
inventories.
• Provide actionable tools to inform decisions in all phases of WSDOT’s work that
affect network connectivity and comfort.
• Improve connectivity through construction of sidewalks, trails, separated bicycle
lanes, crossing and speed management treatments, operational changes, and/or
identification of local alternatives to achieve LTS 2 or better.
• Measure and report on system performance and integrate core concepts into
other agency plans.
23Safety Strategies
Goal: Eliminate deaths and serious injuries of people walking and rolling
• Adopt policies in support of the safe system approach including speed
management for safety and increase capacity in WSDOT and partners to put the
policy into practice.
• Increase ability in WSDOT and partners to create and manage active
transportation facilities that provide lower levels of traffic stress and improved
route directness.
• Improve the way active transportation access is maintained during weather
events and construction, maintenance, and other activities that affect safety and
accessibility.
• Develop proactive safety plans for each WSDOT region grounded in the Safe
System Approach, systemic analysis, this plan’s methodologies, and an equity
framework and use them to identify priority locations for improvements.
• Identify and incorporate crash data and methods of analysis for active
transportation on par with those used to evaluate the transportation system for
motorist safety.
24Opportunity Strategies
Goal: Eliminate disparities in access to safe, healthy active transportation connections for people and communities most
dependent on walking, bicycling and transit.
• Integrate equity criteria into decision making and evaluation and report on
progress.
• Clarify and strengthen connections between this plan and the ADA Transition Plan
with tools for use in analysis, design, operations, and maintenance.
• Prioritize walking and bicycling investments in historically overburdened and
transportation-disadvantaged communities and in locations where these
investments arise from local plans and priorities.
• Update policy and practices for state-administered competitive funding programs
related to active transportation to expand participation, capacity, and success for
applicants in historically underserved communities.
• Develop equity checks on other goals, report findings, and use results to adjust
future implementation efforts.
25Participation Strategies
Goal: Increase the percentage of everyday trips made by walking or bicycling.
• Increase access to transit and other modes by improving active transportation
infrastructure and/or lowering the LTS to extend mobility and access to essential
services and destinations.
• Develop and implement updates to data collection to take advantage of new
technologies, in-depth surveys, and other mechanisms.
• Develop and implement improved wayfinding, signage, route planning, and other
information resources to make the system legible and understandable for all
users.
• Evaluate and improve existing Safe Routes to School curriculum, planning, and
other programs that help increase the number and frequency of children walking
and bicycling.
• Partner with agencies and organizations to establish a central clearinghouse for
active transportation safety education and training materials appropriate for all
ages and abilities.
26Partnership Strategies
Goal: Collaborate and coordinate with public, tribal, nonprofit, and private partners to complete and improve the network across
boundaries.
• Strengthen partnership mechanisms that enable advance planning and
coordination for collaborative projects and activities throughout the network
lifecycle.
• Partner in data-sharing to identify available facilities and their quality and
condition, including ADA accessibility.
• Identify and implement process improvements to streamline agreements involving
projects on state right of way.
• Coordinate and collaborate with other state agencies where the work will advance
multiple policy goals in health, environment, commerce, recreation, education,
and equity.
• Build on this plan’s outreach and engagement relationships to develop networks
of WSDOT partners for communication, coordination, and clearinghouse
functions.
27Next Steps
►Public comment Sept. 13-Oct.
29, 2021
►Review and consider comments
►Combine Part 1 and Part 2 into
one document, eliminate
redundant information, publish by
the end of 2021
►http://bit.ly/WSDOT-ATP-Online-
Open-House
28You can also read