WARD PROFILE: PALMERS GREEN 2020 - Enfield Council
←
→
Page content transcription
If your browser does not render page correctly, please read the page content below
WARD PROFILE:
PALMERS GREEN
2020
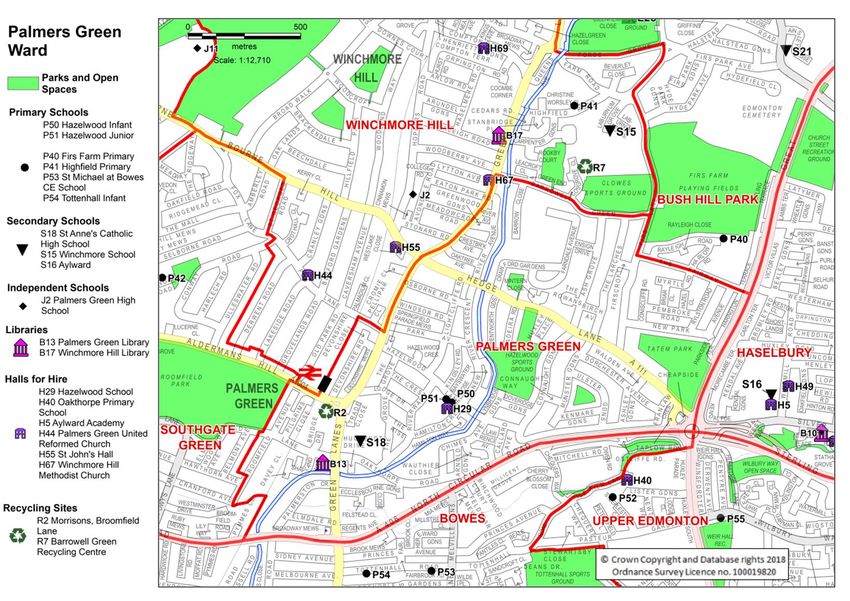
Palmers Green Ward is situated in the south-west of the Borough, bordered by Haselbury
ward to the east, Bowes ward to the south, Southgate Green ward to the west, and by
Winchmore Hill and Bush Hill Park wards to the north. It is covered by postal districts N13,
N18 and N21.
Ward Profile

This Profile is intended to provide a guide to the demography, social and economic data and
Council facilities in the ward.
It has been collated using the most up to date local-level data relating to 2019/20 as far as
possible. A variety of statistical sources, both national and local, have been used in its compilation.
Appendix A has a table of key statistics for at a glance comparison with Borough averages.

 Political Makeup

The ward is represented by the following Councillors:

 Name                         Party                   Contact                       Votes received in
                                                                                    2018 election

 Timothy Leaver               Labour                  020 8379 5452                 2,440
 Timothy Leaver
 Mary Maguire                 Labour                  020 8379 2652                 2,431
 Ahmet Oykener                Labour                  020 8351 1310                 2,144

At the 2018 council elections, voter turnout in Palmers Green was 37.1 %.
Palmers Green ward falls in the parliamentary seat of Enfield Southgate.

 Demography

Summary Statistics

                                                Palmers
 Measure                                                         Enfield      Source
                                                Green
 Population Estimate (2019)                            15,837       333,794   ONS mid-year estimates 2019
 Children aged 0-15                                     2,960        76,137   ONS mid-year estimates 2019
 Working-age people (16-64)                            10,568       213,093   ONS mid-year estimates 2019
 Older people aged 65+                                  2,309        44,564   ONS mid-year estimates 2019
 % All Children aged 0-15                                18.7          22.8   ONS mid-year estimates 2019
 % All Working-age (16-64)                               66.7          63.8   ONS mid-year estimates 2019
 % All Older people aged 65+                             14.6          13.4   ONS mid-year estimates 2019
 % BAME - 2019                                           32.2          36.6   Enfield Council Estimates 2019
 % BAME - 2011                                           35.4          39.0   Census 2011
 % Not Born in UK - 2011                                 41.4          35.1   Census 2011
 % English is First Language of no one in
                                                          18.1         14.1 Census 2011
 household - 2011
                                                                            Ministry for Housing, Communities
 Area - Square Kilometres                                  1.9         82.2
                                                                            and Local Government
                                                                            ONS mid-year estimates 2019 /
 Population density (people per sq km)                  8,335         4,061
                                                                            MHCLG

Produced by the Insight Team                                                                                    2
If you have any queries relating to this document please email KIH@enfield.gov.uk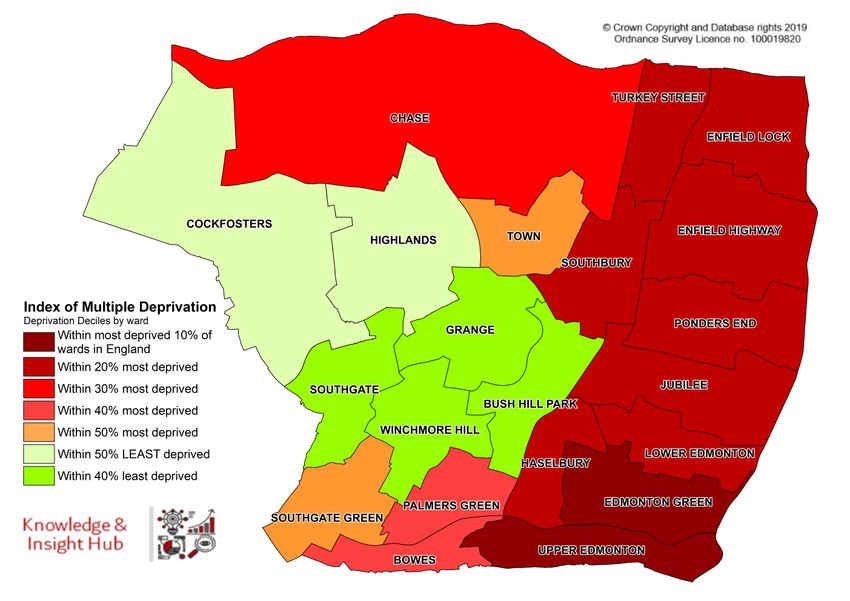
Population
According to the ONS mid-year estimate 2019, the total population of the ward is estimated to be
15,837. This is the 9th largest population of the 21 wards in Enfield.
The population of Palmers Green Ward has
increased by 4.5% since the 2011 Census
according to the estimate, which is lower
than the average increase across the
borough.
The percentages of male and female residents in Palmers Green ward are 49.8% and 50.2%
respectively. The distribution of males and females by age band is shown in the chat above
right.
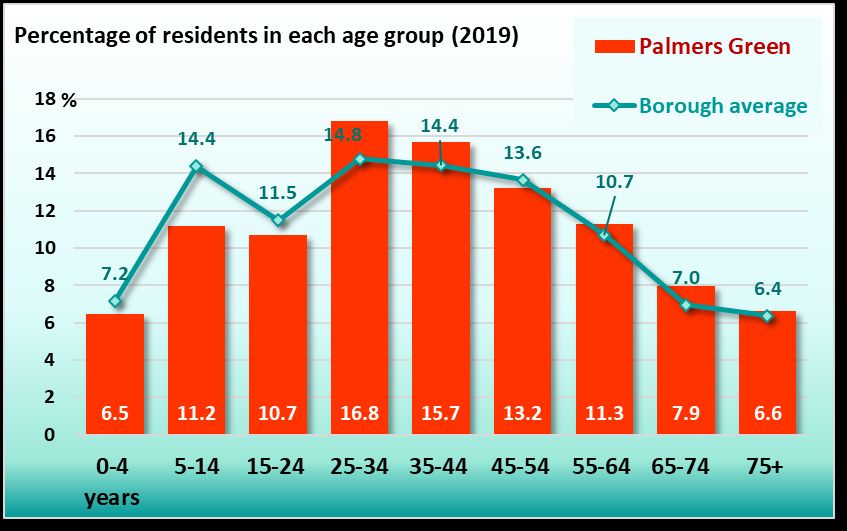
Age Profile
The ward
contains a larger
proportion of
people in the
25-34 and 35-44
year age groups
than the
borough
average.
For more detail,
see appendix.
Produced by the Insight Team 3
If you have any queries relating to this document please email KIH@enfield.gov.uk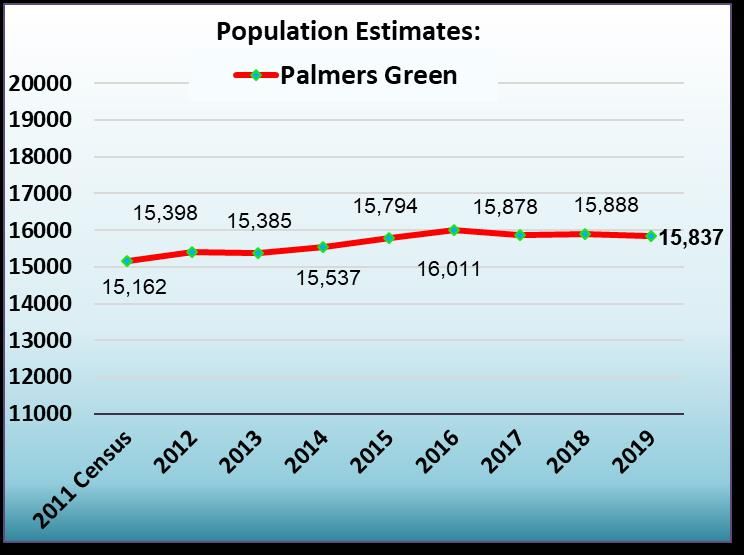
Ethnicity

The ward contains relatively large numbers in the Greek, Greek Cypriot, White Other, Indian and
Pakistani groups.

As at the 2011 Census, the percentages of Black, Asian and Minority Ethnic Group (BAME) was
35.4% and Non-UK Born residents was 41.4%. The percentage of households without English as
a first language was 18.1%

Enfield Council’s own 2019 estimates give the ward’s BAME Group to be 32.2% of the total
population.

Ethnicity estimates are produced in-house, using data from the 2001 and 2011 Censuses and the
School Census conducted by the local education authority (LEA). The School Census results
indicate the changing nature of the population and Enfield pupils recorded themselves under 95
different ethnic codes. Ward ethnicity populations have been consolidated and estimated for the 22
groups that make up the Council’s standard ethnic group classification (see table below) 1.

                                               Palmers Green                     Borough
        Ethnicity (2019)
                                           Estimated                        Estimated
                                                                 %                      %
                                           No.                              No.

    White British                                    5,286           32.8      128463      38.3
    White Irish                                        463            2.9        6427       1.9
    Greek                                              387            2.4        3862       1.2
    Greek Cypriot                                    1,508            9.3       15612       4.7
    Turkish                                          1,013            6.3       25413       7.6
    Turkish Cypriot                                    437            2.7        6079       1.8
    Kurdish                                            111            0.7        4152       1.2
    White Other                                      1,732           10.7       22501       6.7
    White & Black Caribbean                            156            1.0        4248       1.3
    White and Asian                                    226            1.4        3627       1.1
    White and Black African                            107            0.7        2303       0.7
    Other mixed                                        378            2.3        6562       2.0
    Indian                                             914            5.7       11066       3.3
    Pakistani                                          249            1.5        2407       0.7
    Bangladeshi                                        172            1.1        5971       1.8
    Chinese                                             84            0.5        2441       0.7
    Other Asian                                        574            3.6       11954       3.6
    Somali                                             253            1.6        9160       2.7
    Other Black African                                567            3.5       25032       7.5
    Black Caribbean                                    649            4.0       17561       5.2
    Other Black                                        278            1.7        8285       2.5
    Other Ethnic Group                                 589            3.7       12300       3.7
Source: Enfield Council Insight Team

1
Please note totals will not sum with ONS population estimates.

Produced by the Insight Team                                                                      4
If you have any queries relating to this document please email KIH@enfield.gov.uk
Language

The main languages of residents* given by 2011 Census estimates are:

   English                                      10,578        73%       The ward had the highest
   Turkish                                         795         5%       number of Greek and Bulgarian
   Greek                                           605         4%       speakers in Enfield.
   Polish                                          376         3%
   Gujarati                                        239         2%
* aged 3 and over

Religion

Regarding Religion, the best guide is the 2011 Census. This showed the religious composition of
the ward as:

  Religion                       No.       % share       Borough average %
  Christian                     7755         51.1                        53.6
  Buddhist                        80          0.5                         0.6
  Hindu                          715          4.7                         3.5
  Jewish                         169          1.1                         1.4
  Muslim                        2545         16.8                        16.7
  Sikh                            65          0.4                         0.3
  Other/none/not stated         3833         25.3                        23.8

Produced by the Insight Team                                                                            5
If you have any queries relating to this document please email KIH@enfield.gov.uk
Socio-economic factors

Socio-economic classification
The 2011 Census results showed that Palmers Green had an above average proportion of
people in managerial groups with about 11% more people than would be expected from the
Borough average.

                                                                         The 2011 Census results showed
                                                                         that Palmers Green had an
                                                                         above average proportion of
                                                                         people in managerial groups, with
                                                                         about 11% more people than
                                                                         would be expected from the
                                                                         Borough average.

Low income households
Palmers Green had the 9th highest average (median) household income of the 21 wards in
Enfield, as estimated by CACI in 2020. Average household income in the ward is above the
median level for the borough as a whole and higher than the London average.

The proportion of households with an income of less than £15,000 was put at 9.6% compared
to a Borough average of 15.6%. This was the 8th lowest proportion of the 21 wards.

Benefit Claims

At July 2020:
• The claimant count2 in Palmers Green was 860, representing 8.1% of the local working-age
    population.
• 21% of households in the ward (1,312) were claiming Universal Credit – this includes
    working households.

Economically active people
The estimated proportion of people in work or looking for work (the economically active) was
higher than the borough average in 2011. For number and rates see appendix.

2
  The ‘narrow’ measure of unemployment: the number of people receiving either Job Seekers’ Allowance, or unemployed
claimants of Universal Credit who are required to seek work.

Produced by the Insight Team                                                                                          6
If you have any queries relating to this document please email KIH@enfield.gov.uk
Deprivation score
The Indices of Deprivation 2019 – produced for the Ministry of Housing, Communities and
Local Government– can be used to calculate the likely deprivation ranking of the ward. Analysis
carried out by the Local Government Association indicates that, within Enfield, Palmers Green
is the 13th most deprived (or ninth least deprived) of the 21 wards in the Borough. The same
analysis estimates that it is among the most deprived 40% of wards in England.
The map
illustrates
deprivation
levels for wards
in Enfield, when
compared with
the rest of the
7,180 wards in
England for
which data
were available.
Fuel Poverty
Ward-level analysis of government statistics3 reveal that, as at 2018, 13.2% of households in
the ward were in fuel poverty. This proportion was higher than both the borough and England
averages.
Crime
Appendix A has two crime related indicators by which the ward is compared to the Borough
average:-
• Crime rate
• Anti-social behaviour rate
The latest crime rates and trends can be obtained from the Metropolitan Police crime mapping
website.
3
Published by Department for Business, Energy & Industrial Strategy
Produced by the Insight Team 7
If you have any queries relating to this document please email KIH@enfield.gov.ukHealth
The most recent estimates of the life expectancies4 for men and women in the ward
are both higher than the respective Enfield and England averages.
Considering the age structure of the ward the number of deaths is lower than would be
expected, although mortality from circulatory diseases among the over 75s is higher than
average.
Life expectancies and Standardised Mortality Ratios by cause of death are shown in the charts
below.
General Health
In the 2011 Census the
population were asked
a question about their
general health.
The graph (right)
shows the response.
For the numbers of
people in the above
categories see
appendix.
4
Public Health England: Life Expectancy at birth 2013-2017
Produced by the Insight Team 8
If you have any queries relating to this document please email KIH@enfield.gov.ukObesity The chart below shows the percentage of Reception and Year 6 children and adults in the ward who are overweight or obese, compared with the borough and national averages. The latest health information about the ward can be obtained from the Local Health website by choosing Find My Area and entering the ward name. Within the ward there are two GP surgeries: o Connaught Surgery – 144 Hedge Lane, N13 5ST o North London Health Centre – Rochdale Surgery, Broomfield Avenue, N13 4JJ and four dental surgeries (including one orthodontic surgery): o Angle House Orthodontics, 38 Harington Terrace, Great Cambridge Road, N18 1JX o The Grove Dental Care – 45 The Grove, N13 5LD o Mr L Georghiou – 1E Hazelwood Lane, N13 5EU o Green Lanes Dental Practice – 456 Green Lanes, N13 5XD Produced by the Insight Team 9 If you have any queries relating to this document please email KIH@enfield.gov.uk
Housing

The 2011 (Census) profile of the households in the ward by housing tenure (sector) is:

    Tenure                                        No. (% share)                     Borough average %
    Owner occupied                                3681 (63.6%)                            58.8%
    Private rented                                1589 (27.4%)                            23.6%
    Council                                        281 (4.9%)                             11.4%
    Registered social landlord                     240 (4.1%)                              6.2%

                                                                                    The 2011 Census data
                                                                                    provides a view of the
                                                                                    accommodation type
                                                                                    by ward compared with
                                                                                    the rest of the borough.

                                                                                    In Palmers Green ward
                                                                                    there are higher
                                                                                    percentages of
                                                                                    terraced houses and
                                                                                    flats in house
                                                                                    conversions, compared
                                                                                    with the Enfield
                                                                                    average.

                                                                                    For the numbers of
                                                                                    dwellings in the above
                                                                                    categories see
                                                                                    appendix.

In the year to December 2019, the median house price for Palmers Green ward was £500,000,
19.8% higher than the Borough median of £417,500, and having risen by 6% since the previous
year.

Produced by the Insight Team                                                                                   10
If you have any queries relating to this document please email KIH@enfield.gov.uk
Education There are 2 primary schools (one infant school and one junior school), and 1 secondary school in the ward: Hazelwood Junior School – http://www.hazelwoodschools.org.uk/ Hazelwood Infant School – http://www.hazelwoodschools.org.uk/ St Anne’s Catholic High School (Upper School) - www.st-annes.enfield.sch.uk School performance The Department for Education publishes school performance data on their searchable webpages. Taken from the 2011 Census data the graph below shows the percentage of qualifications by population in the ward. Qualifications: The term ‘no qualifications’ describes people without any academic, vocational or professional qualifications. The term ‘lower level’ qualifications is used to describe qualifications equivalent to levels 1 to 3 of the National Key Learning Targets (i.e. GSCE’s O levels, A levels, NVQ levels 1-3). The term ’Higher level’ refers to qualifications of levels 4 and above (i.e. first degrees, higher degrees, NVQ levels 4 and 5, HND, HNC and certain professional qualifications). Produced by the Insight Team 11 If you have any queries relating to this document please email KIH@enfield.gov.uk
Culture and Leisure

There is one static library in the ward:

Palmers Green Library, Broomfield Lane, N13 4EY
Tel No 020 8379 2837

The ward has no leisure centres within its boundaries, with the nearest facilities located in the
neighbouring ward of Bush Hill Park:

The Aspire Sports and Fitness Centre is situated in the Edmonton County Lower School, Little
Bury Street, off Church Street, N9.
Tel No: 020 8245 5191

The ward has two parks and open spaces;

   o Hazelwood Sports Ground
   o Tatem Park

There are also the following sports and social clubs in the ward:

Triangle Fitness, Green Lanes
Tel No: 020 8882 9102

Mayfield Athletic Football Club, Kenmare Gardens
Website: http://www.mayfieldsportsclub.com/football/

New Salamis Football Club, Green Lanes
Tel No: 020 8447 9450

Palmers Green Billiards, Green Lanes
Tel No: 020 8886 0721

Broomfield Badminton Club, Crawford Gardens
Tel No: 020 8882 5551

There are allotments at Farndale Avenue Allotments, N13 5AE, and Barrowell Green
Allotments on Farndale Avenue, N13 5AJ. For further information contact Enfield Council on
020 8379 1000 or visit the website.

There is 1 place of worship within the boundaries of the ward:

   o Palmers Green Baptist Church                      Tel No 020 8886 1424

Produced by the Insight Team                                                                    12
If you have any queries relating to this document please email KIH@enfield.gov.uk
Voluntary and Community Sector

Some locally based community organisations are given below:

   •   Ruth Winston Centre, Green Lanes, N13 5UE - A registered charity whose mission is
       to promote independence, well-being and activities for the over 50s in Enfield.
       Further information: http://www.ruthwinstoncentre.com/

Additional Sources of information

For local information visit the Enfield Council website homepage: http://www.enfield.gov.uk/.
Creating an Enfield Connected account will enable you to find out about local events and
services.

A collation of various data including latest best estimates is at Appendix A.

For statistics, search on the London Datastore or select profiles or data on NOMIS.

Produced by the Insight Team                                                                    13
If you have any queries relating to this document please email KIH@enfield.gov.uk
Produced by the Insight Team 14 If you have any queries relating to this document please email KIH@enfield.gov.uk
Appendix A – Data tables
                                                                                           Borough
                                                                                                       relative %
                                                                      No        %          average no.
                                                                                                       diff.
                                                                                           /%
TOTAL:-
POPULATION – 2019                                                    15837                     15895            0
HOUSEHOLDS – 2011                                                     5791                      5710            1
 Owner Occupied                                                       3681      63.6            58.8            8
 Council                                                               281       4.9            11.4          -57
 Registered Social Landlord                                            240       4.1             6.2          -33
 Private Renting                                                      1589      27.4            23.6           16
AGE STRUCTURE – 2019
 0-4                                                                  1027       6.5              7.2          -9
 5-14                                                                 1771      11.2             14.4         -22
 15-24                                                                1693      10.7             11.5          -7
 25-44                                                                5152      32.5             29.2          11
 45-64                                                                3885      24.5             24.4           1
 65-74                                                                1259       7.9              7.0          14
 75+                                                                  1050       6.6              6.4           4
ETHNIC MIX – 2019 (Enfield Council Estimates)
White British                                                          5286         32.8          38.3        -14
White Irish                                                             463          2.9           1.9         50
Greek                                                                   387          2.4           1.2        108
Greek Cypriot                                                          1508          9.3           4.7        101
Turkish                                                                1013          6.3           7.6        -17
Turkish Cypriot                                                         437          2.7           1.8         49
Kurdish                                                                 111          0.7           1.2        -45
White Other                                                            1732         10.7           6.7         60
White & Black Caribbean                                                 156          1.0           1.3        -24
White and Asian                                                         226          1.4           1.1         30
White and Black African                                                 107          0.7           0.7         -4
Other mixed                                                             378          2.3           2.0         20
Indian                                                                  914          5.7           3.3         72
Pakistani                                                               249          1.5           0.7        115
Bangladeshi                                                             172          1.1           1.8        -40
Chinese                                                                  84          0.5           0.7        -28
Other Asian                                                             574          3.6           3.6          0
Somali                                                                  253          1.6           2.7        -43
Black African                                                           567          3.5           7.5        -53
Black Caribbean                                                         649          4.0           5.2        -23
Other Black                                                             278          1.7           2.5        -30
Other Ethnic Group                                                      589          3.7           3.7          0
RELIGION – 2011
Christian                                                             7755      51.1             53.6          -5
Buddhist                                                                80       0.5              0.6         -10
Hindu                                                                  715       4.7              3.5          35
Jewish                                                                 169       1.1              1.4         -21
Muslim                                                                2545      16.8             16.7           1
Sikh                                                                    65       0.4              0.3          24
Other / not stated / none                                             3833      25.3             23.9           6

Produced by the Insight Team                                                                                    15
If you have any queries relating to this document please email KIH@enfield.gov.uk
Appendix A – Data tables
Borough
relative %
No % average no.
diff.
/%
ECONOMIC ACTIVITY in the 16-64 age group
All economically active, 2011 7916 76.9 73.4 5
Unemployed — Claimant Count July 2020 860 8.1 8.9 -9
INCOME - 2020
Households with less than £15,000 (gross) a year 595 9.6 15.6 -38
Households claiming Universal Credit (May 2020) 1312 21.2 23.7 -11
QUALIFICATIONS – 2011
No qualifications 2532 20.6 23.0 -11
Level 1 only 1340 10.9 12.9 -16
Level 2 1465 11.9 13.8 -14
Level 3 1317 10.7 10.5 2
Level 4 and above 4124 33.5 28.7 17
HOUSING TYPE – 2011
Detached 180 3.1 7.0 -56
Semi-detached 1156 19.6 23.5 -17
Terraced 2444 41.4 31.1 33
Flat - purpose built 923 15.6 30.1 -48
Flat - in a shared house 1039 17.6 6.8 161
Other 156 2.6 1.5 72
CARS IN HOUSEHOLDS – 2011 - nos. of households with:
0 cars 1757 30.3 32.5 -7
1 car 2596 44.8 43.3 4
2+ cars 1438 24.8 24.3 2
HOUSEHOLD TYPES – 2011
One person 1553 26.8 27.8 -4
All occupants aged 65 plus 345 6.0 5.5 9
Married couple or civil partnership, no children 502 8.7 7.9 9
Married couple or civil partnership, with dependent children 1022 17.6 17.4 1
Married couple or civil partnership, all children non dependent 466 8.0 6.8 18
Cohabiting couple, no children 246 4.2 3.4 23
Cohabiting couple, with dependent children 138 2.4 3.0 -20
Cohabiting couple, all children non dependent 18 0.3 0.4 -27
Lone parent 677 11.7 16.7 -30
Other 824 14.2 11.0 29
PERSONS WITH LONG TERM HEALTH PROBLEM / DISABILITY– 2011
Limiting a lot 1118 7.4 7.3 2
Limiting a little 1242 8.2 8.1 1
GENERAL HEALTH – 2011
Very good 7148 47.1 46.8 1
Good 5254 34.7 35.0 -1
Fair 1929 12.7 12.7 0
Bad 647 4.3 4.1 4
Very bad 184 1.2 1.3 -9
LIFE EXPECTANCY (years) - 2013-2017:
Males 80.3 80.3 0
Females 85.8 84.5 2
Standardised Mortality Ratio - 2013-2017 83.6 91.5 -9
COMMUNITY SAFETY - 2019
Crime rate (per 1,000 residents) 91.7 89.6 2
Anti-social behaviour rate 31.3 28.1 11
Produced by the Insight Team 16
If you have any queries relating to this document please email KIH@enfield.gov.ukSources and related notes Population – ONS mid-year population estimate 2019 Households – 2011 Census; © Crown Copyright Age structure – ONS mid-year population estimate 2019 Religion – 2011 Census; © Crown Copyright Ethnic mix – Council estimates for 2019; note there are difficulties in estimating ethnic group sizes at ward level and the figures given here must be treated with caution and used as a guide to the possible mix in the ward Economic Activity – all economically active 16-64 year olds = working plus unemployed – 2011 Census; © Crown Copyright, the activity rate (%) is the % of the population aged 16-64 Unemployed — the official DWP ‘claimant count’, July 2020 Income – Low income households – CACI Paycheck; 2020; © CACI Qualifications – 2011 Census; © Crown Copyright; note that this table excludes apprenticeships and ‘other’ qualifications Housing type – 2011 Census; © Crown Copyright Cars – 2011 Census; © Crown Copyright Household types – 2011 Census; © Crown Copyright Persons with a long-term health problem/disability – 2011 Census; © Crown Copyright General health – 2011 Census; © Crown Copyright Life expectancy – Public Health England, based on 2013-2017 data Crime rate – uses crime counts from the Metropolitan Police for 2019 The relative % diff[erence] is the area % divided by the Borough % (expressed as a % above or below the Borough average) We welcome your feedback on this Ward Profile. Please send any comments or suggestions to: KIH@enfield.gov.uk Produced by the Insight Team 17 If you have any queries relating to this document please email KIH@enfield.gov.uk
You can also read