Wartime Violence, Collective Grievances and Post-Conflict Protests - Evidence from Uganda's LRA Insurgency
←
→
Page content transcription
If your browser does not render page correctly, please read the page content below
Roman Krtsch

            Wartime Violence, Collective
                        Grievances and
                  Post-Conflict Protests
                       Evidence from Uganda’s LRA Insurgency

INEF REPORT 115/2021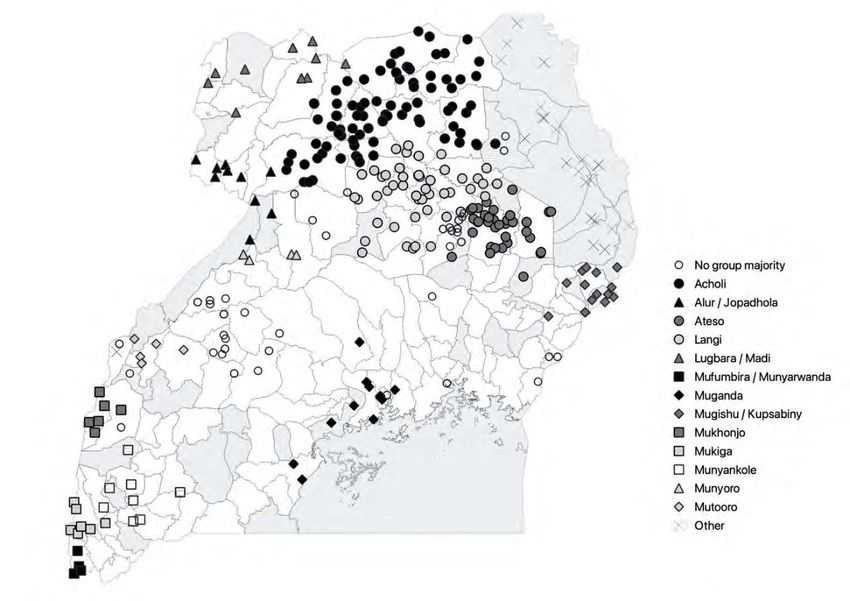
NOTE ON THE AUTHORS:

Roman Krtsch, M.A., Osnabrück University, School of Cultural Studies and Social Sciences,
E-Mail: roman.krtsch@uni-osnabrueck.de

BIBLIOGRAPHICAL NOTE:
   Krtsch, Roman 2021: Wartime Violence, Collective Grievances and Post-Conflict Protests.
Evidence from Uganda’s LRA Insurgency. INEF Report 115/2021, Duisburg: Institute for
Development and Peace.

                                             Imprint

                Editor:                                 © Institute for Development and Peace
Institute for Development and Peace (INEF)                   Lotharstr. 53        D - 47057 Duisburg
      University of Duisburg-Essen                     Phone +49 (203) 379 4420     Fax +49 (203) 379 4425
                                                                  E-Mail: inef-sek@uni-due.de
        Logo design: Carola Vogel                            Homepage: https://www.uni-due.de/inef
    Cover design: Doppelpack Ohmen
                                                                      ISSN 0941-4967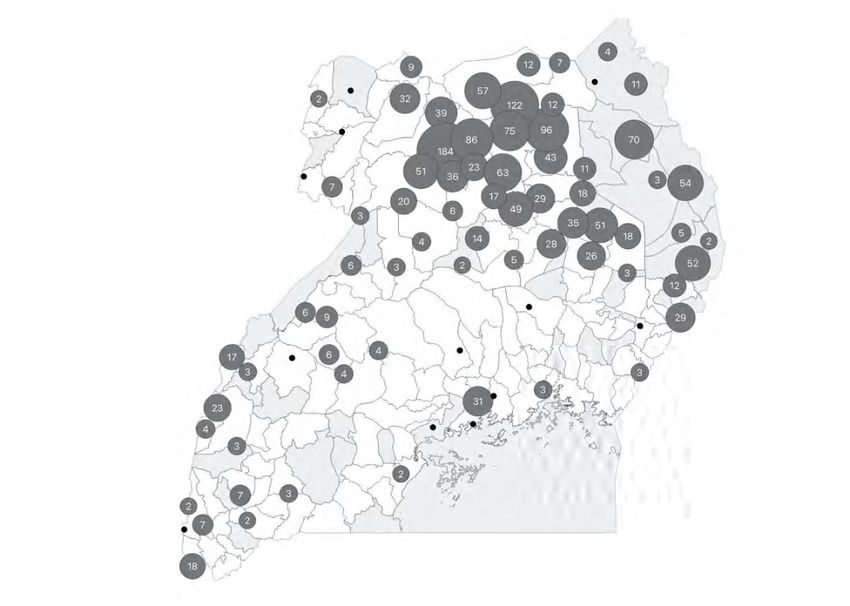
Roman Krtsch

             Wartime Violence, Collective Grievances
                         and Post-Conflict Protests

              Evidence from Uganda’s LRA Insurgency

                          INEF Report 115/2021

University of Duisburg-Essen           Institute for Development and Peace
Universität Duisburg-Essen             Institut für Entwicklung und Frieden (INEF)
Krtsch, Roman 2021: Wartime Violence, Collective Grievances and Post-Conflict Protests.
Evidence from Uganda’s LRA Insurgency. INEF Report 115/2021, Duisburg: Institute for
Development and Peace.

ABSTRACT
The immediate aftermath of civil wars is a period prone to heightened contention: Political
decisions about the distribution of aid or power, for example, can deepen social fault lines and in
some instances even result in violent unrest. Yet despite its relevance, our knowledge on the
drivers for individual participation in post-conflict contentious activism remains limited. Previous
research has found particularly wartime experiences to affect political and social behaviour of
individuals in the post-conflict period. Based on these findings, I argue that exposure to civil war
violence increases the likelihood for individuals to participate in post-war protests. Moreover, I
conjecture that this effect can be explained with the reinforcement of group-based grievances.
Using survey data from the Afrobarometer collected shortly after the end of the Ugandan civil war
in 2008, I find support for the argument: Results from linear probability models show a consistent
and robust relationship between county-level war violence and the likelihood to participate in
protests. An additional analysis with a novel measure of group-level exposure and a causal
mediation analysis furthermore corroborate the assumed mechanism.

ZUSAMMENFASSUNG
Unmittelbar nach dem Ende der Kampfhandlungen beginnt für Post-Bürgerkriegsgesellschaften
häufig eine Phase, die anfällig für Auseinandersetzungen ist: Politische Entscheidungen über die
Machtaufteilung können beispielsweise soziale Gräben vertiefen und in einigen Fällen sogar in
gewalttätige Unruhen münden. Trotz dieser Relevanz ist unser Wissen über die wesentlichen
Antriebe individueller Beteiligung an Protesten in Nachkriegsgesellschaften nach wie vor
begrenzt. Die bisherige Forschung hat insbesondere die Bedeutung von Gewalterfahrungen für
das politische und soziale Verhalten in der Nachkriegsperiode hervorgehoben. Aufbauend auf
diesen Erkenntnissen ist das Argument des vorliegenden Aufsatzes, dass lokale Intensität von
Bürgerkriegsgewalt die Wahrscheinlichkeit individueller Protestteilnahme in der Nachkriegszeit
erhöht. Ich argumentiere ferner, dass dieser Zusammenhang durch die Verstärkung
gruppenbasierter grievances im Zuge von Gewalterfahrungen erklärt werden kann. Mithilfe von
Umfragedaten des Afrobarometers, welche kurz nach dem Ende des ugandischen Bürgerkriegs
2008 erhoben wurden, kann mein Argument empirisch gestützt werden: Die Ergebnisse Linearer
Wahrscheinlichkeitsmodelle zeigen einen konsistenten und robusten Zusammenhang zwischen
der Intensität von Bürgerkriegsgewalt auf der County-Ebene und der Wahrscheinlichkeit für die
Teilnahme an Protesten. In einer zusätzlichen Analyse untersuche ich den Mechanismus mithilfe
einer neuen Messung für gruppenspezifische Kriegserfahrungen und nutze eine
Mediationsanalyse zur weiteren Unterstützung des Mechanismus.
Content

1.    Introduction .......................................................................................................................5

2.    Previous research on wartime exposure and collective action .....................................6

3.    Theoretical argument: Exposure to wartime violence, collective grievances and
      protest mobilization .........................................................................................................7

4.    The LRA insurgency in northern Uganda ........................................................................9

5.    Data and operationalization .......................................................................................... 11
      5.1       Dependent variable, mediators and primary controls ............................................... 11
      5.2       Explanatory and interaction variable ........................................................................... 14

6.    Empirical results ............................................................................................................ 16
      6.1       Robustness checks ....................................................................................................... 18

7.    Exploring the causal mechanism .................................................................................. 19
      7.1       Causal mediation analysis ............................................................................................ 20

8.    Conclusion...................................................................................................................... 22

9.    References ..................................................................................................................... 23

10.   Appendix ........................................................................................................................ 28
Wartime Violence, Collective Grievances and Post-Conflict Protests
1. Introduction
For war-torn countries, the transition to the post-conflict phase often entails new challenges to
domestic stability. Especially the early period after hostilities have ceased – when state capacity
tends to be low and different possible paths of political and economic development are still open
– can be prone to increased contention. Political violence and protests erupting in the course of
post-conflict elections (Salehyan/Linebarger 2015), in the context of broader peacebuilding and
development activities (Lee/Park 2020; Lai 2016), or over the distribution of political power
(Krtsch/Vüllers 2019) are far from uncommon and may in some instances even jeopardize the
further trajectory of the peace process as a whole – up to the point of conflict relapse.
Yet despite its apparent relevance for post-conflict stability, protests in such settings have
remained a largely understudied subject of investigation. In particular, we still know little about the
conditions and mechanisms that explain individual participation in post-conflict protests. On the
one hand, empirical studies have identified wartime experiences as crucial determinants for
individuals’ attitudes and behaviour in the aftermath of conflict. At the same time, however,
findings remain unclear as to whether and how these legacies translate into collective action
(Bauer et al. 2016). This paper contributes to the discussion by first shedding light on the factors
that explain individuals’ propensity to engage in protests during post-conflict periods, and second
by testing the mechanism through which the conjectured relationship is assumed to operate.
I argue that experiences of wartime violence reinforce group-based perceptions of threat,
vulnerability and eventually grievances. These shared perceptions of grievances can – in turn –
decrease barriers to collective action and result in an increased propensity to join protests in the
immediate aftermath of war. Taking the case of the Lord’s Resistance Army (LRA) insurgency in
Uganda, I draw from survey data collected shortly after the end of violence (Afrobarometer 2008)
and geo-referenced conflict data (Raleigh et al. 2010) to test the argument empirically. Results
from linear probability models show that the local intensity of violence correlates significantly with
individuals’ reported protest participation in 2008.
In order to examine the mechanism, I secondly assess the conditional effect of group-level
exposure to violence on the found relationship. I therefore match individual violent events with
precise geo-located information about local ethnic settlement patterns (Müller-Crepon/Hunziker
2018). The results suggest that conflict intensity increases protest propensity if the respondent’s
own group has been highly affected by the violence. A causal mediation analysis finally shows
that specifically group-based grievances are a plausible explanation for the relationship between
conflict intensity and protest.
The paper contributes to current debates in two major ways: First, by showing that exposure
to conflict-related violence increases protest activities after hostilities have ended, the paper adds
further evidence to a more cautious interpretation of post-conflict social capital formation. Protests
certainly constitute an important means for marginalized communities to articulate their interests
in the peace process. At the same time, however, the mechanism of collective grievance formation
also suggests that post-conflict protests may be a symptom of increased alienation with the state.
These implications corroborate earlier works that see eroding trust in political institutions (De
Juan/Pierskalla 2016) and a stronger retreat to autonomous local self-governance (Grosjean
2014) as an outcome of wartime experiences.
Second, it expounds on the mechanism through which wartime legacies transition into post-
conflict collective action. Previous studies have demonstrated that immediate or contextual
conflict exposure – e.g. approximated by the local intensity of violence – can have ramifications
for post-conflict attitudes and behaviour (e.g. Freitag et al. 2017; Bellows/Miguel 2009). While
principally lending support to these findings, the results presented here shed light on the question
how this effect may come about.
5Roman Krtsch 2. Previous research on wartime exposure and collective action Civil wars often place heavy burdens on societies even after hostilities have ceased. Particularly the early post-conflict period can be critical, with pivotal moments such as elections (Flores/Nooruddin 2012; Salehyan/Linebarger 2015), the implementation of power-sharing provisions (Krtsch/Vüllers 2019) or aid allocation decisions (De Juan 2020) being prone to social unrest. Figure 1 provides a cursory overview about the phenomenon’s extent and plots the change of average protest intensity for African countries with at least three years of armed conflict followed by at least three years of peace since 1997 (defined according to the Uppsala Conflict Data Program (UCDP) definition of at least 25 battle-related deaths per year). In almost all cases, nonviolent and violent protests increased markedly after the end of the conflict. For the two exceptions, Rwanda (2002) and Ivory Coast (2004), the decrease in protests results from peaks of social unrest in the respective conflict’s final year. It is also noteworthy that this selection does not include countries that experienced short-lived peace periods precisely because of increased social unrest in the immediate aftermath of conflict termination (as in the case of Libya, for instance). Figure 1: Change in the average number of protests and riots from three years prior to three years after the end of armed conflict. Data based on ACLED (Raleigh et al. 2010). Given the relevance of protests in post-conflict settings, most studies have sought to address the phenomenon on an aggregate level, relying either on cross-country analyses or comparisons across subnational regions or groups (Davenport et al. 2019). However, we still know little about the central drivers for individual participation in post-conflict protests. In fact, despite the negative consequences on the aggregate level, some microlevel investigations show that the impact of wartime experiences on individual attitudes and behaviour can be quite different. Based on survey evidence from post-conflict contexts, a series of studies has found wartime experiences to 6
Wartime Violence, Collective Grievances and Post-Conflict Protests

significantly correlate with higher individual levels of interpersonal trust and pro-social behaviour
(Koos 2018; Bellows/Miguel 2009; Blattman 2009; De Luca/Verpoorten 2015a; Gilligan et al. 2014;
Voors/Bulte 2014; Voors et al. 2012). Some investigations have even found these unintended
consequences to enhance certain forms of political and community participation, such as voting
in elections (Bellows/Miguel 2009), joining political groups (Bellows/Miguel 2009) participating in
local assemblies (Bellows/Miguel 2009; De Luca/Verpoorten 2015b) or engaging in community-
based associations (Blattman 2009; Koos 2018; Grosjean 2014).
   Other investigations, by contrast, have either found no or even a negative relationship between
experiences of violence and pro-social behaviour (Kijewski/Freitag 2018; Hager et al. 2019;
Muller/Vothknecht 2011; Colletta/Cullen 2000). Some authors point to the differential impact of
war on social ties: While mainly affecting solidarity, trust and identification with members of the
same ethnic, religious or community group, exposure to wartime violence could thereby be
detrimental for attitudes towards out-group members (Bauer et al. 2014; Rohner et al. 2013;
Balcells 2012; Cassar et al. 2013).
    It is particularly this differential impact – the reinforcement of in-group solidarity and
identification coupled with mistrust against out-group members – that can in turn have profound
implications on individual behaviour after the end of the conflict. For Bosnia-Herzegovina, Hadzic
et al. (2017) show that vote shares for ethnic parties are significantly higher in war-affected
communities. The authors find suggestive evidence that these voting patterns are mediated via
increased trust towards co-ethnics and decreased trust towards members of other ethnic groups.
In a similar vein, Costalli and Ruggeri (2018) and Beber et al. (2014) find wartime experiences to
affect individual political preferences through the reinforcement of ideological or ethnic
identification.
    Despite this salience of this mechanism, however, few studies have systematically analysed
how the reinforcement of group identities in the course of conflict may affect specifically protests
in the immediate aftermath of war. While Freitag et al. (2017) identify a positive and significant
relationship between wartime victimization and protest participation in post-war Kosovo, their
study rather focuses on longer term consequences (eleven years after conflict termination) and
does not specifically test the conjectured mechanism.
    To sum up, the literature on the effect of wartime exposure on collective action has yielded
mixed results: While most studies agree that the development of social ties is instrumental in
explaining the relationship, there is no consensus about which type of social ties are reinforced
through wartime experiences – and by extension, which type of behaviour we expect to prevail as
a result. Taking up studies that suggest a differential effect on individuals’ in- and out-group
attitudes, I will next outline a theoretical argument that explains how wartime exposure leads to
an increased likelihood of protest participation through a mechanism of group-based grievance
formation.

3. Theoretical argument: Exposure to wartime violence,
   collective grievances and protest mobilization
Starting from the premise that exposure to violence increases social ties and identification with
in-group members – defined in terms of either ethnicity, religion, or location –, we may expect a
higher individual protest likelihood to ensue. Group identities provide a network of trust that can
serve as the very foundation for collective action (Passy 2003). They enable collective action by
facilitating the dissemination of ideas and information, connecting like-minded individuals, and
providing channels through which individuals can be mobilized (Edwards/McCarthy 2004;
Oberschall 1994; Snow et al. 1980). Yet the mere reinforcement of group identities alone may not
suffice to explain the link between exposure of wartime violence and post-conflict protest
participation. I argue that a central driver for the latter lies in a) the reinforcement of group-related

                                                                                                       7
Roman Krtsch
grievances through experiences of violence and b) the activation of these collective grievances in
periods of increased contention – which is often the case in the immediate post-conflict period.
The argument builds on the assumption that motivational triggers are essential in order to
activate existing networks for collective action. This link is perhaps most prominently associated
with grievances-based explanations, which argue that perceptions of relative deprivation create
individual frustrations and eventually lead to mobilization (Runciman 1966; Gurr 1970). Relative
deprivation is thereby understood as the widening gap between value expectations and the
capabilities to achieve them – for instance in the course of losses incurred through sudden shocks.
It is easy to see how specifically wartime experiences may lead to perceptions of relative
deprivation. On the one hand, wars are often accompanied by extensive direct violence against
civilians (Eck/Hultman 2007). On the other hand, clashes between the government and rebel
forces frequently entail substantial impacts on the civilian population in the form of destruction of
livelihoods or even loss of life through indirect killings. When people either witness or personally
suffer from violence during civil wars, it can reinforce perceptions of threat and vulnerability that
eventually lead to grievances.
These experiences are particularly likely to translate into collective action if they reflect a
shared perception of deprivation among members of a social group instead of isolated individual
experiences. Group identities are instrumental in shaping individuals’ perspectives of common
injustice, standpoints on specific political issues and the entailing imperatives of action (Passy
2003). In the context of civil war violence, individual experiences can become embedded into a
common narrative of group deprivation; a common understanding about the wartime exposure of
the entire social group with which the individual identifies itself (Østby 2013). Against the backdrop
that civilian targeting in conflicts, but also the location of battles, are indeed not random but often
very explicitly based on group membership, it is plausible to expect that individual experiences
easily translate into group-based interpretations of victimization in war contexts (Gurr 1993).
Perceptions of increased deprivation in turn lead to collective action by enhancing frustration
– most commonly identified with feelings of injustice. As Pettigrew states, people “must not only
perceive difference, but they must also regard these differences as unfair and resent them” (2002,
368). Survey-based empirical studies have specifically identified perceptions of group-based
injustices to be a strong predictor for participation in and support for contentious activism,
including political violence and protests (Bhavnani/Backer 2007; Kirwin/Cho 2009; Miodownik/Nir
2016; Detges 2017; Dyrstad/Hillesund 2020; Alcorta et al. 2020). Group identities socialize
individuals into a specific, common interpretation of social reality, which includes an evaluation
about the respective group’s position within the broader society (Freeman 1973; McAdam 1982;
Passy 2003). As a consequence, collectively shared perceptions of wartime victimization are
likewise prone to correlate with feelings of being disadvantaged or even treated unfairly in
comparison to other groups. These feelings can, in turn, develop into injustice frames that can
constitute a powerful narrative to organize collection action (Benford/Snow 2000). These frames
typically include a particular attribution of blame – often targeted at the government. For the
context of wartime violence, this may apply regardless of the actual perpetrators of violence. Even
if non-state groups are the main actors responsible, individuals may nonetheless hold the
government accountable for failing to provide security (De Juan/Pierskalla 2016; Gates/Justesen
2020).
Central to my argument is that these grievances can – once developed – translate to the post-
conflict period. Siroky et al. (2020) show that relative deprivation does not necessarily correspond
to tangible inequalities (e.g. economic differences). Instead, grievances based on perceptions of
relative deprivation are essentially psychological phenomena reflecting the feeling of being
disadvantaged – which can include real, subjective but also feared inequalities and injustices.
They emphasize “group frustration owing to a gap between what the group has relative to what it
feels it deserves – not necessarily to what others have” (Siroky et al. 2020, 696). Consequently,
perceptions of threat and vulnerability developed through wartime experiences are likely to outlive
the war itself as a motivational foundation for mobilization that can constitute a fertile ground for
protests during subsequent contentious episodes.
8Wartime Violence, Collective Grievances and Post-Conflict Protests
The immediate post-conflict period is a particularly conducive phase for these simmering
grievances to erupt. It entails moments and decisions that critically determine the country’s further
trajectory and that are likely to have differential impacts on individual social groups. Elections
(Flores/Nooruddin 2012; Salehyan/Linebarger 2015), power-sharing practices (Krtsch/Vüllers
2019) and decisions on the allocation of aid (De Juan 2020), for example, bear the potential to
reinforce inter-group power imbalances and are thus likely to be highly contested. In these
situations, increased group-related grievances resulting from experiences of wartime violence can
lead individuals to participate in protests. Based on these considerations, I develop the following
hypothesis: Exposure to wartime violence increases the likelihood of protest participation in the
post-war period.
4. The LRA insurgency in northern Uganda
I test the argument for Uganda’s immediate post-conflict period following the civil war between
the LRA and the Government of Uganda. The conflict’s beginning dates back to Yoweri
Museveni’s takeover of power in 1986, when remnants of the former Acholi-dominated regime
rebelled against the new central government. In the early 1990s, the LRA prevailed as the
predominant militant organization in Uganda’s north with support from the Sudanese government
(Van Acker 2004).
Initially, the LRA and its predecessors drew primarily from support by the local Acholi
population – an ethnic group that found itself on the losing side of the regime change in 1986. Yet,
with the increased reliance on external assistance from Sudan and the neighbouring country’s
southern region serving as a supply base and sanctuary for retreat, the LRA’s dependency on
local support waned over time. The group increasingly staged targeted attacks on civilians, many
of whom consisted of ethnic Acholi that were accused of collaboration with the central government
(Vinci 2007). Since the mid-1990s, the conflict was fought with increased brutality and saw mass
atrocities against the civilian population from both the Ugandan government and rebel forces
(Dolan 2009). Additionally, the LRA increasingly relied on the abduction of children in order to
forcibly recruit them as soldiers or laborers (Dunn 2004). Thus, although the LRA still majorly
comprised of ethnic Acholi, members of the ethnic group became at the same time the largest
group of victims affected by the conflict.
Violence surged to unprecedented heights between 2002 and 2005. After the Ugandan military
sought to destroy LRA-bases in southern Sudan in March 2002, the conflict spread to the hitherto
relatively unaffected subregions of Lango and Teso – in addition to the still heavily affected Acholi
subregion (Van Acker 2004). With 1,471 violent conflict incidents, roughly 78% of all events took
place during this period (see figure 2 below), causing destruction and displacement on a massive
scale. By 2006, LRA-related conflict intensity had decreased and remained largely contained to
the Acholi subregion (apart from 9 instances according to ACLED). Both conflict parties started
negotiations over a peace agreement which resulted in a ceasefire in August of that year. Although
the conclusion of a peace agreement eventually failed and the conflict spread to neighbouring
countries, fighting between the Ugandan military and the LRA de facto came to an end on
Ugandan territory after August 2006, barring sporadic incidents. With the local security situation
improving, the resettlement process of internally displaced persons (IDPs) to their home
communities started. Additionally, the government announced a comprehensive economic
recovery program for the conflict-affected region (World Bank 2009).
The context of Uganda’s conflict makes for a particularly fitting case to test the outlined
argument. First, it resembles a most-likely-case for observing the expected relationship due to the
conflict’s sheer severity. With a total of 8,549 casualties, it is a particularly intensive conflict-dyad,
ranking in the top 10% of all entries recorded in UCDP’s Battle-related deaths data set (based on
Pettersson et al. 2019, see Appendix figure A1). Second, the post-conflict phase was
characterized by events and developments that would lead us to expect a period of heightened
contention – and by extension, that developed group-based grievances may manifest in protest
9Roman Krtsch
actions. After two landmark events that were themselves accompanied by social unrest – the
referendum in 2005 that lifted the ban on political parties and the subsequent election in early
2006 (Goodfellow 2014; Aljazeera 2005) – the Ugandan government launched a series of
controversial reforms addressing sensitive issues related to land use, regional autonomy, or
executive power that sparked sometimes violent protests (Goodfellow 2014). In fact, both
nonviolent and violent protests have sharply increased after 2006, from a total number of 54 in
the years 2001-2005 to 155 in the five subsequent years according to ACLED (Raleigh et al. 2010).
Some of the post-war political conflicts had an explicitly ethnic dimension. For instance, several
bills introduced after 2005 that were perceived as touching the autonomy and basic rights of the
Baganda culminated in large-scale ethnic mobilization (Goodfellow 2014). Moreover, voting in the
2006 elections followed distinctive regional patterns, with the northern region having been the
strongest support base for the opposition candidate (Gloppen et al. 2006). Overall, the northern
and eastern ethnic groups that were most affected by the war – Langi, Acholi, and Iteso –
continued to remain excluded from political power after 2006 (Girardin et al. 2015), which
presented a potential source for new conflicts. Particularly policies related to the use and
ownership of land became one of the major issues of contention in the northern region
immediately after the end of conflict. Conflicts erupted in particular over disputed land ownership
between IDPs returning to their home communities on the one side and private companies or
government authorities on the other side (World Bank 2009; IDMC 2012).
Third, the 4th Afrobarometer round taking place in 2008 makes it possible to specifically
investigate the short-term effects of wartime experiences in the early post-conflict period. Uganda
has been among the most frequently surveyed countries over the course of several Afrobarometer
waves. For the purpose of this study, it is not only helpful that the time span between the end of
the conflict and the survey is relatively short. It is also useful that the country has been surveyed
as well in the first Afrobarometer round (2000), which happened to take place shortly before the
escalation of violence (the time point of both surveys is marked by the vertical bars in figure 2).
Following a similar approach as Rohner et al. (2013), this allows me to control for pre-treatment
values of some of the relevant variables, and thus address potential endogeneity concerns.
Figure 2: Number of monthly violent events in Uganda based on ACLED (Raleigh et al. 2010).
Vertical bars mark the start and end dates of the investigation period (note: the three districts from
Karamoja subregion, which are not included in AB round 4, are not considered here).
10Wartime Violence, Collective Grievances and Post-Conflict Protests
5. Data and operationalization
I test the hypothesis on the level of the individual respondent using survey data for Uganda from
the Afrobarometer. I make use of the 4th round, which was implemented in August 2008, shortly
after the LRA insurgency de facto came to an end on Ugandan soil and shifted its geographic
focus to South Sudan, the Democratic Republic of Congo, and later on to the Central African
Republic. The survey, which is nationally representative and geographically stratified, covers
2,431 respondents across all Ugandan regions. It includes areas less affected by the insurgency
in the central and western regions as well as those which were heavily affected in the north and
east. The Karamoja-subregion to the east, which was affected by non-state violence, is not
included in the 4th round.
The empirical analysis follows a three-step approach: First, I estimate the correlation between
local-level intensity of violence and individual protest propensity. Second, I address the assumed
causal mechanism. If exposure to violence affects post-war protest participation through an
increase of collective grievances, I expect the relationship to be conditional on another factor: the
degree to which the respondent’s own ethnic group has been exposed to violence. I therefore
interact the local-level intensity of violence with a group-specific measure of exposure. Lastly, I
test the mechanism with a causal mediation analysis by exploiting specific questions in the
Afrobarometer pointing to the presence of group-based grievances.
The approach to estimate the effect of exposure to violence on individual protest behaviour
rather than on spatial protest occurrence has a distinctive advantage. Post-conflict protest events
might not take place in the very same location where previous violence has occurred, but rather
cluster in nearby cities. In contrast, individual respondents’ locations are more likely to correspond
to the location of the assumed cause – in this case, war violence. A possible concern may still
arise with regard to the impact of conflict-induced migration. The civil war caused internal
displacement on a massive scale mounting to 1.8 million individuals in 2005 (IDMC 2013).
However, as Rohner et al. (2013) emphasize, this point may not affect the results in the present
case substantively. Most conflict-induced movement took place within individual counties, thus
alleviating concerns about distortions stemming from cross-county migration (for a related
argument, see De Luca/Verpoorten 2015a). Moreover, the return process to IDPs’ home villages
has been completed by the time of the survey for most conflict-affected regions. A notable
exception are the counties from the Acholi-subregion, in which a total of 24% of the original camp
population have returned to their villages of origin and 42% were still residing in transit areas by
July 2008 (OCHA 2008). I will implicitly account for this possibility in a later robustness check by
testing the model without Acholi-respondents.
Unless stated otherwise, all predictors are aggregated to the county-level (based on the extent
of 2002 according to the census), which is the lowest administrative unit for which information is
available in the Afrobarometer survey round 4. There is a total of 125 counties covered by this
survey round (out of a total of 164). Information on some control variables was only available for
the next higher administrative unit, the district level (57 districts in total, from which 51 were
included in the survey round).
5.1 Dependent variable, mediators and primary controls
The dependent variable is binary, indicating whether an individual has participated at least once
in a protest or demonstration during the past year. In particular, I draw from the survey item “Here
is a list of actions that people sometimes take as citizens. For each of these, please tell me whether
you, personally, have done any of these things during the past year. If not, would you do this if
you had the chance: Attended a demonstration or protest march?” The variable protest takes the
value 1 if the respondent reports to have attended a demonstration at least once in the last year
and takes the value 0 otherwise. A total of 210 respondents answered positively, which accounts
for 8.82%. Compared with other countries surveyed in the same wave, this figure is rather low
11Roman Krtsch
(see figure A1 in the appendix for a comparison). Protest propensity is slightly lower in counties
without a conflict event in the observed time period (8.5%) as opposed to those that have
experienced at least one conflict event (9%), but the difference is insignificant. It should be noted,
though, that this distribution is merely a bivariate depiction and also does not account for conflict
intensity, but for the fact of whether the county experienced violence at all or not.
I conjecture the relationship between conflict exposure and protest participation to be
mediated by the generation of group-based grievances. I use the survey item “How often are
[respondent’s ethnic group] treated unfairly by the government?” to capture this notion
empirically. The answer choices are collapsed into a binary mediator variable, with 0
corresponding to the answer choices “Never” and “Sometimes”, while 1 corresponds to “Often”
and “Always”.
A major problem in the effort to test the relationship between wartime exposure, grievances,
and protest activity concerns endogeneity: grievances may develop in the course of wartime
exposure, but it is likewise plausible that war-affected areas may have already shown fairly high
levels of discontent before the outbreak of violence. It may even be the case that grievance – and
by extent protest-intensive locations were intentionally attacked by the conflict parties, which
would mean that the assumed causal direction would in fact be reversed. In order to address this
issue, I apply a similar strategy as the one used in Rohner et al. (2013) and take a vector of
variables from the Afrobarometer round 1 in 2000 as my primary controls. These variables consist
of the district-mean values of respondents’ answers to survey items that shall capture pre-violence
levels of group-based grievances and ethnic identification (the survey questions in both rounds
are not identical, the corresponding variables and their generation are discussed in the appendix).
Unfortunately, there has been no question on protest participation in the 2000 round of the
Afrobarometer. However, I will include a control variable on protest locations prior to the
investigation period taken from the Armed Conflict Location and Event Dataset (ACLED, Raleigh
et al. 2010) in one of the robustness checks in order to address this issue. Lacking information on
pre-war attitudes and behaviour of the individual respondents from the 4 th round, I am nonetheless
confident that the approximation via the spatial pre-war prevalence of grievances, identity and –
in the robustness check – pre-war locations of protests mitigates endogeneity concerns. After all,
if protests and grievances determine attacks rather than vice versa, the location of the protest
events and spatial grievances prevalence may be a more plausible predictor than individual
attitudes and behaviour to begin with.
12Wartime Violence, Collective Grievances and Post-Conflict Protests
Figure 3: Spatial distribution and local intensity of violent events, 2000-2008. Events clustered
within a distance of .25 degrees (ca. 27.75 km.) Shaded counties are not included in the sample.
Figure 4: Buffers 1km (grey circles) and 10km (transparent circles) around conflict events. Shaded
counties are not included in the sample.
13Roman Krtsch
Figure 5: Violent event locations, 2000-2008, with assigned ethnic groups from SIDE 2011b.
Ethnic group names in singular form in accordance with answer categories in Afrobarometer
round 4. Shaded counties are not included in the sample.
5.2 Explanatory and interaction variable
The main explanatory variable captures local exposure to violence during the most intense period
of fighting between 2000-2008. The data is obtained from ACLED (Raleigh et al. 2010), which
compiles geo-referenced event data on various forms of political violence for the period of
investigation. I include all events between June 2000 (end of Afrobarometer round 1, the date of
measurement of the prime controls) and July 2008 (first recorded interview date of Afrobarometer
round 4) that were classified as either battles, violence against civilians or remote violence. I do
not explicitly distinguish between LRA-related events and other forms of organized violence like
clashes between communal or ethnic militias in the main models.1
The events are aggregated to the county-level and matched with the reported location of
respondents. Events with a geo-precision value of 3 are discarded (i.e., events that were attributed
to a larger region). For the investigation period, at least one violent event has been reported for
57% of all counties. However, the distribution is highly skewed, with 64% of all violent events
having occurred in one of the 9 counties in Acholi subregion alone (see figure 3 for an overview
of the local intensity of conflict throughout Uganda for the observed time period). I take the natural
logarithm of conflict events as I assume the marginal effect of each additional violent event to
decrease for higher values.
From the same data source, I construct an interaction variable that captures group-level
exposure. One way to approximate group-level variation of violence would be to rely on the actor-
1
The decision follows Kalyvas’ (2003) argumentation, who shows that it is often hard if not impossible to discern
individual, local-level cleavages from the war’s broader conflict process. As a result, I only restrict the inclusion
criterion to forms of organized violence.
14Wartime Violence, Collective Grievances and Post-Conflict Protests
information provided by ACLED itself (see, for instance Rohner et al. 2013). In most cases,
however, this essentially only allows us to make inferences on the ethnic affiliation of the
perpetrators of violence, whereas the victims’ ethnic attributes are rarely, if ever, reported. It is
yet precisely this information that needs to be obtained if one wants to assess the group-level
exposure to violence. I have thus opted for an alternative approach and matched the individual
locations of ACLED events to known settlement areas of ethnic groups. Implicitly underlying this
approach is the following assumption: if a violent event occurs in a location that is dominated by
a certain ethnic group, there is a high likelihood that this particular group has been affected either
by direct or indirect violence.
This approach requires very precise data on the location of ethnic groups. I have therefore
decided to match the locations of ACLED events to ethnic groups based on the Spatially
Interpolated Data on Ethnicity (SIDE) data set (Müller-Crepon/Hunziker 2018). SIDE maps religion-
and ethnicity-related information from geo-coded Demographic and Health Surveys for a range
of low- and middle-income countries, including Uganda, and interpolates ethnic compositions in-
between individual sampling points. The resulting advantage of SIDE is the possibility to obtain
information for local settlement patterns of ethnic groups on an extremely fine-grained resolution
of 0.0083 decimal degrees (which corresponds roughly to 1km at the equator). On the downside,
the earliest available information is from 2010, which potentially introduces post-treatment bias.
Given that ethnic settlement patterns tend to remain relatively stable, however, I am confident that
the specific ethnic composition around conflict locations is unlikely to be the immediate
consequence of conflict events.2
I chose the most recently available SIDE data from 2011 as it contains the maximum number
of ethnic groups that can be assigned to group identities from the Afrobarometer round 4 (all but
4 groups were assigned, which sums up to a total drop-out of only 29 respondents as compared
to the original analysis). Given the high resolution of the source data, I have created buffers of
0.0083 decimal degrees radius (ca. 1km) around each ACLED event and calculated the relative
share of each ethnic group recorded in SIDE. The violent event was then coded as affecting the
dominant group located within the buffer area. I have decided to err on the side of caution and
only considered a specific ethnic group to be affected by the respective ACLED event if the
group’s share is at least 50% of all groups in the buffer region. With this restriction in place, roughly
4.3% of all relevant conflict events in the sample dropped out as no single group had an absolute
majority. For a later robustness check, I have repeated the procedure using a radius with 0.083
decimal degrees length (ca. 10 km) in order to test whether the arbitrary choice of the buffer
radius and the consideration of potential imprecisions with regard to the conflict location impact
the eventual results. However, the assignment to the respective majority groups is virtually
identical (see figure 4 for an illustration of the buffer areas and figure 5 for the spatial distribution
of the assigned ethnic groups).
After assigning the conflict events to individual ethnic groups, I used the LEDA r-package in
order to link ethnic groups from SIDE with the response options for ethnic group identity in the
Afrobarometer (Müller-Crepon et al. 2020). I calculated a variable that captures for each
respondent the number of county-level violence affecting her own group divided by the county-
level violence affecting any other group (note here that the 4.3% of events that were not assigned
to any group are not included here as well). Thus, the interaction variable used in the analysis
captures the relative exposure of the respondent’s own group in a county. The ratio variable is
standardized at 1 for instances where no violence occurs. As with the main explanatory variable,
I take the logarithm in order to account for extreme values, which means that for the final variable,
0 corresponds to “no violence”.
The log-transformed variable can be interpreted as follows: Values smaller than 0 reflect
situations in which the respondent is located in a conflict-affected county – but the majority of
2
None of the ethnic groups’ settlement patterns in Uganda have changed between 1990 and 2017 in the GeoEPR data
(Wucherpfennig et al. 2011). This can admittedly only provide suggestive evidence, but it lends principle support to
my assumption.
15Roman Krtsch
violence likely affected another ethnic group. Conversely, values higher than 0 indicate that most
of the violence affected the respondent’s own ethnic group. If exposure to violence leads to
protest through a reinforcement of group-based perceptions of threat and grievances, I would
expect the relationship between the explanatory and dependent variable to be particularly
pronounced in the latter case. In 16% of all cases, a group other than the respondent’s one was
majorly affected by county-level violence, while the respondent’s own group was majorly affected
in 41% and no violence occurred at all in 43% of all cases.
I include several control variables on the individual- and county-level that may confound the
relationship between exposure to violence and protest mobilization. On the individual level, I
include a vector of respondent-characteristics taken from the Afrobarometer, including dummies
on urban location, ownership of television or radio, gender, employment status as well as
continuous variables on education, and age. Moreover, I include an additive index capturing the
availability of basic services – electricity, water, cell phone coverage, and a sewage system – at
the respondent’s location to approximate community-level development.
Beyond these personal attributes, location-specific characteristics are likely to have an impact
on the conjectured relationship. I therefore include a set of county-level variables including ethnic
and religious fragmentation, total population (log-transformed) and an additive index of water and
electricity access.3 All county-level information is obtained from Uganda’s 2002 population census
(Uganda Bureau of Statistics 2006). Although the census’s timing is after the starting point of the
investigation, concerns over post-treatment bias are mitigated by the fact that the variables are
still measured before the surge of violence that started in 2002. For later robustness checks, I
have also calculated the mean additive index of water/electricity access, religious fragmentation
and total population on the level of individual ethnic groups based on the census data. Lastly, I
account for differences between broader geographical regions and group-specific factors by
including region- and group-fixed effects in the main models.
6. Empirical results
I use linear probability models with robust standard errors clustered at the county-level to estimate
the effect of exposure to violence on post-conflict protest participation. Table 1 presents the
results, with the first specification (model 1) estimating the model without explicitly considering
regional heterogeneity between different parts of the country. We see already a positive and
statistically significant relationship between the (log-transformed) number of violent events and
protest participation. In substantive terms, moving from 0 to the median value of the independent
variable (.7, which corresponds to 1 event) increases the probability of protest participation by
13.5%; moving from 0 to the 90th percentile (3.37, which corresponds to roughly 28 events) even
increases the probability by 65.6%. To put it into perspective, this last category of heavily affected
counties encompasses all nine counties in the Acholi subregion (the epicentre of the conflict prior
to 2002), but also one county in Teso subregion (Amuria), one county in the West Nile subregion
(East Moyo) and one county in Lango subregion (Lira Municipality). After including region-fixed
effects, the coefficient increases both in magnitude and significance (model 2). Model 3
additionally includes ethnic group-fixed effects to the model. The effect for the main independent
variable remains of similar magnitude, though at a lower level of significance.
3
The index shows a strong correlation with other indicators drawn from the census, including mean level of education
or unemployment rate, and with other typical operationalizations of socio-economic development such as nighttime
lights emissions. In order to avoid multicollinearity, I have only included the additive index of basic services here.
16Wartime Violence, Collective Grievances and Post-Conflict Protests
Table 1. Linear regression results for wartime exposure on protest participation
(1) (2) (3)
Protest Protest Protest
Violent events in county (log) 0.0135* 0.0191*** 0.0173+
(0.0054) (0.0053) (0.0097)
Individual controls:
Urban location -0.0022 -0.0085 -0.0048
(0.0218) (0.0213) (0.0217)
Female -0.0353 ***
-0.0349 ***
-0.0364***
(0.0098) (0.0098) (0.0100)
Level of education 0.0103 0.0100 0.0110
(0.0139) (0.0137) (0.0141)
Respondent‘s age -0.0013 **
-0.0013 **
-0.0013**
(0.0004) (0.0004) (0.0005)
Public services (individual) 0.0145* 0.0148* 0.0161*
(0.0066) (0.0067) (0.0064)
TV/Radio ownership 0.0316 *
0.0341 *
0.0337*
(0.0132) (0.0134) (0.0133)
Employed 0.0014 -0.0005 -0.0048
(0.0125) (0.0126) (0.0125)
County-level controls:
Total population (log) -0.0245* -0.0315** -0.0336*
(0.0117) (0.0118) (0.0162)
Ethnic fractionalization 0.0860 *
0.0713 *
0.0818*
(0.0364) (0.0349) (0.0398)
Public services (county) -0.0599 -0.0639 -0.0528
(0.0395) (0.0410) (0.0434)
Religious fractionalization -0.0670 -0.2503 *
-0.3003*
(0.0997) (0.1045) (0.1368)
Constant 0.4936 *
0.7253 ***
0.5794*
(0.1967) (0.2036) (0.2386)
Ethnic group-dummies No No Yes
Region-dummies No Yes Yes
Controls from AB round 1 Yes Yes Yes
Observations 2220 2220 2213
R2
0.027 0.033 0.047
Robust standard errors (in parentheses) clustered on the county-level
+
p < 0.10, * p < 0.05, ** p < 0.01, *** p < 0.001
17Roman Krtsch
6.1 Robustness checks
Before turning to the further exploration of the mechanism, a series of robustness checks shall
test whether the findings of the main models hold against various model specifications. The results
can be obtained from the appendix (tables R1 and R2). Unless otherwise specified, I use model 1
as the baseline for further specifications.
First, I repeat the analysis using a logit (Table R1, model A1) instead of a linear probability
model. The table reports average marginal effects, which remain almost identical to the
explanatory variable’s coefficient in the main analysis. The second specification adds to the model
a binary indicator on county-level protest mobilization before 2000 (obtained from ACLED), which
could potentially account for post-conflict behaviour. Again, results from model A2 suggest no
substantial impact on the main relationship. Third, after changing the explanatory variable’s level
of aggregation from the county- to the district-level (the first administrative unit), the coefficient
becomes insignificant – but only if region-fixed effects are not included (model A3).
Model A4 tests whether the exclusion of Acholi-respondents impacts the overall results. A
large share of violent events for the investigation period clusters in Acholi-dominated counties,
which means that the results could be significantly driven by the outliers from this group (in fact,
the mean number of violent events for Acholi respondents is 97.97, whereas the mean for all
respondents lies at 13). Moreover, the Acholi subregion was the only area left for which a
substantial amount of wartime IDPs have not returned to their home villages by 2008. If the results
hold even after excluding Acholi-respondents from the analysis, it would thus hint also to a
decreased salience of the pace of IDP return as an alternative mechanism for post-conflict
grievance formation. The coefficient in model A4 yet remains significant (albeit only at a 10% level)
and decreases only slightly even after excluding respondents from the analysis that identified
themselves as Acholi. The results are significant at a 5% level if region-fixed effects are included.
In the fifth specification, I test how exposure to violence affects protest participation in the
subsequent, 5th round of the Afrobarometer from 2012 (A5). The coefficient remains insignificant.
Although this non-finding is arguably difficult to interpret, it may point to the previously outlined
assumption that the effect of wartime experiences on protest likelihood is particularly prevalent in
the immediate phase following the end of war.
The last set of robustness checks reported in table R2 tests the impact of modifications to the
explanatory variable on the outcome. Using the original count of violent events instead of the log-
transformed variant (A6), battle-related fatalities instead of events (A7), specifically violence
against civilians (A8), or only LRA-related violent events (A9) all yield results similar to the original
model in terms of sign and significance. In a similar vein, substituting the measure of violent events
by ACLED with an alternative data source on violent events – the UCDP Georeferenced Event
Data Set (GED) v.20 (Sundberg/Melander 2013) – does not change the results substantively
(A10).4
Model A11 concludes by using the maximum number of IDPs per year as the independent
variable. As explained earlier, the majority of conflict-induced population movement is assumed
to have occurred within individual counties, which means that IDP figures can be regarded a valid
alternative proxy for local conflict intensity. Information on such a disaggregated level is yet
sparse, so I have relied here on the Humanitarian Update reports from UNHCR (e.g., OCHA 2002).
As compared to the proxy used in the main analysis, this measure is problematic insofar as it is
inconsistent, on a higher level of aggregation (district-level) and only fully available until 2005 –
which yet covers the most conflict-intensive periods. Ultimately, these reservations render the
measurement of an absolute number of IDPs in a location problematic, but it allows nonetheless
to assess a stock figure of the (logged) maximum number of reported IDPs for each district in the
time 2000 to 2005. As model A11 shows, this measure shows a positive and statistically significant
effect, although the coefficient is considerably smaller as compared to the main analysis.
4
The operationalization procedure is outlined in the appendix.
18Wartime Violence, Collective Grievances and Post-Conflict Protests
7. Exploring the causal mechanism
The final section addresses the causal mechanism. I argue that wartime violence tends to
reinforce perceptions of group-based grievances – which in turn lead to a higher propensity to
engage in collective action. From this expectation follow two observable implications: First, the
effect of local-level violence on protest behaviour should be particularly strong if the respondent’s
own ethnic group has been affected by violence. Second, perceptions of relative deprivation
should have a mediating effect on the relationship between wartime violence and protest
participation.
Starting with the first conjecture, I have repeated models 1 through 3 with an interaction term.
The effect of Violent events in county (log) on protest participation is estimated conditional on the
ratio of the respondent’s own group’s exposure relative to the exposure of other groups (Models
A12 through A14, table R3). Figure 6 visualizes the average marginal effects of wartime violence
for different values of the interaction variable using again model 1 as the baseline.5 The plot shows
that the effect is insignificant for most negative values (up to -.6). This means, an increase of
violence is not systematically related to an increase of protest participation if the respondent does
not belong to the majorly affected ethnic group. The effect becomes significant only when the
ratio narrows down, and the effect increases with higher relative exposure of the respondent’s
own group. These results corroborate the idea that one pathway from experiences of wartime
violence to protests is tied specifically to group-related exposure.
Figure 6: Average marginal effects of “Violent events in county (log)” for different values of “Ratio
of own group violent exposure / Other groups violent exposure in county (log)” with 95% CIs
(based on model A12).
5
All models additionally include census-based control variables measured on the level of the respondent’s ethnic group
in order to account for between-group differences. All models (A12 through A19) can be obtained from the regression
tables R3 through R5 in the appendix.
19You can also read