Wealth Inequality and Closing
the Poverty Gap in Arab Countries
The Case for a Solidarity Wealth Tax
←
→
Page content transcription
If your browser does not render page correctly, please read the page content below
Wealth Inequality and Closing the Poverty Gap in Arab Countries The Case for a Solidarity Wealth Tax
Distr.
 LIMITED
 E/ESCWA/CL2.GPID/2020/TP.9
 2 June 2020
 ORIGINAL: ENGLISH

Economic and Social Commission for Western Asia (ESCWA)

Wealth Inequality and Closing
the Poverty Gap in Arab Countries
The Case for a Solidarity Wealth Tax

United Nations
Beirut

_______________________
 The authors would like to thank Mrs. Heba El Laithy, Mr. Paul Makdissi, Mr. Ali Abdel Gader, Mr. Mohamed Pournik and
Mr. Christian Oldiges for their comments on an earlier draft of the present paper.

20-00210
© 2020 United Nations
 All rights reserved worldwide

Photocopies and reproductions of excerpts are allowed with proper credits.

All queries on rights and licenses, including subsidiary rights, should be addressed to the
United Nations Economic and Social Commission for Western Asia (ESCWA),
e-mail: publications-escwa@un.org.

The findings, interpretations and conclusions expressed in this publication are those of the authors
and do not necessarily reflect the views of the United Nations or its officials or Member States.

The designations employed and the presentation of material in this publication do not imply the
expression of any opinion whatsoever on the part of the United Nations concerning the legal status
of any country, territory, city or area or of its authorities, or concerning the delimitation of its
frontiers or boundaries.

Links contained in this publication are provided for the convenience of the reader and are correct at
the time of issue. The United Nations takes no responsibility for the continued accuracy of that
information or for the content of any external website.

References have, wherever possible, been verified.

Mention of commercial names and products does not imply the endorsement of the United Nations.

References to dollars ($) are to United States dollars, unless otherwise stated.

Symbols of United Nations documents are composed of capital letters combined with figures.
Mention of such a symbol indicates a reference to a United Nations document.

United Nations publication issued by ESCWA, United Nations House, Riad El Solh Square,
P.O. Box: 11-8575, Beirut, Lebanon.

Website: www.unescwa.org.
Executive Summary

The high inequality of wealth in the Arab region The Arab region holds $5.8 trillion in household
and unrelenting poverty, especially following wealth according to ESCWA calculations from
the outbreak of the COVID-19 pandemic, Credit Suisse data in 2019. The top 10 per cent
highlight the need for stronger civic solidarity of the population account for $4.4 trillion: the
and shared responsibility by the public, the bottom 46 per cent have an average wealth of
private sector and the State for lifting $975, while the top 10 per cent have an average
marginalized people out of poverty. The present wealth of $182,939. The bottom 46 per cent are
study measures the distribution of wealth within made up primarily of the nationals of LDCs,
and across Arab region countries, estimates the while the top 10 per cent largely hail from Gulf
extent of poverty in pre- and post-COVID-19, Cooperation Council (GCC) countries.
and assess the feasibility of reducing poverty by
introducing a solidarity wealth tax. The pre-COVID-19 cost of covering the poverty
 gap in 2019, using the most recent nationally
Advanced parametric methods are applied to defined poverty lines, was $38.6 billion per year
wealth statistics from the Forbes billionaires for 13 Arab countries where data is available
lists and Credit Suisse wealth reports, and to and whose populations constitute over 90 per
poverty projections from PovcalNet and cent of the non-GCC Arab population. Most of
UNDESA, to identify the incidence of wealth and this cost is in Egypt, the Sudan, the Syrian Arab
poverty, and compute the required poverty- Republic and Yemen. Factoring in the poverty
reduction tax on the wealth of the top decile. impact of COVID-19, this figure rises to $45.1
 billion in 2020. These numbers imply a solidarity
The analysis offers many key estimates on wealth tax of around 2.6 per cent would cover
regional wealth distribution. The region’s 37 the cost of closing the poverty gap in these
billionaires (all men) held almost $108 billion in countries in 2019. However, the proposed
2019, totalling 4 per cent of the region’s gross solidarity wealth tax is relevant mainly to
domestic product (GDP). This is comparable to middle-income countries, where the average
the GDP of Morocco, and higher than the estimated solidarity wealth tax was 0.9 per cent
combined GDP of the Arab region’s two largest in 2019, rising to 1.2 per cent in 2020 when the
least developed countries (LDCs), the Sudan and COVID-19 impact on headcount poverty and
Yemen. ESCWA estimates also show that the wealth is taken into consideration.
real wealth of the region’s 37 billionaires is
equivalent to the real wealth of the region’s Since tax buoyancy in the region is low relative
poorest 110 million adults (46 per cent of the to other regions of the world with similar
adult population). income per capita, there is potential for the

 Executive Summary | Wealth Inequality and Closing the Poverty Gap in Arab Countries iii
implementation of a solidarity wealth tax. High wealth tax policies with a focus on property
debt and widening deficits in Arab countries taxes, and mitigate rampant tax evasion. A key
also make tax reforms an urgency. Efforts to entry point is to require all individuals to file
mobilize revenues have largely relied on income tax returns, and design tax forms to
regressive indirect taxation or broadening the capture estimates of taxable wealth. This would
tax base. Most tax reforms across the region do improve poverty targeting since ministries of
not target wealth, and tend to burden the poor finance, social affairs and other related domains
and the middle class more than the richest part could target individuals’ accumulated wealth, not
of population. Assessing the wealth of the only income streams. The current COVID-19 crisis
ultrawealthy and the potential of a solidarity makes these measures all the more relevant.
wealth tax therefore remains an unexplored They would help secure fiscal space to support
issue (ESCWA, 2019). the rising social and economic costs of recession,
 and compensate for recent fiscal responses that
Tax authorities should implement inspection and relaxed taxes on small businesses and the
enforcement mechanisms to design appropriate middle class.

iv Wealth Inequality and Closing the Poverty Gap in Arab Countries | Executive Summary
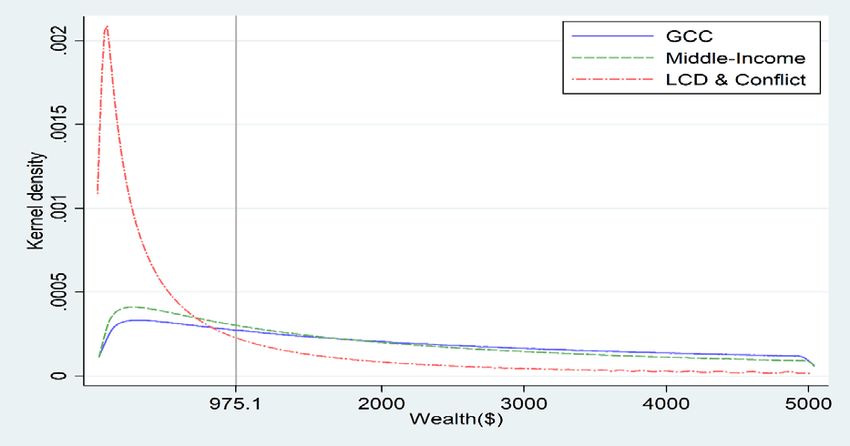
Contents

 Page

Executive Summary iii
Introduction 1

I. Data and methods 3
 A. Data sources 3
 B. Wealth imputation 4
 C. Poverty gap cost 6

II. Results 9

III. Policy implications 17

IV. Conclusions 21
Bibliography 23
Endnotes 27

List of tables
Table 1. Billionaires and adult population shares in the Arab region 9
Table 2. Projected headcount poverty rates (%) using national poverty lines 13
Table 3. Number of poor based on the headcount poverty ratio using national poverty lines 14
Table 4. Countries’ cost of closing the poverty gap and wealth of the richest decile 15

List of figures
Figure 1. Countries’ share of the region’s wealthiest 10 per cent and poorest 46 per cent 10
Figure 2. Share of countries’ adults among the Arab region’s wealthiest 10 per cent and poorest 46 per cent 11
Figure 3. Income density curves: LDC and conflict, middle-income and GCC countries 12
Figure 4. Arab region’s Lorenz curve: LDCs and conflict-affected countries, MICs and GCC countries 12
Figure 5. Composition of tax revenue in selected oil-poor countries 20

 Contents | Wealth Inequality and Closing the Poverty Gap in Arab Countries v
Introduction

The juxtaposition of extreme wealth and study estimates the full distribution of wealth
destitution is vividly on display in the Arab region for residents within and across countries, and
owing to, on the one hand, the concentration of reports on wealth shares held by various
oil wealth and, on the other, natural adversities, quantile groups, and on wealth incidence
lack of public infrastructure and safety nets, and across countries. It also contributes novel
the recurrence of conflict (ESCWA and ERF, estimates of the extent of poverty based on
2019). Wealth differences between the Gulf national poverty lines in the region, and the
Cooperation Council (GCC) countries and their cost of closing the poverty gap, both pre- and
conflict-stricken neighbours, including the Sudan, post-COVID-19. Lastly, it proposes the
the Syrian Arab Republic and Yemen, are severe. introduction of a solidarity tax on the
However, information on wealth distribution is wealthiest residents to cover the poverty gap,
sparse, not least because of rampant wealth in recognition of the need for stronger civic
hiding and tax evasion. The Panama Papers and solidarity and of the shared responsibility of
Offshore Leaks offer a glimpse of the problem, the public, the private sector and the State for
linking thousands of regional residences, entities lifting marginalized people out of poverty. We
and officers to offshore accounts. Taking into estimate the appropriate solidarity wealth tax
account the hard-to-measure ultrawealthy, rate across the region’s middle-income
researchers have called the Middle East the most countries (MICs) and least developed
unequal region globally (Alvaredo and Piketty, countries (LDCs).
2014; Assouad, 2017; Van der Weide, Lanker and
Ianchovichina, 2018; Alvaredo, Assouad and Section I introduces the data and methods used
Piketty, 2019). for estimating wealth distribution in the region
 and the cost of closing the poverty gap. Section
Given the lack of concrete information on top II presents the main estimation results. Finally,
wealth, and the apparent between-country section III discusses key lessons learned and
polarization of wealth in the region, the present potential limitations.

 Introduction | Wealth Inequality and Closing the Poverty Gap in Arab Countries 1
I. Data and methods

The present study relies on several specialized Moreover, household budget surveys are not
data sources on the distribution of wealth and designed to provide a thorough inventory of
incomes in the Arab region, and on two households’ asset holdings and their market
advanced parametric methods for estimating values. The urgency of data confidentiality when
the distribution of wealth and the cost of closing it comes to wealth further complicates matters.
the poverty gap.
 Consequently, existing research has typically
 used a small number of authoritative data
A. Data sources sources on individual wealth. The Forbes
 magazine’s annual rich lists have emerged as
Information on people’s wealth is considerably reliable snapshots of the top of the global and
weak, because of the heterogeneity of financial, national wealth distributions, facilitating
material and intangible capital that individuals tracking of the fortunes of the ultrawealthy over
amass to hold their savings, and because of the time. Forbes relies on a variety of data sources,
poor inventory of these types of capital and including self-reporting, and measures wealth
uncertainty over their value. These as all types of assets, including stakes in public
measurement problems affect the various parts and private companies, real estate, art, yachts,
of wealth distribution differently. While the poor planes, ranches, vineyards, jewellery, car
are often cut off from the formal financial collections, debt and charitable giving. To value
markets because of capital requirements, the private businesses, Forbes couple revenue or
ultrawealthy benefit from various schemes and profit estimates with prevailing price-to-sales or
instruments to optimize their capital portfolio, price-to-earnings ratios for similar public
limit the risks of expropriation, and minimize companies, and apply a 10 per cent discount or
their tax liability. The recent release of the so- more in cases where information is scarce.
called Offshore Leaks and the Panama Papers Wealth belonging to a member’s immediate
offered a glimpse of the extent of the wealth family is included if the wealth can be traced to
stow-away and tax evasion problems in the a living founder of the fortune (Wang, 2019).
region. A total of 3,963 postal addresses, 10,115 The present study uses Forbes data to survey
entities, 6,369 officers, and 354 intermediaries the Arab region’s billionaires as of 2019.
referenced in the leaked files hail from the Arab
region. 1 According to the Forbes billionaires list dated
 March 2019, there were 27 billionaires in the
Given these problems, neither national accounts Arab region, excluding ruling families and
nor tax authorities are reliable sources of data Heads of States, who are omitted by design. To
on national private wealth, particularly on the this count we can add the 10 Saudis who were
distribution of wealth across residential units. included in the 2017 billionaires list, but were

 Data and methods | Wealth Inequality and Closing the Poverty Gap in Arab Countries 3
subsequently removed for logistical reasons. above, since personal assets and debts are
These 37 billionaires hold $107.6 billion (real typically owned by named individuals, and may
2019 United States dollars), constituting 4 per be retained by those individuals if they leave the
cent of the region’s GDP ($2.7 trillion in 2018). household; household members may have an
This figure compares to the GDP of Morocco unequal say in the management of assets; and
($117.9 billion) and is significantly higher than children have little formal or actual wealth
the combined GDP of the region’s two largest ownership (Credit Suisse, 2019b).
LDCs, Yemen and the Sudan ($26.9 billion and
$40.8 billion in 2018, respectively). To estimate the cost of closing the poverty gap,
 it is first necessary to estimate headcount
Unfortunately, Forbes lists are restricted to the poverty and poverty gap ratios. In the present
several dozen ultra-wealthy, and are known to study, these are based on the most recent
be selective and non-representative. To study national poverty lines for 14 non-GCC Arab
the full distribution of wealth and the prospect countries, comprising the vast majority of the
of wealth taxation, more consistent data is region’s middle- and low-income population.
needed on country-wide private wealth. In 2010,
Credit Suisse started compiling descriptive The country level and regional baseline
statistics of aggregate private wealth in all headcount poverty and poverty gap ratios in
countries worldwide. This annual effort has 2018 are estimated using the World Bank’s
given rise to a balanced panel dataset, tracking PovcalNet, which calculates poverty headcounts
the year-to-year evolution of the level and and poverty gaps by imputing full national
distribution of national wealth. Credit Suisse income distributions parametrically (Datt, 1998;
defines wealth as the marketable value of Minoiu and Reddy, 2009). United Nations
financial assets plus non-financial assets forecasts of GDP and population growth are
(principally housing and land) less debts (Credit used to project these ratios to 2019 and 2020,
Suisse, 2019b). According to this definition, the based on the growth and distribution elasticities
average national wealth Gini coefficient is 73.6 derived from the earlier procedure.
in Arab countries, compared with 73.1 in other
countries globally. Meanwhile, two Arab The projected cost of closing the poverty gap in
countries, Lebanon and Saudi Arabia, are 2019 and 2020 is simply the product of these
reportedly among the top 20 wealth-unequal estimated headcount poverty and poverty gap
countries worldwide. 2
 ratios and the size of population.

The present study uses Credit Suisse data to
impute the full distribution of national private B. Wealth imputation
wealth in the Arab region. This imputed
distribution is linked to Forbes actual Using the Credit Suisse descriptive statistics of
observations for the ultrawealthy, and to national wealth, we can approximate the entire
ESCWA estimates of the extent of poverty in the distribution of wealth across adult individuals in
Arab region, and the resources needed to each Arab country and region-wide. This is done
reduce it. In line with the Credit Suisse through parametric modelling of the wealth
methodology, the unit of analysis in the present distribution in a country using two-parametric
study is taken to be adults 20 years old or distribution functions commonly used in

4 Wealth Inequality and Closing the Poverty Gap in Arab Countries | Data and methods
inequality research: the lognormal, or the cumulative distribution function (aka., Gaussian
Pareto. These distributions are suitable for the or probit) ′ ( ):
task because they are fully characterized by two
 + 1
statistics describing the empirical level and � = √2 ′ � �,
 2
 �), and the Gini
dispersion of wealth: the mean (
coefficient ( ) of wealth. and the mean is derived as:

 2
 �) for
The estimation involves imputing wealth ( �) − � �2 .
 ̂ = log(
individuals at each percentile of the wealth
distribution, ∈ ℝ(0; 1), using the appropriate Lastly, individuals’ wealth is imputed as
inverse cumulative distribution function ′(∙). � = ′ ( , ̂ , �) . In these expressions,

For the Pareto distribution, the inverse country and year subscripts are omitted for
cumulative distribution function takes the form: clarity of presentation.

 0
� = ′( , 0 , ) =
 �(1 − ) −1 , The log-normal distribution function is adopted for
 all but the highest 0.5 per cent of wealth values, in
where 0 is the scale or location coefficient consideration of the extensive prior evidence of its
marking the lower threshold of the distribution, relevance to the full domain of incomes and its
and is the Pareto shape coefficient dictating ease of estimation (Aitchison and Brown, 1957;
the rate of decay of wealth. is estimated as: Jäntti, Sierminska and Van Kerm, 2015; Hlasny,
 2020a). The top 0.5 per cent of wealth values in
 (1 + )�
 � = 2 . each country are imputed using the Pareto
 distribution, in line with the methodology of Credit
From this we can also derive the corresponding Suisse (2019b, p. 114) and academic evidence
inverted Pareto coefficient , which is often (Harrison, 1979; Cowell and Van Kerm, 2015;
reported as an inequality measure in its own Jäntti, Sierminska and Van Kerm, 2015;
right: Eckerstorfer and others, 2016; Vermeulen, 2016).
 A convex combination of the two distributions
 ̂ = ��( � − 1) . was considered in line with Hruschka, Gerkey and
 Hadley (2015). However, in the absence of
The lower threshold for modelling the Pareto anchoring information that would help calibrate
distribution, 0 , is selected using Hruschka and the combined distribution, we follow prior
others (2015) as: literature on using the distribution functions in
 their pure form on different income ranges. 3
 0 = (1 − � −1 )
 �.
 Imputed wealth is reported in year 2019
Under the lognormal distribution, wealth international United States dollars. However,
imputation is undertaken analogously from the top decile wealth, which is used to compute the
inverse lognormal cumulative distribution solidarity wealth tax, is adjusted in 2020 to
function, ′ ( , , ), which is a function capture the potential impact of COVID-19. For
of the standardized mean and standard 2020, we use the rule of thumb that the wealth
deviation . This standard deviation can be level of the highest wealth decile has declined
estimated from the inverse standard-normal by 8 per cent from its October 2019 level. This is

 Data and methods | Wealth Inequality and Closing the Poverty Gap in Arab Countries 5
consistent with the most recent ESCWA % growth in the Gini index of consumption
estimate of the wealth impact of COVID-19 (Kakwani, 1980, p.174). If everyone receives the
(ESCWA, 2020b). It is also consistent with the same proportional benefits of growth, the
estimate that the billionaire wealth in the region inequality of per capita consumption would not
is declining by 16 per cent year on year. 4
 change over time. In practice, however, not
 everyone receives the same proportional
 benefits. Economic growth may be called pro-
C. Poverty gap cost poor (anti-poor), if it is accompanied by a
 decrease (increase) in inequality – is
Money-metric poverty can be measured using negative (positive). Growth is distribution
various indexes. The most common measures neutral if is 0.
are the headcount ratio (the ratio of those with
consumption expenditure below the poverty line Suppose xit is the per capita consumption of the
to total population) and the poverty gap (the ratio ith household in year , and is the per capita
showing the mean shortfall with respect to the mean consumption of all households. We can
poverty line across the entire population). The thus approximate:
fundamental determinants of money metric
poverty are the mean per capita consumption = [ −1 + ( −1 − −1 )](1 + ),
expenditure, the poverty line, and the distribution
of consumption expenditure. The poverty where = −1 (1 + ).
headcount ratio is expected to decline (increase)
as per capita consumption expenditure increases Suppose is the per capita poverty line for the
(decreases), or as the dispersion of consumption ith household, assumed fixed over time. The
expenditures about the mean decreases present paper adopts absolute poverty lines,
(increases). Any change in the poverty rate over set at nationally defined levels. 5 These are
time can thus be linked to an economic growth superior to PPP-based poverty lines in three
component and a distribution component. important respects. Firstly, as they are
Holding the growth in per capita consumption household specific, they are tailored to the
constant, the poverty rate is expected to increase local food consumption patterns of the poor.
as the degree of inequality increases. Secondly, they consider the demographic and
 other characteristics of the household in
With economic growth, the mean consumption determining minimum caloric requirements
changes in conjunction with changes in and basic non-food needs. Thirdly, they
inequality. This means that the growth elasticity evaluate the cost of these basic needs using
of poverty does not remain fixed. Following prices at the local level. From a policy
Kakwani and Son (2006), the methodology perspective, adopting national poverty lines
presented here takes account of changes in the tends to be more practical for Arab
growth elasticity of poverty over time by Governments as it applies nationally defined
focusing on two measures: headcount ratio, and lines that are consistent with their own
poverty gap ratio. definitions. The results are therefore more
 relevant for estimating the impact of the
Suppose is the growth rate of per capita COVID-19 crisis at the country level, and thus
mean consumption, and it is accompanied by a for forging national responses.

6 Wealth Inequality and Closing the Poverty Gap in Arab Countries | Data and methods
 −
Given these arguments in favour of using the = � 1( < )[ ].

national poverty lines, the present paper uses
the most recent household budget surveys to and depend on the growth rate and
compute the relevant poverty headcount ratios Gini elasticity . Thus, we can impute poverty
in Arab countries in 2018, based on the PPP measures each year for any value of and .
equivalent of these national poverty lines using
Povcalnet. 6 The poverty headcount ratios are Using the poverty gap ratio for nationally
projected to 2019-2020 based on grouped data defined poverty lines, and given information
using: the projected growth rates in mean per on mean consumption expenditure, we can
capita household expenditure (United Nations easily cost the resources required to close the
Department of Economic and Social Affairs GDP poverty gap using national definitions, one of
forecasts); and assuming a 1 per cent increase the main indicators for meeting Sustainable
in the Gini index and using country level Development Goal 1. Multiplying a country’s
elasticities of headcount poverty to the Gini as poverty gap ratio by both the poverty line and
estimated in PovcalNet. the total population in that country ( ) yields
 an estimate of the resources required to bridge
The headcount measure of poverty in year is the gap between the expenditure of the poor
given by: and what is required to lift them out of poverty.
 The cost of closing the poverty gap is
 = 100 � [ < ] = 100 � 1( < ) . converted into current international United

 States dollars. The solidarity wealth tax
This expression, without calling for any required to close the poverty gap ( ) is
probability relation, simply identifies people as computed as the ratio of the aggregate current
falling under the poverty line or not, with cost of closing the poverty gap to the
probability 1 or 0. (Population weights attached cumulative wealth of the wealthiest-decile
to the i sample household are omitted for
 th
 adults (∑ ∈ 10% ). 7
clarity.) The poverty gap ratio in year can then
 × ×
similarly be obtained as: = .
 ∑ ∈ 10%

 Data and methods | Wealth Inequality and Closing the Poverty Gap in Arab Countries 7
II. Results

By imputing the entire wealth distribution holding an equivalent amount of wealth as
for each Arab country, and the region at large, the 37 richest Arab men. We find that the
we can first estimate the regional Gini 37 richest Arab men hold the equivalent
coefficient of wealth. This stands at 83.9 for the of the real 2019 wealth of the poorest 110.4
20 countries evaluated. We can also estimate million (46 per cent) of the region’s adult
the share of the poorest population collectively population. 8

Table 1. Billionaires and adult population shares in the Arab region
 Share of Share of
 Billionai Real countries’ countries’
 Forbes re real wealth Adults among adults Adults among adults
 billion wealth per region’s appearing region’s appearing
 -aires (2019$ adult Adults Gini poorest 46% among region’s richest 10% among region’s
 Country (#) bil.) (2019$) (‘000) (%) (‘000 [%]) poorest 46% (%) (‘000 [%]) richest 10% (%)
 Algeria 1 3.7 9,348 26,983 74.9 14,368.5 [13.0] 53.3 1,113.0 [4.6] 4.2

 Bahrain 87,108 1,219 74.7 117.3 [0.1] 9.6 441.9 [1.8] 36.3

 Comoros 5,155 423 78.3 297.7 [0.3] 70.4 7.9 [0.03] 1.9

 Djibouti 2,936 583 72.9 453.3 [0.4] 77.8 3.6 [0.02] 0.6

 Egypt 6 15.8 15,395 58,309 75.6 24,562.7 [22.3] 42.1 4,446.1 [18.5] 7.6

 Iraq 16,540 19,788 63.3 4,551.2 [4.1] 23.0 1,706.7 [7.1] 8.6

 Jordan 26,475 5,512 69.6 1,164.4 [1.1] 21.1 819.9 [3.4] 14.9

 Kuwait 1 1.4 131,269 3,086 76.3 227.6 [0.2] 7.4 1,357.8 [5.7] 44.0

 Lebanon 7 13.4 55,226 4,205 81.9 1,124.8 [1.0] 26.8 893.6 [3.7] 21.3

 Libya 19,473 4,169 65.9 943.2 [0.8] 22.6 448.2 [1.9] 10.8

 Mauritania 2,397 2,310 68.1 1,839.3 [1.7] 79.6 8.7 [0.04] 0.4

 Morocco 2 3.8 12,929 23,613 76.6 11,304.7 [10.2] 47.9 1,475.8 [6.1] 6.3

 Oman 2 4.3 43,291 3,608 78.6 911.0 [0.8] 25.3 708.1 [2.9] 19.6

 Qatar 1 1.6 147,745 2,223 63.3 16.7 [0.0] 0.8 1,419.9 [5.9] 63.9

 Saudi Arabia 10 43.9 67,032 23,208 83.4 6,121.1 [5.5] 26.4 5,337.8 [22.2] 23.0

 Sudan 534 20,474 68.7 19,859.8 [18.0] 97.0 0.0 [0.00] 0.0
 Syrian Arab
 2,179 9,664 69.9 7,936.6 [7.2] 82.1 36.2 [0.2] 0.4
 Republic
 Tunisia 13,853 8,111 70.5 3,021.3 [2.7] 37.3 557.6 [2.3] 6.9
 United Arab
 7 19.7 117,060 7,874 79.6 954.7 [0.9] 12.1 2,942.9 [12.2] 37.4
 Emirates
 Yemen 4,926 14,580 79.8 10,588.7 [9.6] 72.6 273.4 [1.1] 1.9

 Total 37 107.6 24,759 239,942 83.9 110,390.3 46.0 23,999 10.0
Source: Authors’ analysis of Forbes (2019), Credit Suisse (2019b), and World Bank data.
Note: The State of Palestine is missing in the Forbes and Credit Suisse data.

 Results | Wealth Inequality and Closing the Poverty Gap in Arab Countries 9
Table 1 shows that the 37 billionaires in 2019 poorest are Egyptians, 18 per cent are
consisted of six Egyptians, seven Lebanese, 10 Sudanese, 13 per cent are Algerians, 10 per cent
Saudis, seven Emiratis, two Moroccans, two are Moroccans, 10 per cent are Yemenis, and 7
Omanis, and one Algerian, one Kuwaiti and one per cent are Syrians (figure 1). As observed
Qatari. By contrast, the poorest 110.4 million are globally, the region’s richest come from
estimated to comprise 24.6 million Egyptians, different countries than the region’s poorest,
19.9 million Sudanese, 14.4 million Algerians, and national wealth distributions are not aligned
11.3 million Moroccans, 10.6 million Yemenis, (figures 2-3). The Lorenz curve for the region,
7.9 million Syrians, 6.1 million Saudis, 4.6 showing the cumulative wealth shares at
million Iraqis, 3 million Tunisians, 1.8 million different adult-population percentiles, confirms
Mauritanians, 1.2 million Jordanians, and 1.1 that there is little overlap between the Arab
million Lebanese. Notably, 22 per cent of the LDCs, MICs and GCC countries (figure 4).

Figure 1. Countries’ share of the region’s wealthiest 10 per cent and poorest 46 per cent (% share)

 Share of region's poorest 46%
 20
 Share of region's wealthiest 10%

 15

 10

 5

 0

Source: Authors’ imputation based on Credit Suisse (2019) data. Note: Countries sorted by their share among the region’s wealthiest 10 per cent of adults
in a descending order.

10 Wealth Inequality and Closing the Poverty Gap in Arab Countries | Results
Figure 2. Share of countries’ adults among the Arab region’s wealthiest 10 per cent and poorest 46 per cent
(% of countries’ adult population)

 100

 90 Share of countries' adults among region's poorest 46%

 80 Share of countries' adults among region's wealthiest 10%

 70

 60

 50

 40

 30

 20

 10

 0

Source: Authors’ imputation based on Credit Suisse (2019) data.

Note: Countries sorted by the share of their adults among the region’s wealthiest 10 per cent of adults in descending order.

A regional divide exists separating countries respectively). These large population shares of
into high- or middle-income groups, and 14 countries jointly hold an equivalent stock of
a materially deprived group (ESCWA and ERF, wealth as the region’s 37 billionaires, who
2019). The poorest 110.4 million adults in the reside in a different group of countries. Wealth
region comprise 97 per cent of all adults in the density curves across the least-developed,
Sudan, three-quarters of Comorians, middle-income and GCC countries illustrate that
Djiboutians, Mauritanians, Syrians and Yemenis the population of the least-developed countries
(70, 78, 80, 82 and 73 per cent, respectively), half is bundled at the bottom of the region’s wealth
of Algerians, Egyptians and Moroccans (53, 42 distribution (figure 2). By contrast, middle-
and 48 per cent, respectively), and a quarter of income and GCC countries exhibit a more
Lebanese, Libyans, Iraqis, Omanis and dispersed distribution of wealth (Hlasny and
Tunisians (27, 23, 23, 25 and 37 per cent, AlAzzawi, 2018).

 Results | Wealth Inequality and Closing the Poverty Gap in Arab Countries 11
Figure 3. Income density curves: LDC and conflict, middle-income and GCC countries

Source: Authors’ imputation based on Credit Suisse (2019) data.

Notes: Density plots weighted by national population (Epanechnikov kernel, bandwidth 30), vertical line drawn at the forty-sixth percentile.

GCC countries include Bahrain, Kuwait, Oman, Qatar, Saudi Arabia and the United Arab Emirates. Middle-income countries include Algeria, Egypt,
Iraq, Jordan, Lebanon, Libya, Morocco and Tunisia. LDCs and conflict-affected countries include the Comoros, Djibouti, Mauritania, the Sudan, the
Syrian Arab Republic and Yemen.

Figure 4. Arab region’s Lorenz curve: LDCs and conflict-affected countries, MICs and GCC countries

Source: Authors’ imputation using log-normal (bottom 99.5 per cent) and Pareto (top 0.5 per cent) parametric distributions, based on Credit Suisse
(2019) data.
Notes: The vertical solid red line demarcates the bottom 46 per cent of the region’s adult population. The dashed blue line demarcates the top 10 per cent.

12 Wealth Inequality and Closing the Poverty Gap in Arab Countries | Results
Our estimates show that the Arab region’s nationally defined money metric poverty
population holds $5.8 trillion worth of wealth, lines (table 2). 9 Although countries set their
which is comparable to the Credit Suisse (2019) national poverty lines using different methods,
figure of $5.9 trillion. The top 10 per cent of for many Arab countries the value of the
population accounts for $4.4 trillion, or 75.8 per national poverty lines according to most recent
cent of this total wealth. The bottom 46 per cent national poverty estimates reported by the
of population has an average wealth of $975, World Bank are close to $3.5 per day in 2011
while the top 10 per cent holds on average PPP terms (the population weighted average of
$182,939. national poverty lines is $3.51). As shown in
 tables 2 and 3, the bulk of the poor population
In 2019, 101.4 million people (29.2 per cent of (nearly 84 million), reside in four countries,
the population of the 14 countries included in namely Egypt, the Sudan, the Syrian Arab
the assessment) lived in poverty using the Republic and Yemen.

Table 2. Projected headcount poverty rates (%) using national poverty lines

 Country 2018 2019 2020

 Mauritania 30.9 28.9 31.6

 Comoros 41.4 41.4 43.0

 Djibouti 20.7 19.6 20.1

 Algeria 3.1 3.1 4.0

 Egypt 32.7 29.2 31.9

 Iraq 18.0 17.9 23.2

 Jordan 17.7 19.6 23.2

 Lebanon 7.8 7.8 12.7

 Morocco 3.1 2.3 3.3

 State of Palestine 38.4 38.4 44.3

 Sudan 46.0 48.2 53.4

 Syrian Arab Republic 78.8 76.8 78.8

 Tunisia 12.7 12.7 15.4

 Yemen 73.6 73.7 79.0

 Region 30.0 29.2 32.4

Source: Authors’ estimates based on PovcalNet using the most recent reported national poverty lines and World Bank population projections from the
World Development Indicators.

 Results | Wealth Inequality and Closing the Poverty Gap in Arab Countries 13
Table 3. Number of poor based on the headcount poverty ratio using national poverty lines (Millions)

 Country 2018 2019 2020

 Mauritania 1.4 1.3 1.5
 Comoros 0.3 0.4 0.4
 Djibouti 0.2 0.2 0.2
 Algeria 1.3 1.3 1.7
 Egypt 32.1 29.3 32.6
 Iraq 6.9 7.0 9.3
 Jordan 1.8 2.0 2.4
 Lebanon 0.5 0.5 0.9
 Morocco 1.1 0.8 1.2
 State of Palestine 1.8 1.8 2.1
 Sudan 19.2 20.6 23.4
 Syrian Arab Republic 13.3 13.1 13.8
 Tunisia 1.5 1.5 1.8
 Yemen 21.0 21.5 23.5
 Region 102.4 101.4 114.9
Source: Authors’ estimates based on PovcalNet using most recent reported national poverty lines and World Bank population projections from the
World Development Indicators.

For the 13 Arab countries where poverty and forecasts for 2020 show that the poor
wealth data are available, the cost of closing the population will rise to 114.9 million, an increase
poverty gap in 2019 was approximately $38.6 of 13.5 million from 2019. The annual cost of
billion in current prices ($40.3 billion including closing the poverty gap also rises significantly,
the State of Palestine). Table 4 shows the reaching $45 billion in 2020 ($47 billion
distribution of this estimate among the 13 including the State of Palestine). This causes the
countries. As expected, the bulk of the resource proposed solidarity wealth tax rate to rise to 3.2
requirement is in Yemen ($9 billion), Egypt ($9 per cent for the group of 13 countries.
billion), the Syrian Arab Republic ($7.4 billion)
and the Sudan ($8.6 billion). In order of Among the seven Arab MICs, the total wealth
magnitude, these numbers imply that an annual of the top national decile in 2020 was
solidarity tax rate of 2.6 per cent on the wealth estimated at $1.3 trillion. Consequently, if there
of the region’s top decile group would cover the was perfect targeting of the poor in these
annual cost of closing the poverty gap in 2019. countries, an average solidarity tax of 1.2 per
However, for the group of middle-income cent in 2020 would suffice to close their
countries, the tax rate is only 0.9 per cent. Our poverty gap. The top wealth estimate for Arab

14 Wealth Inequality and Closing the Poverty Gap in Arab Countries | Results
LDCs and the Syrian Arab Republic is far less support is needed for the Arab LDCs and the
($66.8 billion) than Arab MICs, while the annual Syrian Arab Republic. There simply is not
poverty gap cost is relatively higher ($29.5 enough wealth at the top in these countries to
billion), making the proposal of a solidarity tax cover the cost of eradicating poverty, thus
more difficult to implement since it would raising the need for other fiscal and tax
amount to an average of 44.1 per cent of top- revenue generation policies and, more
decile wealth. For example, in the Sudan, the importantly, for foreign assistance. Arab
country with the lowest top-decile wealth per Governments are therefore called upon to
adult, and second highest cost of poverty establish a regional social solidarity fund to
reduction ($10.2 billion), the required solidarity ensure a rapid response, and to address
tax would reach 166.2 per cent of top-decile humanitarian needs and food shortages in
wealth in 2020. As such, emergency regional these most vulnerable countries.

Table 4. Countries’ cost of closing the poverty gap and wealth of the richest decile
 Mean Wealth tax Wealth tax
 wealth of Adults in Top on top on top
 top the top decile Top decile Cost of Cost of decile decile
 national national wealth in wealth in poverty gap poverty needed to needed to
 decile, decile, 2019 2020 in 2019 gap in 2020 cover cover
 2019 2019 (2019 (current (current (current poverty poverty
 Country (2019$) (‘000) $million) $million) $million) $million) gap, 2019 gap, 2020
 Algeria 60,342 2,698 162,821 149,795 362 468 0.2% 0.3%
 Egypt 99,771 5,831 581,755 535,214 8,952 10,075 1.5% 1.9%

 Iraq 93,705 1,979 185,423 170,590 1,735 2,431 0.9% 1.4%

 Jordan 163,214 551 89,964 82,766 816 1,031 0.9% 1.2%
 Lebanon 360,069 421 151,409 139,296 381 643 0.3% 0.5%

 Morocco 84,181 2,361 198,777 182,874 120 180 0.1% 0.1%
 Tunisia 86,227 811 69,939 64,344 584 752 0.8% 1.2%
 MICS 98,285 14,652 1,440,087 1,324,880 12,950 15,580 0.9% 1.2%
 Comoros 33,734 42 1,427 1,313 211 226 14.8% 17.2%
 Djibouti 18,685 58 1,089 1,002 49 50 4.5% 5.0%
 Mauritania 14,521 231 3,354 3,086 529 609 15.8% 19.7%
 Sudan 3,258 2,047 6,670 6,137 8,559 10,197 128.3% 166.2%
 Syrian Arab
 13,477 966 13,024 11,982 7,365 8,015 56.5% 66.9%
 Republic
 Yemen 32,270 1,458 47,050 43,286 8,951 10,391 19.0% 24.0%

 LDCs 15,117 4,803 72,615 66,806 25,665 29,489 35.3% 44.1%
 Total 77,752 19,456 1,512,702 1,391,686 38,615 45,069 2.6% 3.2%
Source: Authors’ estimates based on PovcalNet, using most recent reported national poverty lines and World Bank population projections from the
World Development Indicators.
Note: The State of Palestine, with the cost of closing the poverty gap at $1.7 billion in 2019 and $2 billion in 2020, is missing in the Credit Suisse (2019)
data, so the wealth tax cannot be computed.

 Results | Wealth Inequality and Closing the Poverty Gap in Arab Countries 15
III. Policy implications

The extreme concentration and polarization of solidarity wealth tax is of more practical
wealth in the Arab region revealed by these relevance to Arab MICs.
figures should serve as a wakeup call to
regional administrators. Household wealth – To resolve the current economic crisis and
and the lack thereof – has implications for maintain political stability in the Arab region,
various socioeconomic outcomes, including institutional reforms must be undertaken to
children’s health and education (ESCWA and redefine the social contract, and ensure social
ERF, 2019), labour force participation, and and economic inclusion (Kinninmont, 2015).
earnings (AlAzzawi and Hlasny, 2018; 2020). The Traditionally, even in the most fiscally
COVID-19 pandemic is expected to exacerbate redistributive Arab countries such as Qatar, oil
these figures. The economic slowdown caused revenues were used to fund welfare provision,
by COVID-19 is projected to negatively impact but the programmes were channelled through
wages and the flow of remittances. The distortionary tools, such as fuel and food
consequences of this crisis could be particularly subsidies (El-Katiri, Fattouh and Segal, 2011). In
severe on vulnerable groups, especially women the current economic climate, this is
and young adults, and those working in the unsustainable.
informal sector who have no access to social
protection schemes and unemployment The good news is that direct taxation in general
insurance. The challenge is further compounded is low in the majority of Arab countries,
by a lack of social protection floors in some suggesting significant untapped resources for
Arab countries (ESCWA, 2020b). These financing development expenditures. To date,
development challenges, along with ESCWA tax collection efforts have focused mainly on
findings on wealth inequality and the cost of raising regressive indirect taxes, such as the
poverty reduction, lead to a key policy value added tax, thus placing a higher burden
recommendation for a solidarity wealth tax to on the poor than on the rich (Abu-Ismail, Roy
support poverty reduction. and Ramos, 2012; ESCWA, 2018; ESCWA, 2019).

Nonetheless, it is important to recognize at the The share of taxes to GDP in Arab countries is
outset that this proposal is not suitable for all less than half of the European Union’s 40.3 per
Arab countries. The high cost of poverty cent (Eurostat, 2019). Moreover, wealth and
reduction in LDCs relative to their wealth level property taxes constitute a negligible share of
makes it a less feasible policy option. Given total tax revenue in the region, even in oil-poor
relatively limited fiscal space in these countries, countries (figure 5). Globally, taxes on property
external development assistance is form around 7 per cent of total tax revenue
indispensable to meet the rising cost of poverty (Adly, 2020). As reported by the most recent
reduction. 10 Consequently, the proposal for a data, the share of property tax to total revenue

 Policy implications | Wealth Inequality and Closing the Poverty Gap in Arab Countries 17
was less than 1 per cent in Egypt and Tunisia in and raises domestic consumption and
2016 and 2017, respectively. Morocco was an investment with immediate benefits for local
exception, with 5 per cent in 2017. small and medium employers.

A prominent feature of rentier States is that the The relatively low tax burden on the top wealth
bulk of their public revenues are generated from decile, much less the top 1 per cent, leaves
external sources such as oil-exports. However, much potential to improve equity by raising
as noted by Sarangi and Abu-Ismail (2018), taxes on property and wealth. The relevant
while this may make sense for resource-rich policy question is how to roll out a solidarity
countries, it does not explain why there is a wealth tax.
persistently low tax to GDP ratio in Arab
resource-poor countries, such as Egypt, Jordan Firstly, make tax systems more progressive, and
and the Syrian Arab Republic. The broad simplify administrative procedures for better tax
explanation is that most Arab middle-income compliance. Governments need to consider
countries avoid high taxation to not stir popular improving tax fairness by establishing more
demands for fiscal governance reforms, which equitable, progressive and transparent systems
would necessarily entail higher transparency, that clearly rationalize exemptions. Experience
and voice and accountability. However, such a from other countries shows that this is possible
trade-off is no longer economically feasible, if there is political will. Even among lower-
especially as the intra-regional spillovers from income countries, direct tax collection could
the oil-rich countries to oil-poor ones that may increase by 2 to 4 per cent of GDP (ESCWA,
have relieved budget pressure in the past 2018; ESCWA, 2019). More relevant to
(official development assistance, foreign direct addressing the increasing wealth concentration,
investment and worker remittances) a well-designed property tax can be an effective
significantly contracted for some countries after tool to raise revenue and improve equity.
2011, and their prospects for growth are Currently, these taxes are low and largely
minimal in the light of projected declines in oil evaded. Another important benefit of a well-
rents (Abu-Ismail and Nehme, 2019). designed property tax or wealth tax is that it
 would dampen rent-seeking and speculative
As a result of rentier growth patterns and lax activities, and thus channel funds to more
fiscal policies in the Arab region, the real estate productive investments.
sector attracts substantial investment, but
contributes little to tax revenues. The higher Secondly, poor tax records and complex tax
return on property assets from low taxation procedures complicate tax compliance and tax-
gives rise to chronic balance-of-payments fairness analysis. Improving tax and customs
deficits, fiscal crises, especially in non-oil administration, simplifying coding and
countries, and increasing inequality in income regulation, and investing in technology to
and wealth distribution. In contrast, a solidarity improve transparency can enhance compliance
wealth tax is likely to have a positive impact on and increase the potential tax base. This would
economic growth and decent work in the region, require upfront investment in administrative
as it repatriates some of the offshore wealth infrastructure, but better tax administration will
back home, empowers the lower middle class, support a broader culture of tax compliance and

18 Wealth Inequality and Closing the Poverty Gap in Arab Countries | Policy implications
greater revenues. One way to improve the complexity of the tax system, and raise
transparency and accountability is requesting associated administrative costs in its
that all citizens and residents file income tax, implementation. If administrative capacity is
even if they are not actually required to pay tax low, as in many Arab LDCs, a single rate may be
– an approach encouraged recently in many the best option for policymakers. Countries can
developing countries, such as India (Sarangi also collect tax rents from real-estate
and Abu-Ismail, 2018). Since these tax forms investment. In Egypt, real estate property is
would include questions on transfers and rents subject to a 10 per cent rate on the annual rental
received from properties and other wealth value, with exemptions for properties with a low
sources, they would also constitute an rental value.
important resource to effectively design and
implement an appropriate property tax policy Fourthly, and perhaps more importantly,
that takes into account the need to raise governance reforms, particularly in areas
revenues against the ability of taxpayers to pay. related to government and institutional
A mandatory reporting of wealth and income effectiveness, and increased accountability and
sources would also assist Arab countries in transparency are a key priority and prerequisite
controlling tax evasion, tax avoidance and illicit to achieving the desired objective behind the
financial flows. In 2014 and 2015, illicit outflows imposition of a solidarity wealth tax. For
from the Arab region outstripped the combined example, minimizing the inclusion and
inflows of foreign direct investment and official exclusion errors related to any expanded
development assistance (ESCWA 2017). programme of social protection, such as
 poverty targeting, requires well designed and
Thirdly, select an appropriate tax rate. A regular programme monitoring and evaluation
variable tax rate can be useful to mitigate land over the implementation period. Such an
and real-estate speculation, which is rampant in outcome necessarily implies data gathering,
some Arab countries. For example, higher tax transparency in sharing results and proper
rates on vacant or underdeveloped land can accountability mechanisms. Public trust to
reduce short-term speculative investment support the implementation of a solidarity
(Collier and others, 2017). However, introducing wealth tax depends on the implementation of
variable tax rates can, like exemptions, increase these reforms.

 Policy implications | Wealth Inequality and Closing the Poverty Gap in Arab Countries 19
Figure 5. Composition of tax revenue in selected oil-poor countries (% share)

 100.0 2.5 2.6 0.0
 5.1 8.3
 90.0 7.2
 8.0
 80.0 10.9 12.0
 70.0
 39.4 35.3 42.7 41.8 37.3
 60.0 43.4 41.8
 48.0 42.8
 66.6 70.2
 69.6
 50.0 34.9

 40.0
 36.7
 30.0 35.9
 20.0

 10.0 20.4 20.5 21.9 25.3
 17.5 19.3
 9.6 12.1 11.0
 5.1 3.8 4.5 3.8 6.2 6.7
 0.0
 2010 2014 2018 2010 2014 2018 2010 2014 2018 2010 2014 2016 2010 2014 2018
 Egypt Jordan Lebanon Morocco Tunisia

 Individual income Corporate income Goods and services Trade Property others

Source: ESCWA and ERF, 2019.

Note: Property taxes were not available for Morocco and Tunisia, and are subsumed in other taxes.

20 Wealth Inequality and Closing the Poverty Gap in Arab Countries | Policy implications
IV. Conclusions

The present study relies on data from Credit that the current GDP per capita growth forecasts
Suisse, Forbes, the United Nations Department accurately reflect changes in the
of Economic and Social Affairs, and the World macroeconomy. Given the high volatility of
Bank – and from household budget surveys – to economic growth in 2020 and uncertainty
estimate the distribution of private wealth and surrounding the potential impact of COVID-19,
the depth of poverty in the region, and to assess current forecasts should be considered with
the prospect of using top wealth to close the caution. Secondly, these forecasts are an
region’s poverty gap. This exercise and its adequate reflection of the change in mean
results have a number of limitations. The data consumption at the household level, which is a
providers readily acknowledge that data quality relatively strong assumption given that in many
is poor in some Arab countries. Combining the countries one may expect the impact to be more
data across data sources, and across countries, amplified at the household level.
may therefore not withstand the test of
reliability. Illicit financing may also be rife in Another major limitation is that no one really
regional economies, as the Panama and has an idea how the COVID-19 crisis will affect
Offshore leaks indicate, given that Arab inequality. Although the COVID-19 crisis is
countries remain disconnected from global expected to affect all income groups, the lower
investment markets. earning group is expected to be more directly
 and significantly subjected to consumption
With regard to estimating the cost of closing the losses, because the heads of low-income
poverty gap, evidence about the short- and households are more likely to be employed in
long-term implications of the COVID-19 the informal sector, which is strongly affected
pandemic is being continuously revised. The by the current recession. Low-earning
present paper strives to incorporate the most households are less able to rely on their savings
updated projections, but precise results may and wealth to smooth consumption during the
change across successive versions of the study. current crisis, relative to higher income
For example, an earlier ESCWA brief, based on households. Consequently, the present paper
the more optimistic United Nations and World conservatively assumes that the current crisis
Bank growth projections in March, suggested a will lead to a mild increase in the population
significantly lower estimate of the regional weighted Gini index, reaching 33.9 per cent in
poverty impact (ESCWA, 2020a). 2020 for the 14 Arab countries being assessed.

ESCWA acknowledges that there remains much Based on recent capital market price data, the
speculation on the real economic impact of the estimated mean wealth and distribution in 2019
pandemic, even for 2020. However, two is expected to change significantly as a result of
restrictive assumptions can be made. Firstly, the COVID-19. Although the assessment factors

 Conclusions | Wealth Inequality and Closing the Poverty Gap in Arab Countries 21
this in by adjusting the wealth level of the top Notwithstanding these limitations related to
decile in 2020, the high volatility of capital data sources and methodology, the findings
market prices witnessed recently may also lead offer important insights for further regional and
to significant changes in the estimated solidarity national policy dialogue. The fact that that the
tax rate over the next few months. region’s 37 billionaires hold real wealth
 equivalent to that of the region’s poorest half of
Moreover, for various reasons related to the population should by itself be a wake-up call
rampant tax evasion and wealth underreporting for policy action, regardless of COVID-19. In
in the region, it is probable that the assessment order of magnitude, the estimates are
underestimates the top wealth in many Arab encouraging. The introduction of a solidarity
countries. A case in point is the group of LDCs wealth tax of 1.2 per cent on the wealthiest 10
and conflict-affected countries included in our per cent is all that is required to cover the
analysis, such as the Sudan and the Syrian Arab poverty gap in middle-income countries, even
Republic. Wealth distribution is unlikely to be when taking into account the potential impact of
represented well in these countries, given that COVID-19 on poverty, income and wealth
the risk of violence or international sanctions distribution.
prevent their citizens from disclosing their
wealth. For this reason, these is a particular Lastly, fiscal reforms are never a purely
need for better tax data collection, and Arab technical matter. Their effective implementation
countries should consider implementing is contingent on foundations of solid
mandatory annual tax reporting, as is the case governance, which should be accompanied by
in many developed and developing countries. wide social dialogue. It is easy to introduce a
This would also have significant impact on wealth tax, but its ultimate success depends on
enhancing national efforts to achieve other the strength of existing governance systems,
development objectives, such as reducing including trust in Government, institutional
informality and achieving better targeting of the effectiveness and sound accountability
poor and vulnerable groups. frameworks.

22 Wealth Inequality and Closing the Poverty Gap in Arab Countries | Conclusion
Bibliography

Abu-Ismail, Khalid, Gihan Abou Taleb, and Racha Ramadan (2012). Rethinking Global Poverty Measurement. Working Paper, No. 93.
 Brasilia: International Policy Centre for Inclusive Growth, United Nations Development Programme.

Abu-Ismail, Khalid, and Manuella Nehme (2019). Falling rents should make way for institutional reforms in Arab states. Economic
 Research Forum Blogpost, 7 May. Available at https://theforum.erf.org.eg/2019/05/07/falling-rents-make-way-institutional-
 reforms-arab-states/.

Abu-Ismail, Khalid, and Niranjan Sarangi (2013). A New Approach to Measuring the Middle Class: Egypt. E/ESCWA/EDGD/2013/WP.2.
 Beirut: United Nations Economic and Social Commission for Wester Asia.

Abu-Ismail, Khalid, Rathin Roy, and Raquel Almeida Ramos (2012). Is there fiscal space for financing an Arab development
 transformation? Working paper No. 88 (February). Brasilia: International Policy Centre for Inclusive Growth, United Nations
 Development Programme.

Abu-Ismail, Khalid, and others (2005). Investment Requirements and Macroeconomic Framework for Reducing Income Poverty to
 half by 2015 in Yemen. United Nations Development Program.

Adly, Amr (2020). Property taxes are the Arab world’s low hanging fruit, Bloomberg Opinion, 22 January,
 www.bloomberg.com/opinion/articles/2020-01-22/property-taxes-are-the-arab-world-s-low-hanging-fruit.

Aitchison, John, and James A.C. Brown (1957). The Lognormal Distribution. Cambridge: Cambridge University Press.

AlAzzawi, Shireen, and Vladimir Hlasny (2018). Household asset wealth and female labor supply in MENA. The Quarterly Review of
 Economics and Finance, vol. 73.

__________ (2020). Vulnerable employment in Egypt, Jordan and Tunisia: A perpetuation of misery. UN University Wider Working
 Paper.

Alvaredo, Facundo, Lydia Assouad, and Thomas Piketty (2019). Measuring inequality in the Middle East 1990-2016: The world’s most
 unequal region? Review of Income and Wealth, vol. 65, No. 4.

Alvaredo, Facundo, and Thomas Piketty (2014). Measuring top incomes and inequality in the Middle East: Data limitations and
 illustration with the case of Egypt. Economic Research Forum Working Paper, No. 832.

Andersen, Jørgen Juel, and others (2017). Petro Rents, Political Institutions, and Hidden Wealth: Evidence from Offshore Bank
 Accounts. Journal of the European Economic Association, vol. 15, No. 4.

Assouad, Lydia (2017). Rethinking the Lebanese economic miracle: The extreme concentration of income and wealth in Lebanon
 2005-2014. WID Working Paper Series, No. 2017/13. World Inequality Database.

Brzezinski, Michal (2014). Do wealth distributions follow power laws? Evidence from ‘rich lists’. Physica A: Statistical Mechanics and
 its Applications, vol. 406 (July).

Chakraborti, Anirban, and Marco Patriarca (2008). Gamma-distribution and wealth inequality. Pramana Journal of Physics, vol. 71,
 No. 2.

 Bibliography | Wealth Inequality and Closing the Poverty Gap in Arab Countries 23
You can also read