Regional Waste ManageMent - North East Waste - Published on
←
→
Page content transcription
If your browser does not render page correctly, please read the page content below
N O R T H E A S T WA S T E - R E G I O N A L WA S T E M A N A G E M E N T S T R AT E G Y | 1

Regional Waste Management
                 Strategy
           North East Waste                                          2013-21

                                                                                         Published on
                                                                                          June 2014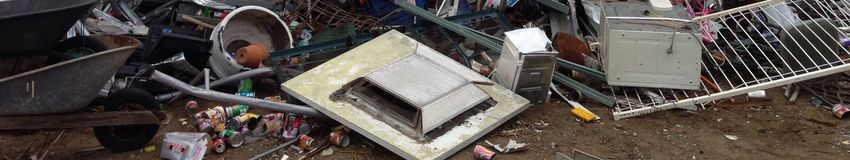
Contents
                                N O R T H E A S T WA S T E - R E G I O N A L WA S T E M A N A G E M E N T S T R AT E G Y | 2

           FOREWORD       3
           1 INTRODUCTION           4
           1.1 Introduction to Strategy       4
           1.2 Key Drivers and Policy Context           4
           2 BACKGROUND         6
           2.1 Regional Population and Demographic Profile           7
           2.2 Waste and Resource Recovery collection and processing systems               9
           2.3 Waste and resource recovery tonnage data           10
           2.4 Waste Composition         12
           2.5 Performance Assessment         15
           2.6 Waste and resource recovery collection, processing and disposal contracts             17
           2.7 NE Waste Council Waste & Resource Recovery Infrastructure             18
           2.8 Waste Forecasting and Projections             19
           2.9 Review of programs, initiatives and community expectations             20
           2.10 Summary       22
           3 STRATEGIC DIRECTION              23
           3.1 Vision For The Strategy        23
           3.2 Key Result Areas and Objectives          23
           3.3 Member Council Strategy             28
           4 IMPLEMENTATION         29
           4.1 Action Plan          30
           5 MONITORING AND EVALUATION                  33
           APPENDIX 1     Supporting Tables             34
           APPENDIX 2        NE Waste Regional Report Summaries             42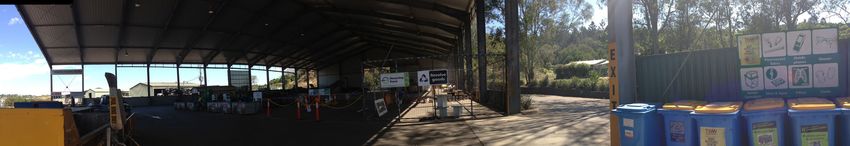
N O R T H E A S T WA S T E - R E G I O N A L WA S T E M A N A G E M E N T S T R AT E G Y | 3

                                                              FOREWORD
                                                              North East Waste is a voluntary regional waste group, formed in
                                                              1997 and comprising Ballina, Byron, Clarence Valley, Kyogle, Lismore,
                                                              Richmond Valley and Tweed Councils. This regional Strategy was
                                                              developed in collaboration with its member Councils and aims to set
                                                              the strategic direction of waste management in the region through
                                                              a coordinated and collaborative approach that optimises our skills
                                                              and resource sharing opportunities. It is driven by political, economic
                                                              and environmental imperatives including the requirements of the
                                                              State Government initiatives and strategies, the need to protect the
                                                                                                                                                   At present the region faces a number of challenges in waste
                                                              environment and the economic benefits of sharing resources.
                                                                                                                                                   management that this strategy hopes to address. They include

                                                                                                                                                     ▶▶ the predicted pressure from increasing population growth
                                                                                                                                                          and its implications for waste generation, landfill availability
                                                                 Our vision is to achieve more sustainable                                                and service provision;
                                                                 waste management and better resource                                                ▶▶ the significant quantities of potentially recyclable materials,
                                                                                                                                                          including organics, currently present in the residual waste
The North East Waste region covers almost 21,000 sq kms          recovery in the NE Waste region through                                                  stream;
of land area and has a population of almost 300,000. The         a proactive, collaborative approach                                                 ▶▶ gaps in infrastructure and services required to maximise
                                                                                                                                                          resource recovery across the region;
seven member Councils within this region are Ballina,            with our regional members Councils,
                                                                                                                                                     ▶▶ a lack of uniform data and detail of the commercial sector’s
Byron, Clarence Valley, Kyogle, Lismore, Richmond Valley         the NSW EPA and our community.                                                           waste generation and resource recovery; and

and Tweed Shire. There are 9 landfill sites, two recycling                                                                                           ▶▶ the need to ensure regional cooperation while maintaing
                                                                                                                                                          equity and open communication between Councils.
facilities, three organics processing facilities and eleven   Through this Strategy NE Waste aims to fulfil our objectives and meet
transfer stations situated throughout the region.             targets by:
                                                                                                                                                   In order to address these challenges this Strategy includes a
                                                                ▶▶ Delivering targeted and effective projects that engage and                      uniform waste management system, enhanced services and
                                                                    build capacity in our communities to achieve improved waste                    drop off facilities and improved infrastructure, supported by
                                                                    minimisation and management outcomes.
                                                                                                                                                   a comprehensive education and communication program to
                                                                ▶▶ Creating strong Council partnerships that allow collaboration                   maximise business and community engagement.
                                                                    and optimize resource sharing and funding opportunities.
                                                                ▶▶ Involving the community through social enterprises and the                      A full range of delivery mechanisms have been developed
                                                                    development of markets in recovered resources.                                 for the new strategy and final options for implementation of
                                                                ▶▶ Adhering   to the principles of sustainability, equity and                      objectives have been assessed and prioritised into an action plan.
                                                                    continuous improvement.                                                        It is intended that these actions and the Regional Waste Strategy
                                                                ▶▶ Communicating and sharing our knowledge while striving for                      objectives be adjusted annually as their progress against the key
                                                                    leadership and innovation in waste.                                            performance indicators are evaluated.

                                                                       “This strategy has been supported by the NSW Environment Protection Authority (EPA) with funding from the waste levy.”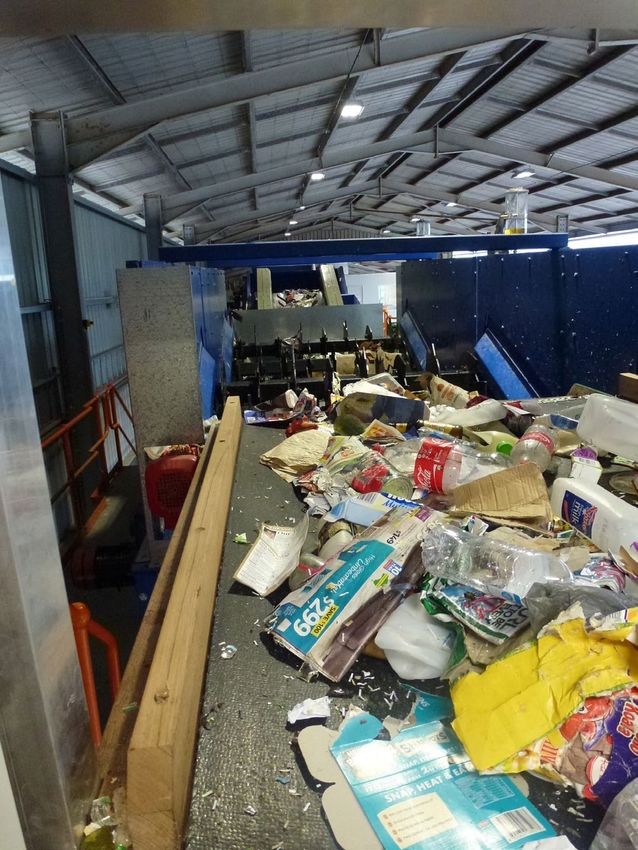
1
                                                                                                                                           N O R T H E A S T WA S T E - R E G I O N A L WA S T E M A N A G E M E N T S T R AT E G Y | 4

                                                                                                               where improved resource sharing across the region could occur. While some efficiency in regional waste
                                                                                                               management was acknowledged, there was further potential for collaboration, especially as several mem-
                                                                                                               ber councils were undertaking new waste infrastructure development projects. At the time 2 current mem-
                                                                                                               bers of North East Waste were not member Councils and the initial Strategy for the region was developed in
                                                                                                               consultation with member and non-member Councils. This Strategy focused on 5 key results areas: Manag-
                                                                                                               ing Residual Waste; Increasing Resource Recovery; Improving Kerbside Collection; Community Engagement
                                                                                                               and Education and Reducing Emissions.

INTRODUCTION                                                                                                   Three major studies to guide the management of residual waste and landfill gas emissions were undertak-
                                                                                                               en with the remaining objectives targeted through the existing programs of NE Waste and the combined
                                                                                                               efforts of the 7 member Councils. A summary of our key findings and progress against the original strategy
                                                                                                               objectives can be found in Appendix 2.

                                                                                                               A number of additional studies, consultations and appraisals have recently been completed or are in prog-
   1.1 Introduction to Strategy                                                                                ress. As this Strategy takes the form of a working document, subject to regular review, these new areas of
                                                                                                               research will continue to update and contribute to its planning horizon.

This Regional Waste Management Strategy was developed in consultation with North East Waste member
Councils. The Strategy draws on a number of studies undertaken by NE Waste and its previous regional
                                                                                                                  1.2 Key Drivers and Policy Context
waste strategy and is informed by current Regional, State and National planning instruments and initiatives.
The key documents and programs underpinning this Strategy are the:

       ▶▶ NSW 2021: A Plan to make NSW number one (2012)                                                       Several key drivers and trends have been identified that support regional cooperation and the need for a
       ▶▶ Regional Waste Management Strategy Working Document (NOROC Councils RWMG 2011-14)                    regional waste strategy.

       ▶▶ NOROC Review of Resource Sharing Opportunities - Waste Management, Hyder Consulting                  The key political drivers include:
          February 2011
       ▶▶ Regional Waste Disposal Strategy for Northern Rivers 2012, Hyder Consulting                                 ▶▶ The encouragement of local councils to develop regional waste strategies under NSW 2021
       ▶▶ North East Waste AWT Situational Analysis August 2013                                                       ▶▶ The requirement for a regional waste strategy to apply for funding under the Waste Less, Recy-
                                                                                                                          cle More initiative
       ▶▶ NSW Waste Avoidance and Resource Recovery (WARR) Strategy 2007 and WARR Implementa-
          tion Strategy 2012-15
                                                                                                                      ▶▶ The need to fulfil diversion targets set under the Draft WARR Strategy 2013-21
       ▶▶ The National Waste Policy: Less Waste, More Resources 2011                                                  ▶▶ The recognition at a number of political levels and jurisdictions that there is a need and oppor-
                                                                                                                          tunity for regional cooperation

More recently the Draft WARR Strategy 2013-21 and Waste Less Recycle More initiative have guided its
development.

Investigations for this strategy began in 2010 through the review of existing arrangements to identify areas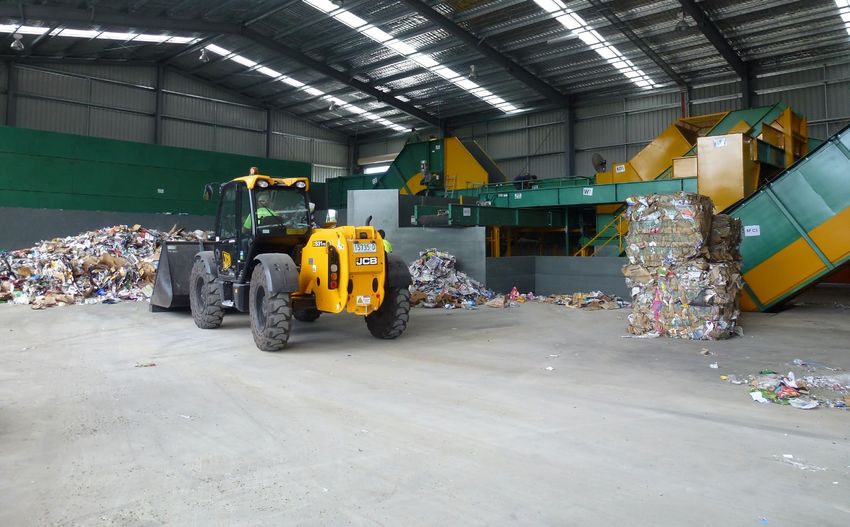
N O R T H E A S T WA S T E - R E G I O N A L WA S T E M A N A G E M E N T S T R AT E G Y | 5

Socio-Economic drivers include:                                            Legislative Framework

       ▶▶ The potential to involve the community, provide employ-             Several legislative instruments guide waste management in NSW. They define waste for regulatory
          ment and develop markets through social enterprises in
                                                                              purposes, establish licencing and levy requirements and set targets and strategic direction. At present a
          waste.
                                                                              number are under review or in draft form.
       ▶▶ The imperative of resource sharing due to diminishing landfill
          space                                                               Figure 1: Legislative, regulatory and planning Instruments guiding waste in NSW
       ▶▶ Population growth and seasonal fluctuations within the re-
          gion impacting on existing waste systems and infrastructure
       ▶▶ The potential to increase funding opportunities under a re-
          gional cooperation model and for local councils to realise the                                                                                                                  Draft WARR Strategy

                                                                                Laws, Regulations and Plans
          benefits of the $465.7 million funding opportunities available                                                                                                                        2013-21
          through the Waste Less Recycle More initiative
                                                                                                              Waste Avoidence and Resource Recovery Act 2001
       ▶▶ The possibility of reducing costs and increasing economies of                                                                                                                 Waste Less Recycle More
          scale through cooperation and joint ventures
                                                                                                                                                                                               2014-17
       ▶▶ Building regional capacity through knowledge exchange
                                                                                                                  Protection of the Environment Operations
                                                                                                                            (POEO) Act 2001                                             POEO Waste Regulations
Environmental drivers include:                                                                                                                                                                 2005

       ▶▶ Improving resource efficiency through collaborative efforts                                                    Clean Energy Act 2012

       ▶▶ Improving the environmental performance of infrastructure
       ▶▶ Protecting the environment and improving sustainability                                                             NSW 2021                                                  Regional Waste Strategies
          through education and behaviour change
       ▶▶ Improving waste management to help mitigate the impact of
          human induced climate change

                                                                           The structure of this plan follows the guidelines provided by the NSW EPA and uses the Key Results areas
                                                                           identified in the Draft WARR Strategy to guide our choice of outcomes and develop our targets. Under this
                                                                           umbrella consultations and analysis have assisted us in redefining our strategic objectives, consolidating
                                                                           our previous strategy. A series of workshops have been held with key waste management stakeholders and
                                                                           additional research has been undertaken to support NE Waste in further refining our objectives and deter-
                                                                           mining the mechanisms for delivery of this Strategy.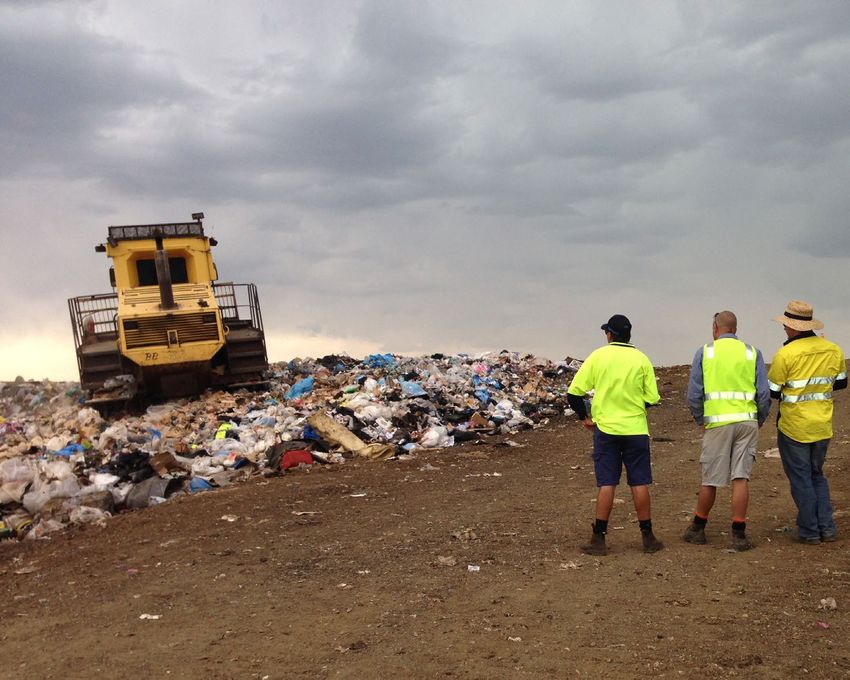
N O R T H E A S T WA S T E - R E G I O N A L WA S T E M A N A G E M E N T S T R AT E G Y | 6

2
                                                                                                      Figure 2: Our region

                                                                                                                                                           National trends indicate that while diversion of
                                                                                                                                                           recycling and organics has improved, the over-
                                                                                                                                                           all volume of waste generated has increased,
                                                                                                                                                           making landfill capacity a pressing issue. Total

BACKGROUND
                                                                                                                                                           available landfill capacity across the region is
                                                                                                                                                           currently at 4 million cubic meters, with simi-
                                                                                                                                                           lar proposed additional void space available.
                                                                                                                                                           Three Council landfills are currently near capac-
The North East Waste region covers almost 21,000 sq kms of land area and has a population                                                                  ity and either have or are awaiting approval to
of 287,809. The seven member Councils within this region are Ballina, Byron, Clarence Valley,                                                              develop new landfills. One Council landfill has
Kyogle, Lismore, Richmond Valley and Tweed. Membership of the Voluntary Regional Waste                                                                     closed due to constrained capacity and expan-
Group, North East Waste, has been reasonably consistent since its beginnings in 1997, and to-                                                              sion issues and is currently transferring residu-
day all local Councils are members. NEW is governed by a Memorandum of Agreement, with                                                                     al waste to South-East Queensland. Two of the
each Council having a vote and delegate at bi-monthly meetings. It is funded by the NSW EPA,                                                               Councils nearing capacity are also utilising this
contributions from Councils and grant funding. A Coordinator manages the administration of                                                                 option while their new landfills are in develop-
the group, the budget and its projects. Additional coordinators manage education, business                                                                 ment. There is also the potential to utilise other
and specialised projects, subject to need.                                                                                                                 existing landfills in the region if the SEQ option
                                                                                                                                                           ceases to be viable. Table 1 presents details of
Waste infrastructure in the region has changed over time and there are now 9 landfill sites,                                                               landfill capacity across the region.
three material recycling facilities (MRF), three organics processing facilities and eleven transfer
                                                                                                                                                           The feasibility of developing a regional landfill
stations situated throughout the region. (See figure 2)
                                                                                                                                                           facility at Richmond Valley Council’s Bora Ridge
                                                                                                                                                           site has recently been reviewed. A summary
Each Council has its own arrangements in place for waste collection, by contract with a private
                                                                                                                                                           of the feasibility report (Hyder, March 2014) is
operator or by an in-house Day Labour service. All Councils have a kerbside recycling service
                                                                                                                                                           available in Appendix 2. The review concludes
for residents and five Councils provide a garden organics or combined food and garden or-
                                                                                                                                                           that as most member councils either already
ganics collection. Recycling is available to commercial premises in all seven Council areas and
                                                                                                                                                           have a long-term landfill solution, or are work-
organics collection for business is available in four.
                                                                                                                                                           ing to secure one, a regional landfill project
                                                                                                                                                           should not be progressed at this time. Howev-
To more accurately reflect the regional changes in waste generation and resource recovery that
                                                                                                                                                           er it is recommended that the site be retained
have occurred more recently, Council waste data for 12/13 has also been utilised in this section
                                                                                                                                                           and the proposal revisited as a future long term
of the strategy. However to ensure that comparisons can be made across the State all addition-
                                                                                                                                                           waste management option for the region.
al 11/12 data is included in the appendices for reference.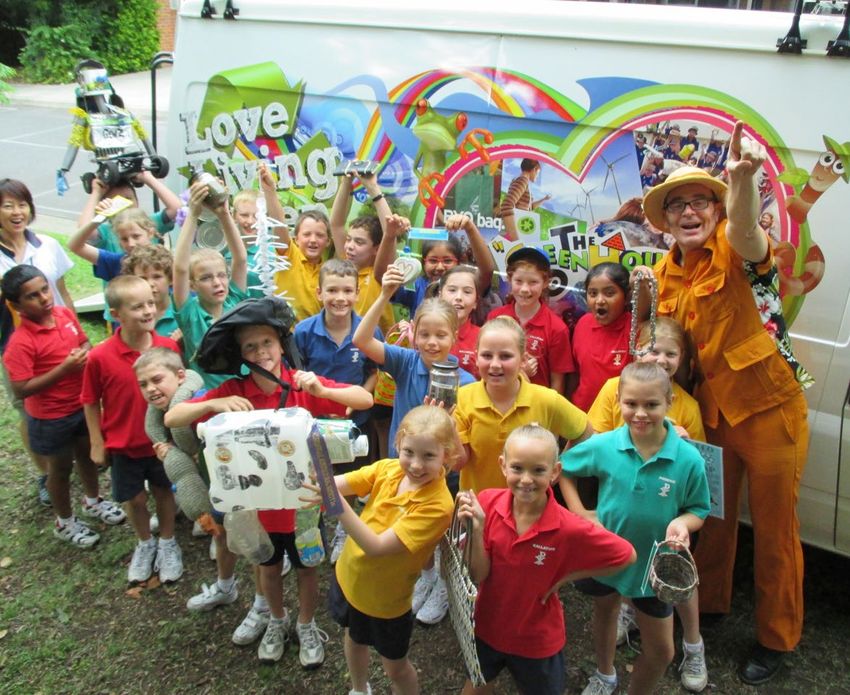
N O R T H E A S T WA S T E - R E G I O N A L WA S T E M A N A G E M E N T S T R AT E G Y | 7

Table
                    Landfill capacity and life for the NEW Councils

1            Available Landfill
                      capacity
                                        Ballina

                                       200,000
                                       (closed)
                                                              Byron

                                                          Near capacity
                                                                                   Clarence

                                                                                  3,000,000
                                                                                                           Kyogle

                                                                                                           385,000
                                                                                                                       Lismore

                                                                                                                     Near capacity
                                                                                                                                             Richmond

                                                                                                                                              473,000
                                                                                                                                              @ 2011
                                                                                                                                                                         Tweed

                                                                                                                                                                 Near capacity (25yrs
                                                                                                                                                                   avail for inert)
                                                                                                                                                                                                 Total Capacity

                                                                                                                                                                                                   4,058,000

         Proposed additional                                                                                                                                           750,000 &
                                         Nil-                460,000                 N/A                    N/A       1,000,000                 N/A                                                3,910,000
                    capacity                                                                                                                                           1,800,000

           Landfill Life (years)          3                   15-20                   60                     70           50                   30-40                     20-25                         N/A

           2.1 Regional Population and Demographic
           Profile

        The North East Waste region has a population density of approximately 14 people per square
        kilometre. Compared to many other regional and rural areas of NSW this is relatively high. Table
        2 presents demographic profile data sourced from the Australian Bureau of Statistics’ (ABS) Pop-
        ulation of Census and Housing 2011 and from local government EPA data returns 11/12.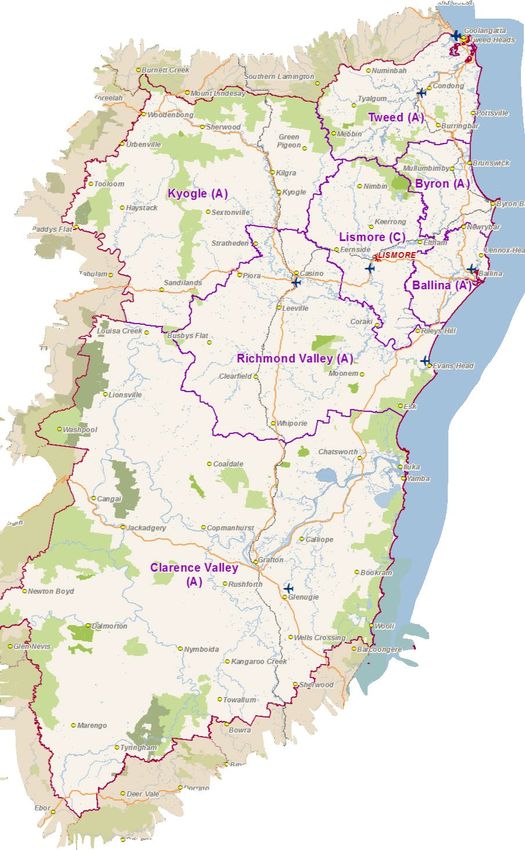
N O R T H E A S T WA S T E - R E G I O N A L WA S T E M A N A G E M E N T S T R AT E G Y | 8

Table              Population and Demographic Profile

2
                                                Population a            Projected Population    Total Number of Individual        % Single Unit Dwellings         % Multi Unit Dwellings (MUDs)
                        Council Name                                                                                                                                                                     *Socio – Economic Index a
                                                 (2011/12)                     2021 a          Households in LGA b (2011/12)        (SUDs) b (2011/12)                     b
                                                                                                                                                                             (2011/12)

                       Ballina Shire              40,753                      43,900                     16,691                            75%                                 25%                                    980

                        Byron Shire               30,825                      31,700                     13,717                            84%                                 16%                                    979

                    Clarence Valley               51,252                      52,900                     23,231                            91%                                  9%                                    907

                       Kyogle Shire               9,537                       9,700                       4,033                            99%                                  1%                                    902

                       Lismore City               44,282                      45,500                     17,947                            82%                                 18%                                    946

                   Richmond Valley                22,697                      24,100                      7,078                           100%                                  0%                                    888

                        Tweed Shire               88,463                      98,200                     37,717                            60%                                 40%                                    949

                             Region              287,809                     306,000                    120,414                            85%                                 15%                                    936

         Source: a) ABS 2012 - b) Local Government Data Return 2011-2012

        *The Index of Relative Socio-economic advantage and disadvantage (SEIFA) for the
        region summarises information about the economic and social conditions of people and
        households within an area. A low score indicates relatively greater disadvantage and a lack
        of advantage in general. A number of LGAs in the region are particularly disadvantaged,
        with the Richmond Valley, Kyogle and Clarence Valley being amongst the 20 lowest rankings                                         88,993         90,090                                 93,700
                                                                                                                                                                                                             98,200
                                                                                                                  84,325       86,833                                 88,500       90,114                                   Tweed
        in NSW.

                                                                                                                                                                                                                            Richmond Valley
                                                                                                                               22,672     22,934         23,115                                 23,300       24,100
                                                                                                                  22,471                                              22,700       22,697
                                                                                                                                                                                                                            Lismore
        Figure 3: Historical and Projected Regional Population Change                                             44,668       44,993     45,645         45,917
                                                                                                                                                                      44,300       44,637       44,900       45,500

                                                                                                                                           9,824          9,877                                  9,600        9,700
        Population growth since 2007 has fluctuated with an overall increase of approximately 2                    9,686       9,683                                   9,500         9,537                                  Kyogle
        percent. Population projections from the Australian Bureau of Statistics indicate that an                                         52,054         52,592                                              52,900
                                                                                                                  50,596       51,007                                 51,300       51,043       51,600
        approximate increase of 6% is anticipated by 2021. The most significant growth areas are                                                                                                                            Clarence Valley
        estimated to be Tweed Shire at 9.8% and Ballina at 7%.
                                                                                                                  30,866       31,503     32,126         32,378       30,800       30,825       31,200       31,700
                                                                                                                                                                                                                            Byron

                                                                                                                  40,932       41,677     42,432         42,708       40,800       41,335       42,600       43,900
                                                                                                                                                                                                                            Ballina
N O R T H E A S T WA S T E - R E G I O N A L WA S T E M A N A G E M E N T S T R AT E G Y | 9

   2.2 Waste and Resource Recovery collection
   and processing systems

Kerbside Collection                                                                                                                                                                      All Councils operate a fortnightly comingled re-
                                                                                                                                                                                         cycling service for dry recycling, except for Kyo-
                                                                                                                                                                                         gle Shire which has a weekly split bin (waste/re-
The 7 member Councils of North East Waste are progressing towards a consistent 3 bin                                                                                                     cycling) collection. Four Councils offer the larger
system for the kerbside collection of household waste.                                                                                                                                   360 litre recycling bin to encourage improved
                                                                                                                                                                              diversion, with this now being the standard recycle bin op-
                                                                                                                                                                              tion at Clarence Valley.

                                                                                                                                                                              An organic collection is available across 5 councils. Ballina,
                                                                                                                                                                              Clarence Valley and Lismore provide a weekly combined
          Table            Council’s domestic waste and recycling collection systems
                                                                                                                                                                              food and garden organic (FOGO) service. Those Councils

           3
                                               Residual Waste               Recycling                     Organics                                                            have also implemented a reduced, fortnightly collection
                                               (red lid)                    (yellow)                      (lime green lid)                                                    schedule for residual waste, to further encourage the di-
                                   Council
                                                                                                                                                                              version of food and garden waste via the weekly organic
                                                                                       Bin Size (litres) & Pick Up                                                            service. Some Councils also provide as standard, a smaller
                                                                                                                                                                              140 litre bin for the collection of residual waste.
                               Ballina Shire   240 L x fortnight            240∞/360 L x fortnight        240 L Food & garden organics x wkly
                                                                                                                                                                              Richmond Valley and Tweed Shire Councils currently pro-
                                Byron Shire    80/140∞/240 L x wkly         240 L x fortnight             N/A                                                                 vide a fortnightly garden organic only service but are
                            Clarence Valley    240 L x fortnight            360 L x fortnight             240 L Food & garden organics x wkly                                 progressing towards the introduction of a weekly FOGO
                                                                                                                                                                              service in 2014/15. Byron Shire Council is preparing to in-
                               Kyogle Shire    120 L split bin x wkly       120 split bin x wkly          N/A                                                                 troduce its first organic (FOGO) service to urban single unit
                               Lismore City    140∞/240 L x fortnight       240∞/360 L x fortnight        240 L Food & garden organics x wkly                                 dwellings in 2015.

                           Richmond Valley     240 L x wkly                 240 L x fortnight             240 L Garden organics only x fortnightly
                                                                                                                                                                              All North East Waste Councils, with the exception of Kyogle
                               Tweed Shire     80/140∞/240 L x wkly         240∞/360 L x fortnight        240 L Garden organics only x fortnightly #                          Council which is negotiation with its waste contractor to
                                                                                                                                                                              move to a 2 or 3 bin system in the future, have adopted a
                       ∞Standard bin size provided                                                                           # Optional user pays service                     3 bin system which complies with the Australian Standard
                                                                                                                                                                              (AS 4123.7-2006) bin lid colour requirements.
N O R T H E A S T WA S T E - R E G I O N A L WA S T E M A N A G E M E N T S T R AT E G Y | 1 0
Drop Off Services 2.3 Waste and resource recovery tonnage data
Each Council provides drop off facilities located at landfill and transfer stations
for residents to self haul waste for recovery or disposal. Gate fees apply at all 2.3.1 Total Domestic Waste
Councils for the drop off of unsorted residual waste for disposal to landfill and for
In the NE Waste region there has been a reduction in total domestic waste generation from kerbside, clean
garden organics. Most dry recyclables can be dropped off free at Council facilities,
up and drop off since 2007. During the same period the population has increased by around 2 percent indi-
except Ballina where a gate fee applies. The availability of suitable facilities for the
cating an overall reduction per capita of domestic waste generated.
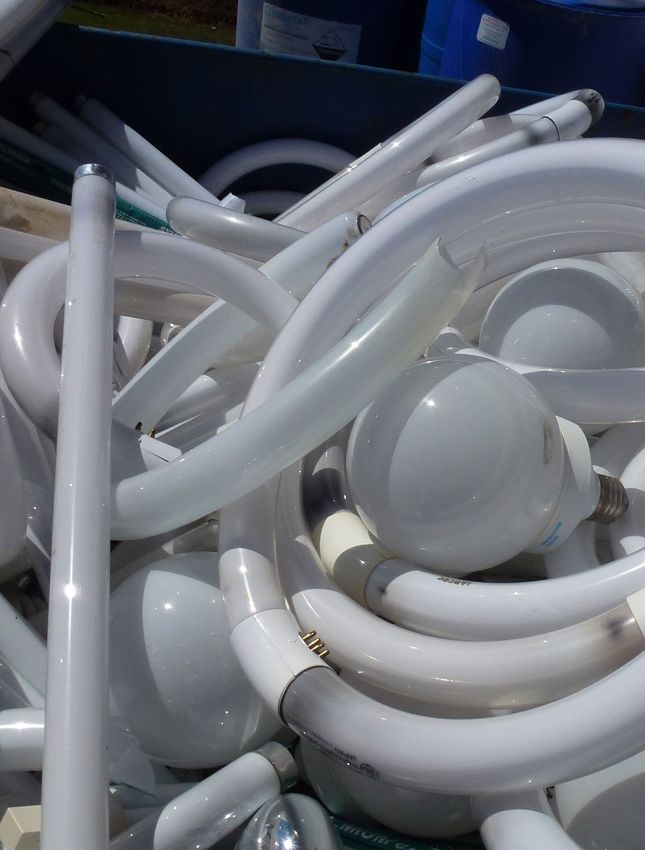
collection of household quantities of special waste items, including electronic
waste, mercury containing light bulbs, batteries, gas cylinder and oil varies In 2012/13 waste recovery in the region exceeded the tonnes of waste disposed to landfill for the first time.
across the region. Details of what is recycled where in the region is available in Four of the seven councils were achieving resource recovery rates of more than 50 percent of all domestic
Table 18 in Appendix 1. The opportunity to improve and expand these facilities waste. This is a result of a number of improved services across the region including: the introduction of a
through a network of Community Recycling Centres (CRC) is in progress through food and garden organics (FOGO) service in both Ballina Shire and Clarence Valley; a new kerbside recycling
the availability of Waste Less Recycle More grant funding. service in Kyogle; a garden organic service in Richmond Valley; and the greater availability of drop off ser-
vices for householders particularly for priority wastes e.g. Ewaste. Extensive education and communication
campaigns have supported the successful implementation of these new and improved services. Figure 4
presents the total domestic waste generation and resource recovery in tonnes for the region since 2007.
Household Hazardous Waste
Figure 4: Total Domestic Waste Generation and Resource Recovery
The region has Household Hazardous Waste Stores located in four LGA’s –
Clarence Valley, Lismore, Tweed and Richmond Valley. An annual household
chemical clean up day is held in the other LGA’s and chemical collection cabinets Tonnes Disposed Tonnes Recovered
are being considered in association with the development of CRC’s. 200,000
180,000
Annually Councils collect for disposal approximately 20 tonne of Hazardous
160,000
waste. The majority of this is water based paints, but a range of more toxic
chemicals still present throughout the year. 140,000
120,000
100,000 85,675 75,738 78,469
79,229 80,324
Other Services 80,000 88,273
60,000
40,000
Other waste and resource recovery services available to households across the
20,000
region include: Tweed Shire’s twice yearly kerbside clean up service and a free 89,938 85,789 91,197 91,012 82,073 73,950
‘pick up on request’ for scrap metal; Lismore City’s four annual tip free days; -
2007/08 2008/09 2009/10 2010/11 2011/12 2012/13
Clarence Valley’s annual kerbside clean up for residents; and Byron Shire’s bulk
waste drop off (1 voucher per household per year).
Since 2009 the regional resource recovery rate for domestic waste has increased from 46% to 54%
demonstrating an above average performance for the state.N O R T H E A S T WA S T E - R E G I O N A L WA S T E M A N A G E M E N T S T R AT E G Y | 1 1
Total Kerbside Domestic Waste
Most domestic waste is collected via Councils kerbside bin services. Overall the total quantity of do-
mestic waste and recycling collected in kerbside bins has been steadily decreasing by about 1 kilo-
gram per household per week each year since 2007. Throughout this period there has been a steady
increase in the diversion of both dry recycling and organics with a corresponding reduction in the
disposal of waste to landfill via the residual waste bin as shown in Figure 5.
Total Municipal Solid Waste (MSW)
Figure 5: Total Kerbside Domestic Waste Generation
Residual Dry Recycling Organics Solid waste from households including kerbside bins, kerbside clean ups
and self haul to drop off centres comprises the majority of the MSW stream.
80,000
However MSW also includes solid waste from local government operations
such as waste collected from municipal parks and gardens, street sweepings,
70,000 events, council engineering works and public council bins.
60,000 In 12/13 an estimated 5% of regional MSW was from sources other than
households.
50,000
40,000 2.3.2 Construction & Demolition Waste (C&D)
In 12/13 approximately 26,400 tonnes of C&D waste was received at Council
30,000 facilities across the region. This is a 20 % reduction in the quantity received in
07/08. This may be a result of a number of factors such as a decrease in con-
20,000 struction activity due to economic downturns in recent years or an increasing
diversion to the commercial sector for reuse. It may also be as a result of the
10,000 impact of the section 88 waste levy introduced in 2009.
Incomplete data prevents the estimation of accurate recovery data for C&D
-
at this time. Improved regional reporting and data capture systems are a key
07/08 08/09 09/10 10/11 11/12 12/13 objective of this regional waste strategy and will allow future performance
to be measured against the WARR Strategy C&D target of 80% recycling by
2021/22.N O R T H E A S T WA S T E - R E G I O N A L WA S T E M A N A G E M E N T S T R AT E G Y | 1 2
2.3.3 Commercial & Industrial Waste
(C&I)
Reliable data about the commercial sectors waste gener-
ation and resource recovery performance is not currently
available. This is due to the combined residential and C&I
collection services provided by Councils and the existing
weighbridge and MRF systems that do not allow accu-
rate data separation for differing waste streams.
C&I data provided by Councils for 12/13 indicated diver-
sion rates of approximately 33%. This is significantly low-
er than the estimated NSW C&I recycling rate of 57% in
2.4 Waste Composition
10/11. The WARR Strategy (13-21) target for C&I is 70% by
2021/22.
The OEH Resource Recovery Infrastructure Needs Analy-
2.4.1 Kerbside Residual Bin
sis Background Report (GHD Nov 11) included a review of Table 4 shows the amount of residual waste generated per household across the NEW Councils in 2012/13. The amount of
NSW waste strategies and policies. A key finding indicat- potential recycling being disposed to landfill (resource loss) via the kerbside residual bin was estimated from the most recent
ed that the waste and environment levy is not impacting waste composition audit data for each Council.
the C&I sectors as the levy is hidden within waste collec-
tion contracts, leading to minimal incentives for source Table Kerbside Residual Bin Composition 2012-13
separation.
4
Domestic Council Name NE
Kerbside Ballina Byron Clarence Kyogle Lismore Richmond Tweed Waste
Residual Bin Region
2.3.4 Illegal Dumping Shire Shire Valley Shire City Valley Shire
The incidence of Illegal dumping in the region has grown Yield per
in recent years, with 403 incidents reported in 2012/13. household 8.05 10.50 6.24 6.66 7.79 10.92 10.01 8.60
kg/hh/wk
There is an absence of reliable data on tonnages as col-
lection is often shared across Council departments. This Dry Recycling kg/
3.35 1.94 1.33 1.79 2.57 2.50 2.42 2.31
and the under-reporting of small incidences has resulted hh/wk
in poor data capture. The Illegal Dumping project has ad-
Organics kg/hh/
dressed some of these issues by instigating an online re- 3.27 4.74 2.80 2.73 1.62 4.31 5.46 3.52
wk
porting tool and focusing on improving data collection.
Total Potential
82.3% 63.7% 66.1% 67.8% 53.8% 62.4% 78.8% 67.8%
Recycling %N O R T H E A S T WA S T E - R E G I O N A L WA S T E M A N A G E M E N T S T R AT E G Y | 1 3
Figure 6 presents the average residual kerbside bin composition for the NE Waste region in 12/13.
Fig 6. NE Waste Region – Kerbside Residual Bin Composition
Hazardous 1%
Food Organics 29% Non-Recyclable
Plastics 8%
Building Waste 2%
Contaminated
Recyclable Other 31% Paper 5%
Plastics 9% Earth Based 3%
E-waste 1% Nappies
5% Other
Non-Ferrous Metal 2%
Organics
Garden Misc. Waste 3%
Ferrous Metal 3% 4%
Organics
Glass 4% 11%
Cardboard & Paper 9%
In 12/13 the average household residual bin (red lid) contained 8.6kg of waste per week. An estimated 68% of the bin contents were
potentially recyclable (as indicated in the larger chart in Fig 6), including 40 percent food and garden organics, 27 percent dry recycla-
bles and 1 percent Ewaste. This equates to an estimated 33,000 tonnes annually, which could potentially be recycled from kerbside bins
across the region. Existing kerbside collection services provided by the 7 member councils allow for the diversion of this dry recycling
and most of the organic waste. Ewaste however, needs to be self hauled to a Council drop off location to be recycled.N O R T H E A S T WA S T E - R E G I O N A L WA S T E M A N A G E M E N T S T R AT E G Y | 1 4
2.4.2 Kerbside Recycling Bin
Table 5 shows the amount of dry recycling per household in each NEW Council in 2012/13 and the level of contamination
with residual waste and organics which cannot be recycled via the yellow lidded bin. The average yield per household
across the region was 5.61 kg per week with a contamination rate of 4.6%. Only one council had a contamination rate in
excess of 5 percent, but still below the 10 percent level required to avoid disposal to landfill.
Kerbside Recycling Bin Contamination 2012/13
Table
Council Name
5
NE
Ballina Byron Clarence Kyogle Lismore Richmond Tweed Waste
Shire a Shire b Valley a Shire a City b Valley a Shire a Region
Yield per Household kg/hh/wk 5.14 6.42 5.65 6.66 5.25 4.42 5.71 5.61
Contamination kg/hh/wk 0.214 0.499 0.229 0.333 0.127 0.184 0.262 0.264
% Contamination 4.2% 7.8% 4.0% 5.0% 2.4% 4.2% 4.6% 4.6%
Source: a) Local Government Data Returns 11/12 & 12/13
b) Council Waste Composition Audit ReportsN O R T H E A S T WA S T E - R E G I O N A L WA S T E M A N A G E M E N T S T R AT E G Y | 1 5
2.5 Performance Assessment
This section reviews the performance of different waste collection systems and helps us understand how exist-
ing schemes are performing and where there is potential for improvement. The region’s performance is mea-
sured against a number of indicators including the amount of household waste generated, the percentage
Table
recycled and the overall diversion from landfill. This analysis enables the NE Waste region’s performance to be NE Waste Councils Generation per Household
compared against other similar councils and regions.
6
Yield (kg/hh/wk)
2012/13
Council Name Recycling Rate
2.5.1 Household Generation Residual to Dry
Organics Total
landfill Recycling %
Household waste generation has been steadily reducing since 2007. In 12/13 households across the region
generated less than 9kgs of residual waste per week on average. The dry recycling rate at 5.6kgs continues to Ballina Shire
8.05 5.14 7.4 20.59 61%
remain similar to previous years. The organics yield per household has reduced slightly each year from 07/08 Council
to 12/13, which may be a result of increased home composting and mulching practices, but is still significantly
Byron Shire
higher than the 2011/12 Regulated Regional Area (RRA) average of 3.9 kg/hh/wk and the state average of 3.2 10.50 6.42 0 16.92 38%
Council
kg/hh/wk.
Clarence Valley
6.24 5.65 8.25 20.14 69%
Council
Figure 7 Household Generation Kyogle Shire
6.66 6.66 0 13.32 50%
Residual Dry Recycling Organics Total Kerbside Council
Lismore City
25.85 7.79 5.25 8.1 21.14 63%
24.75 Council
23.45
22.75
21.49 Richmond Valley
20.78 10.92 4.42 3.66 19 43%
Council
Tweed Shire
10.01 5.71 5.47 21.19 53%
Council
12.10 12.00 11.62
10.82 NEW Region 12/13 8.6 5.6 6.6 20.8 59%
9.53
8.38 8.60
7.82 NEW Region 11/12 9.5 5.2 6.7 21.4 56%
6.79 7.01 6.72 6.58
RRA 11/12 9.1 4.9 3.9 17.9 49%
5.37 5.03 5.24 5.61
4.93 4.92 NSW 11/12 11.3 4.8 3.5 19.6 42%
07/08 08/09 09/10 10/11 11/12 12/13N O R T H E A S T WA S T E - R E G I O N A L WA S T E M A N A G E M E N T S T R AT E G Y | 1 6
2.5.2 Domestic Diversion
The total domestic diversion rate for the NE Waste region has been gradually increasing due
mainly to improved diversion rates from kerbside bins. Diversion from clean up events has
fluctuated broadly due to a variety of factors including the market value of scrap metal, regular
Table Domestic Diversion Rate
changes in the services offered by Councils and incomplete collection data.
7
Domestic Diversion Rate %
Council Name 2012/13
Figure 8 Domestic Diversion Rates
Total Domestic Total Kerbside Total Drop Off Total Clean Up
Kerbside Drop off Clean up Ballina Shire 53.1% 58.6% 43.7% 0.0%
Byron Shire 47.2% 38.0% 58.8% 0.0%
70.0%
Clarence Valley 63.2% 65.1% 62.1% 13.9%
60.0% Kyogle Shire 55.9% 50.0% 58.9% 0.0%
Lismore City 70.4% 59.5% 82.5% 73.5%
50.0% Richmond Valley 39.7% 42.5% 34.5% 0.0%
Tweed Shire 44.8% 45.7% 56.6% 0.0%
40.0%
NEW Region 12/13 54.4% 52.5% 60.4% 15.3%
NEW Region 11/12 49.5% 48.6% 58.9% 35.3%
30.0%
RRA 11/12 49% 54.5% 48.0% 36.9%
20.0%
Regional diversion targets for domestic waste (Resource Recovery Infrastructure Needs Analysis Report –
GHD Nov 11) are estimated to increase to 57% in 2014, 71% in 2017 and 83% in 2021. The NE Waste Councils
10.0% are already well on target with 54% diversion achieved in 2012/13.
0.0%
07/08 08/09 09/10 10/11 11/12 12/13
There is significant variation in the domestic diversion rates achieved by NE Waste member coun-
cils as shown in Table 7 below. This is due primarily to the differences in service availability and
supporting infrastructure across the region.N O R T H E A S T WA S T E - R E G I O N A L WA S T E M A N A G E M E N T S T R AT E G Y | 1 7 2.6 Waste and resource recovery collection, processing and disposal contracts 2.6.1 Waste Collection Each Council has its own arrangements in place for waste collection, by contract with a private operator or by an in-house service. All Councils have a kerbside comingled recycling service for residents and com- mercial premises. Tweed Shire also offers bulk bins and a twice yearly kerbside domestic clean up service. Five Councils provide an organics collection service and those that do not already have an integrated food organic & garden organic (FOGO) service are planning up grades in the next 1 – 2 years. In addition Byron Council is planning to implement a new FOGO service in August 2015. 2.6.2 Waste Processing There are three Material Recycling Facilities (MRF) in the region. Bryon, Tweed, and Kyogle have contracts with a private operator for processing at the privately operated Chinderah MRF. CVC recyclables are pro- cessed at the Grafton MRF, which is situated at the landfill. The new Lismore MRF has a minimum 15,000 tonne per annum capacity and begins processing dry recycling from Lismore, Richmond Valley and Ballina in June 2014, when existing contracts for processing at Visy, Carrara are completed. Lismore’s organic recy- cling facility processes both Ballina and RVC’s organic waste, via an open windrow composting system. CVC processes its organics via the In Vessel Composting system at the Grafton MRF site. Tweed’s private contrac- tor provides full landfill site management including the collection and processing of garden organics into mulch. 2.6.3 Waste Disposal Most NE Waste Councils dispose of residual waste at their local licensed landfill facility, with the exception of Ballina, Bryon and Tweed Shire Councils, who currently have contracts with a private operator for disposal of residual waste at landfills in SEQ. Further details on NE Waste Council collection, processing and disposal contracts is available in Tables 14 –16 in Appendix 1.
N O R T H E A S T WA S T E - R E G I O N A L WA S T E M A N A G E M E N T S T R AT E G Y | 1 8

   2.7 NE Waste Council Waste & Resource Recovery Infrastructure

In 2011 an infrastructure needs analysis identified the Northern Rivers as a high priority for new resource recovery infrastructure. Since
that time a number of new facilities have become operational, addressing some of the infrastructure gaps identified. These include a new
MRF at Grafton and Lismore, a organic processing facility at Grafton and 2 household hazardous waste sheds at Richmond Valley and in
the Tweed Shire. Proposed infrastructure to address future needs and materials accepted at facilities are included in Tables 17 and 18 in
Appendix 1.

A summary of existing and proposed infrastructure across the region includes:

                                                                                                                                             Lismore City operates one landfill (40,000 t/pa), a vehicle depot, two transfer
                                                                                                                                             stations, an organic recycling facility, a new material recycling facility (15,000
                      Ballina Shire operates a transfer station and tip shop. The landfill is currently                                      t/pa), a hazardous waste store, a tip (Revolve) shop and a recycling drop off
                      closed. Proposed infrastructure includes a pyrolysis plant (25,000 wet t/pa),                                          centre. Proposed infrastructure includes a dirty MRF, a concrete processing
                      expected to begin operations in June 2016.                                                                             facility and a regional paint and mattress processing facility.

                      Byron Shire operates a transfer station and tip shop. The landfill is currently                                        Richmond Valley operates two landfills (33,000 t/pa), four transfer stations,
                      closed. Proposed infrastructure includes a new landfill (25,000 t/pa) which is                                         a Front End Resource Recovery Centre (FERRC) and a hazardous waste store.
                      in the planning phase and a Material Resource Recovery Centre (7,500 t/pa)                                             Proposed infrastructure includes a tip shop and a Community Drop off Centre.
                      currently under development.

                      Clarence Valley operates one landfill (50,000 t/pa), a material recovery facility                                      Tweed Shire operates one landfill (75,000 t/pa), two transfer stations, a tip
                      (12,000 t/pa), an organic composting facility (14,000 t/pa), a vehicle depot,                                          shop and a hazardous material store. Proposed infrastructure includes the
                      a hazardous material store, six transfer stations and a tip shop. Proposed                                             construction of a new landfill with 2.5 million cubic meters capacity.
                      infrastructure includes two Community Drop off Centres.

                      Kyogle Shire operates two landfills (4,600 t/pa), four transfer stations and a tip
                      shop. Proposed infrastructure includes a Community Drop off Centre.
N O R T H E A S T WA S T E - R E G I O N A L WA S T E M A N A G E M E N T S T R AT E G Y | 1 9
2.8 Waste Forecasting and Projections
Figure 9 Total Domestic Waste Generation (tonnes) Forecast to 2021
Figure 9 displays a number of waste scenarios based on ABS
projected population data and the historical trends of domestic
Scenario 1 Scenario 2 Scenario 3 Domestic Waste 07-12
waste generation in the NE Waste region. The regions population
180,000 is forecast to increase from 287,900 in 2011 to 306,000 in 2021. The
scenarios display the possible change in tonnages of domestic
waste over time, in line with the predicted population increase and
175,000
changes in the generation of waste per person.
170,000 • Scenario 1 assumes a continuation of the overall trend of a
reduction in waste generation of 1.5% per capita in the region.
165,000
• Scenario 2 assumes that domestic waste generation remains at
the 2012 rate of 0.55 tonnes per year per capita.
• Scenario 3 assumes further improvement to a 2.25% reduction
160,000
in domestic waste generation per capita, reflecting our
aspirational target.
155,000
After 2013 all scenarios predict a steady increase in total domestic
waste generation until 2021. These predictions could be influenced
150,000 by a number of factors including the economic climate, behavioural
2007 2008 2009 2010 2011 2012 2013 2014 2015 2016 2017 2018 2019 2020 2021
change through education and regulation and natural disaster
events.
The above forecasting is limited by the exclusion of commercial
and Industrial and construction and demolition waste tonnages.
Proposed improvements in data collection and reporting will
enable more accurate prediction of waste generation across all
waste streams.N O R T H E A S T WA S T E - R E G I O N A L WA S T E M A N A G E M E N T S T R AT E G Y | 2 0
Table NE Waste Programs & Initiatives
8
2.9 Review of programs, initiatives and community Project and Initiatives Features Outcomes
expectations Administration and Regular meetings and Monthly meetings with member councils and
Communication networking contractors
Communications E-letters and Website providing information and
interaction at www.newaste.org.au
NE Waste had delivered a broad range of waste education, business and community engagement programs Media Editorial and advertising to support projects
over 17 years. In recent years the group has focused on delivering outcomes in the initiatives tabled below,
Regional Waste Collaboratively Regional Waste Strategy 2011-15
with their key features and outcomes
Strategy identifying regional
objectives and
planning actions for
implementation
School and Community The Green House Community events and schools visiting program
Education programs education unit (> 42 event days pa) directly engaging with
approx. 5,000 people/students p.a.
Love Food Hate Waste Integrated into above GH program, with its own
Program marquee, education resources and performers.
Approx. 14 community events p.a.
Trip to the Tip Schools Experiential learning for K-6 at their local waste
Program facilities. Includes student handbook.
National recycling week Media campaign about Council recycling services
Secondhand Saturday The biggest garage sale day that involves up
to 50,000 people in reuse through holding or
visiting garage sales on the day.
From 2007- 2010 reaching more than 50
Early Childhood Waste
preschools/early childhood centres. Holistic and
Education Program
integrated approach for centres becoming waste
wise.
Including Students Using Sustainable Strategies
High Schools Program
Program (SUSS) run from 2004 – 2012. Waste
Audit training with high schools run in
conjunction with SUSS and now with Dorroughby
EE Centre.N O R T H E A S T WA S T E - R E G I O N A L WA S T E M A N A G E M E N T S T R AT E G Y | 2 1
Project and Initiatives Features Outcomes Project and Initiatives Features Outcomes
Business Waste Business engagement Actively engaged over 600 businesses since 2005. Raising awareness of Assist Councils to TV, radio, print advertisements and editorial
Reduction Project and audit project Illegal Dumping enforce illegal dumping
Stage 1 - audited 40 businesses and provided Posters, stickers, brochures, road signage,
prevention strategies.
support to facilitate waste reduction practices. enforcement tape.
Provide a targeted and
Stage 2 – precinct and sector based approach regionally appropriate Training for council staff in Illegal Dumping
included 10 business cluster surveys and assessed marketing and media enforcement
490 small businesses over 2 years. campaign. Development of online reporting for Illegal
Waste Warriors project Stage 3 – Waste Warriors utilises TV, electronic, dumping
social and print media, to engage businesses. Development of www.illegaldumping.com.au
A case management approach incorporates website
EPA Bin Trim tool and a detailed action plan to
Support and development of regional projects
achieve increased diversion through facilitation
that focus and support the needs of the 7 local
of recycling partnerships, improved staff training
councils in NE Waste
and promotion of business success.
Hazardous Waste Stores Providing stores and 4 regional HHW Stores accepting household
Problem Wastes Regional contracts for Collections for ewaste, compact fluorescent lamps,
and Chemical Cleanout cleanout days in Councils waste
specific problem wastes tyres
days without stores
HCC days each year in 3 council areas
Emissions Project Greenhouse Gas GHG assessment and emissions report
Assessment
Partnerships Making links to other Regular meetings with RENEW NSW
Contamination Contamination survey 7000 dry recycling and organic bins assessed for agencies and funding
Grants funded by Environment Trust include
Management Project contamination management across the region bodies
Illegal dumping, ecofriendly youth project, love
every 2 years with advice and information provided
food hate waste
to householders.
Networks and projects with environmental
Training Landfill operator, Training provided for staff from member Councils
educators, ROUS water,
Asbestos identification, for professional development on specific areas
Illegal dumping each year.
Education and Media
training
Compositional Waste Assisting Councils to Assisting Councils to complete waste audits in
Audits complete physical waste house to EPA standards
auditsN O R T H E A S T WA S T E - R E G I O N A L WA S T E M A N A G E M E N T S T R AT E G Y | 2 2
2.10 Summary
The NE Waste region has reduced total domestic waste generation and improved recycling and resource
recovery through individual council initiatives, ongoing regional collaboration and implementation of A strategy is required that addresses these challenges and includes a uniform
the Regional Waste Management Strategy 2011-14. However there is still work to be done to continue
improving performance into the future. waste management system, enhanced services and drop off facilities and
improved infrastructure, supported by a comprehensive education and
At present the NE Waste region faces a number of challenges in waste management that this strategy
will address. They include: communication program to maximise business and community engagement.
This will contribute to further increasing diversion, alleviating pressure
▶▶ The regions population is predicted to increase by 6% to 306,000 by 2021 and this has
implications for waste generation, landfill availability and service provision. and future expenditure on Council’s facilities and improving resource
▶▶ While all Councils currently have a dry recycling service and most have an organics collection, recovery across the region.
there is room for further expansion and improvement.
▶▶ Significant quantities (68%) of potentially recyclable materials are currently present in the
residual waste bin and can be recycled through existing Council services
▶▶ Improved infrastructure is required to keep pace with future increases in population and
waste generation. Additional landfill capacity is needed to cope with current and future
residual waste disposal requirements. To achieve the WARR target of 75% diversion from
landfill by 2021, the further expansion and sharing of regional resource recovery facilities is
required.
▶▶ The lack of data about the commercial sector’s waste generation and resource recovery
makes planning for the future more difficult. Targets have been set for 70% C&I recovery, yet
existing weighbridge systems and MRFs do not allow accurate separation of the data in the
MSW and C&I streams.
▶▶ Ensuring regional cooperation, maintaing equity and open communication, while addressing
the different needs of individual member Councils.N O R T H E A S T WA S T E - R E G I O N A L WA S T E M A N A G E M E N T S T R AT E G Y | 2 3
3
STRATEGIC DIRECTION
3.1 Vision For The Strategy 3.2 Key Result Areas and Objectives
Our vision is to achieve more sustainable waste management and better resource recovery in the NE Waste The area of focus for the strategy and the objectives outlined in the following sec-
region through a proactive, collaborative approach with our regional member Councils, the NSW EPA and tions are informed by the analysis of the current situation presented in Section 2.
our community. Past experience, strategies and previous studies (summarised in Appendix 2) were
also considered in identifying areas that required action. In addition, the current
Through this Strategy we aim to fulfil our objectives and meet targets by: funding opportunities and the strategic aims of State and local Government also
contributed.
▶▶ Delivering targeted and effective projects that engage and build capacity in our communities
to achieve improved waste minimization and management outcomes The refinement of the existing strategic objectives occurred over a period of six month
▶▶ Creating strong Council partnerships that allow collaboration and optimize resource sharing and involved multiple consultations with member Councils (October 13-March14).
and funding opportunities Initially, objectives and actions from the 2011- 15 Strategic Plan were reviewed for
current applicability. Secondly, other State, Federal and local plans and Strategies
▶▶ Involving the community through social enterprises and the development of markets in recov-
were considered. A long list of potential objectives was developed and finally this
ered resources
was prioritised to a shorter, more achievable list, presented below.
▶▶ Adhering to the principles of sustainability, equity and continuous improvement
▶▶ Communicating and share our knowledge while striving for leadership and innovation in waste
▶▶ Adhering to the principles of sustainability, equity and continuous improvementN O R T H E A S T WA S T E - R E G I O N A L WA S T E M A N A G E M E N T S T R AT E G Y | 2 4
Key result Area 1: Regional cooperation and communication: Key result Area 2: Waste generation:
A focus on regional cooperation and communication stems from the benefits gained to date when Coun- The need to reduce the amount of waste generated in the region is made evident by the predicted
cils have collaborated, exchanging information or sharing facilities and services. The first objective in increase in population and the corresponding increase in waste generation. It will also limit the need
this area is driven by the potential benefits from economies of scale, diminishing landfill options and the for additional landfill and processing capacity. NE Waste will continue to successfully deliver a suite
desire to establish a regional or subregional facility for residual waste disposal. of campaigns, programs and projects to raise awareness in the community about waste minimisation
and avoidance.
The need to improve data collection was highlighted in the gaps in information from previous reporting
and the data requirements of this strategy. It is envisaged that targets will be easier to set and forecasting
more accurate once data collection improves.
Objectives Targets
An effective community engagement
Objectives Targets strategy and waste/sustainability education
Reduce waste generation by initiatives and facilities across the region
Research to investigate the feasibil-
encouraging waste avoidance A reduction in waste generation per capita
To identify, implement and support ity of regional solutions and have 2.1 2.1.1
through a targeted communica- by 2021
regional solutions to manage resid- solutions or facilities to manage all
1.1 1.1.1 tion and engagement strategy Increased engagement of the business and
ual waste, recycling and organics waste streams by 2020
broader community in waste reduction
processing A number of shared facilities or programs
contracts
Performance Measures
Improve regional reporting and A improved reporting system and
1.2 1.2.1
data capture data capture in place by 2015 ▶▶ % reduction in waste generation per capita
Improve NE Waste operation and
Regular meetings and increase in ▶▶ number of waste education initiatives and facilities
1.3 1.3.1 communication across and within
communication ▶▶ number of participants in waste reduction programs
Council
Performance Measures
▶▶ Investigation or reports complete
▶▶ Number of shared facilities and contracts
▶▶ Comprehensive data collection and regular and accurate reporting
▶▶ Reviewed operational procedures and agreements
▶▶ Participation in Council meetingsN O R T H E A S T WA S T E - R E G I O N A L WA S T E M A N A G E M E N T S T R AT E G Y | 2 5
Key result Area 3: Resource recovery Objectives Targets
Increase in recycling rate to 70% for MSW and C&I and
80% for C&D
The need to improve recycling and resource recovery is a strategic direction in most Increase recycling rates to meet
3.1 3.1.1 Reduction in contamination rates in the recycling stream
waste strategies. It is made evident in our region by compositional waste audits, NSW EPA WARR Strategy targets
where there is a continuing loss of large quantities of potentially recyclable materi- Increase participation rates and services for recycling
als via the residual waste bin, despite the continuing improvement in the kerbside and organics
recycling rate.
Increase the options and opportunities for shared
3.2.1
The need to encourage source separation and the uptake of recycling services in the resource recovery in MSW,C&I and C&D
Increase resource recovery by
commercial sector is considered a priority to meet targets set in the strategy and re- 3.2 sharing facilities, improving en- A uniform 3 bin system that includes food waste
duce the need for mixed waste processing into the future. Improved data collection gagement and collection 3.2.1 Extend the reach of resource recovery education and
regarding resource recovery from this sector would assist in future planning.
community engagement programs
Performance measures
▶▶ Change in recycling rate
▶▶ Proportion of recycling in the residual waste stream
▶▶ Household participation in recycling
▶▶ Number of businesses with a recycling/organics service
▶▶ Number of reuse shops and education initiatives targeting recycling
▶▶ Number of shared facilities for resource recovery
▶▶ The reach of resource recovery education and community engagement programsN O R T H E A S T WA S T E - R E G I O N A L WA S T E M A N A G E M E N T S T R AT E G Y | 2 6
Key result Area 4: Landfill diversion Key result Area 5: Problem Wastes
The limited landfill capacity of several member Councils requires actions that divert the volumes of Large volumes of problem wastes are collected at present, however the existing system is not compre-
waste currently disposed to landfill. Increasing recycling and processing organics will save landfill hensive or streamlined and as a consequence many items are still disposed of via the residual waste
space and diversion will reduce the impact of the waste levy on Council’s resources. Landfill diversion stream. CRC’s will provide an opportunity to assist in a more comprehensive, accessible and uniform
will also minimise impacts on public health and the environment including reducing greenhouse gas system of collection across our region to address current issues of limited sites, nonconforming recep-
emissions, odour, dust, noise nuisance and litter from Council’s waste management activities. tacles, inconsistent and unclear signage and poor access and storage.
Objectives Targets Objectives Targets
4.1.1 Increase diversion rate to 75% by 20-21 Reduce problem wastes to land- 15% decrease in the disposal of problem
fill by providing facilities and pro- wastes to landfill
Expand programs and projects that 5.1 5.1.1
reduce waste generation and improve grams for managing household Extend the reach of problem waste educa-
4.1.2
Increase diversion rates from recycling problem wastes tion and community engagement programs
4.1
landfill
Seek opportunities for resource
Identify a range of individual or shared Established social enterprise or alternative
recovery of problem wastes
4.1.3 options to divert or recover waste 5.2 5.2.1 to deal with mattresses, paints and other
destined for landfill problem wastes
Performance measures Policy and procedures for the safe handling
of asbestos
▶▶ Changes in diversion rate 5.3 Manage Asbestos Waste 5.3.1
▶▶ Completed review of infrastructure needs Increase participation in safe handling and
disposal of asbestos
▶▶ Range and number of options for diversion
▶▶ Number of waste diversion programs delivered
Performance Waste
▶▶ % of problem wastes in the residual waste stream
▶▶ an enterprise managing mattresses, paints and other problem waste
▶▶ number of community recycling centres and other facilities operating
▶▶ Number of Councils with policy and procedures for managing asbestos
▶▶ Number of participants in householder asbestos disposal schemeN O R T H E A S T WA S T E - R E G I O N A L WA S T E M A N A G E M E N T S T R AT E G Y | 2 7
Objectives Targets
6.1 Combat Illegal dumping and 6.1.1 Increase awareness and collect baseline
establish baseline data data on illegal dumping
Key result Area 6: Illegal Dumping and Litter
Reduce incidence of illegal dumping
6.2 Encourage litter reduction in 6.2.1 Increased awareness and reduced litter
The increasing incidence of illegal dumping and the lack of a coherent reporting target audiences
system make this a priority area and will be addressed through the continuation
of the Illegal Dumping project. The lack of projects targeting litter in the past
and the new opportunity to access resources to tackle litter and raise awareness
make this a suitable area for focus. Performance measures
▶▶ Number of incident s of Illegal Dumping
▶▶ Number of reports of Illegal Dumping
▶▶ Quantity of litter
All key result areas focus on specific waste management issues and to achieve their objectives
requires the support of a comprehensive communication and engagement strategy.N O R T H E A S T WA S T E - R E G I O N A L WA S T E M A N A G E M E N T S T R AT E G Y | 2 8
3.3 Member Council Strategy Council Summary of individual Councils waste strategy objectives
The main focus areas of the strategy are:
• Review of current activities and areas for improvement, including collection,
This strategy also needs to reflect the individual strategies that guide each member Council. A brief summary education and public interaction
of the relevant components of their community or waste strategies that align to this strategy’s objectives are • Development of new avenues for waste diversion, including glass crushing and
highlighted below. waste sorting activities
Lismore
• Improving and expansion of organic processing facilities (including biosolids) to
Table 9 - NE Waste Council Strategies cope with changes to current contract arrangements and future regional needs
• Development of a new landfill cell for residual waste
Council Summary of individual Councils waste strategy objectives • Capping of old landfill cells using non-conventional methods
• Investigation of future alternatives for disposal of the remaining waste.
The overall objective is to consider the management options for Ballina following
consideration of the core waste management activities undertaken by Council and The Richmond valley Community plan includes aims to:
Ballina the waste management issues facing the Shire into the future.
• Facilitate and encourage community clean up days such as Clean up Australia
The actions will focus on waste collection, recyclables, organics and residual waste. Day
Supportive Policy and Education are also key focus areas • Provide adequate resources to respond to waste incidents appropriately
The Strategy is consistent with the WARR strategy and its high level objectives are RVC • Provide programs and initiatives to encourage and support businesses within
centred around Resource Conservation, Resource Recovery, Resource Depletion and Richmond Valley Council to improve their waste production handling and
Environmental Conservation disposal facilities
Byron The high level targets include: • A reduction in waste generation
• Hold total waste disposal to landfill to 2010/11 levels
• Increase recovery and utilisation of materials from municipal sector from 40%
(2011/12) to 66% in 2014 The draft Strategy actions include:
This Strategy aims to standardise waste management practices across the Clarence • Provide waste and recycling collection mechanisms to improve resource recovery
Valley and to advance resource recovery goals. It explores issues of equity and • Provide infrastructure to appropriately manage waste and improve resource
Tweed
CVC access to services and importantly addresses ways of ensuring the delivery of solid recovery
waste services addresses the principles detailed in the Clarence Valley Sustainability • Provide strategic direction to improve resource recovery
Initiative.
Kyogle In development
All member Council strategies available are in line with the fundamental objectives of the NE waste Strategy.
If Council waste strategies are reviewed before 2021 their new objectives will be tested against this strategy
for compatibility.You can also read