Weather Synopsis -May 2020 - Department of Meteorology
←
→
Page content transcription
If your browser does not render page correctly, please read the page content below
Weather Synopsis –May 2020.
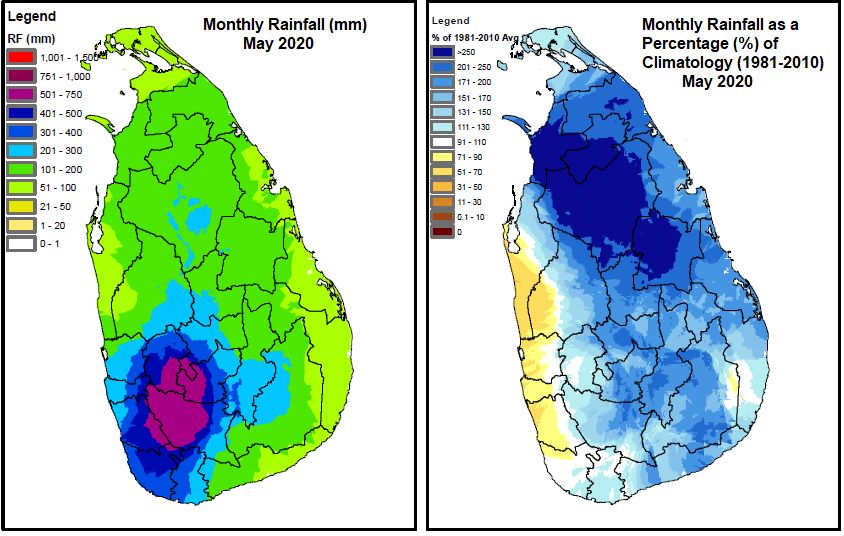
Above normal rainfall was reported over most parts of the island except western coastal areas where
slightly below average rainfall was reported (Fig 1).
Inter monsoon conditions continued during first two weeks with widespread afternoon thundershowers
in second week of the month. Strong convective activity caused two deaths due to lightning at Kinniya
on 01st and at Mihinthale on 04th. According to Disaster Management Center (DMC), several families
were affected by hazards caused by convective activity such as lightning, locally isolated strong winds
probably associated with the downdrafts of cumulonimbus clouds (a downdraft is a small-scale column
of air that rapidly sinks toward the ground often bringing strong winds), high intense rain leading to
cutting failures and minor floodsduring this period (Table1).
Showery conditions were enhanced over south-western parts and adjacent areas of the country with the
temporary establishment south-westerly wind flow across the island with the formation of Tropical
cyclone Amphan at the Bay of Bengal during the 3rd week of the month, A Low Pressure Area has
formed over southeast Bay of Bengal and adjoining south Andaman Sea, on 13 May 2020, became a
depression on 16th May 2020 and intensified into the cyclonic storm ‘AMPHAN’ in the same location
at evening of 16th May. It has underwent rapid intensification from very severe cyclonic storm,
extremely severe cyclonic storm, then in to in to a super cyclonic storm from 17th to 18thMay .
AMPHAN moved north-northeastwards slightly degrade in to a severe cyclonic storm before crossed
West Bengal – Bangladesh coasts near Lat. 21.65°N and longitude 88.3°E on 20thMay, 2020 (Fig
2).During the intensification process from low pressure area to a depression as well as during the rapid
intensification process of AMPHAN cyclone to a super cyclonic storm, extreme weather conditions
with strong winds, lightning and very heavy rainfall exceeding 150mm experienced particularly over
southwestern parts of Sri Lanka on 15th, 18th and 19th(Figs.3a,3b,3c, 4a, 4b, 4c, and 5).
Extreme weather eventsleading to landslides and cutting failures at Kegalle, Ratnapura, and Matara
districts, strong winds at Kegalle, Ratnapura, Matara, Galle, Hambantota, Kandy, NuwaraEliya,
Gampaha, Kalutara, Colombo , Jaffna, Kilinochchi, Mullaitivu, Matale, Badulla, Monaragala,
Puttalam, affected more than 6000 families and around 25,000 people. 8 people were died following
this disaster (source DMC).
With the strengthening of westerlies and increase in convective clouds, the southwest Monsoon has
established over Southern part of Sri Lanka on 28th May. According to India Meteorological
Department (IMD) the Northern Limit of Monsoon (NLM) passed through 5°N 72°E, 6°N79°E,
8°N86°E, 11°N90°E, 14°N93°E and 16°N95°E on 28th (Fig.6). However formation of a low pressure
area over southeast Arabian Sea and Lakshadweep area on 31st May 2020, has restricted further
advancement of monsoon flow across Sri Lanka for remaining days of May 2020.
Above normal rainfall was report from most of the principal meteorological stations exceptstations
located in western coastal belt such as Ratmalana, Colombo, Katunayaka and Puttalum as well as
Jaffna, Trincomalee and Hambantota where below average rainfall was reported (Fig. 7). Number of
rainy days was about or above average except Ratmalana (Fig. 9). Most of the hydro catchment
stations, except Samanalawewa reported above average rainfall (Fig. 8). Highest cumulative rainfall
was 998.2 mm at Guruluvana . Highest rainfall received during 24hours, was 260 mm at Kukuleganga
on the 26th.
Department of MeteorologyMost of the meteorological stations reported above averageMaximum temperatures during first 2
weeks, then slightly below average temperatures during third week and near average temperatures
7during last week ((Fig.15).Minimum temperatures were above average over most of the stations
especially during the 2nd half of the month(Fig.16). Reported maximum temperature was -37.80C at
Batticaloa on 21st May and reported minimum temperature was 9.80C at NuwaraEliya on 3rd May
(Table ).
Fig 1: Monthly total rainfall for May2020 and monthly total rainfall for May 2020 as a
percentage of Climatology (1981-2010) (Source Drought Bulletin, DoM) .
ENSO and IOD neutral conditions were observed during Month of May 2020. Ocean Nino Index is
around 0.3 during March, April and May (NOAA Climate prediction Center). Sea surface waters in
tropical Indian Ocean are warmer than average (Fig. 10 )
The Madden-Julian Oscillation (MJO) was strong at phase 04 from1st May to 03rd May became weak
from 04th to 12th and became strong at phase 2 from 13th to 18th, propagated eastward in to phase 3
on19th and 20th, propagated further eastward to phase 4 to 8 for the rest of the month (Fig.11).
The Inter Tropical Convergence Zone fluctuated around Equator 500E, 050N800E and 050N 1200E till
15th May. The average position of the shear line laid around Equator 400E, 020S700E and 040S1000E
(Fig 10).
Department of MeteorologyWeather Systems
A Low Pressure Area has formed over southeast Bay of Bengal and adjoining south Andaman Sea, on
13th May 2020, became a well marked low pressure area over southeast Bay of Bengal on 14th May
2020, concentrated into a depression centered near 10.4°N and 87°E at 00UTC/ 16 th May 2020 over
southeast Bay of Bengal (BoB),intensified into a deep depression near 10.9°N and 86.3°E at 09UTC/
16th May, into cyclonic storm ‘AMPHAN’ in the same location at evening 12UTC/ 16th May. It further
intensified into a severe cyclonic storm at 03 UTC 17th May, 2020 and centered near 11.4°N and
86.0°E. It has underwent rapid intensification from very severe cyclonic storm 11.7°N and 86.0°E
around 09UTC/17th, extremely severe cyclonic storm near 12.9°N and 86.4°E 21UTC/17th, then in to
in to a super cyclonic storm 06UTC/ 18th May . Super Cyclonic storm "AMPHAN" moved northward
lay centered at 15.6°N and 86.7°E at UTC/19th and maintained it’s Super Cyclonic status nearly for
24 hours around the same region. Weak vertical wind shear, very warm sea surface temperatures, and
increased cross equatorial wind surge over West Central BoB aid the rapid intensification of
AMPHAN in to a Super Cyclonic Storm. Interaction of MJO, Equatorial Rossby wave and Kelvin
wave also support enhancement of convective activity and hence the intensification of the system (Fig
.11). AMPHAN was the first Super Cyclonic Storm over the Bay of Bengal, after the Odisha Super
Cyclonic Storm of 1999. AMPHAN moved north-northeastwards and slightly degrade in to a very
severe cyclonic storm due to unfavourable environment of increase in vertical wind shear and low
Ocean thermal energy, before crossing West Bengal – Bangladesh coasts near Lat. 21.65°N and
longitude 88.3°E on 20th May, 2020 during 1000-1200 UTC, with maximum sustained wind speed of
85 knots gusting to 100 knots (Fig. 2 ).The system maintained the cyclonic storm intensity for almost
15 hours even after landfall from 1200 UTC of 20th May to 0300 UTC of 21st May (Source India
Meteorological Department).
Fig 2: Observed Track of Amphan (Source : IMD)
Department of MeteorologyImpact of AMPHAN super cyclonic stormon extreme weather events over Sri Lanka
Fig 3a : FY-2G visible images on 15th May 2020
Fig 3b : GLD360 lightning stroke maps on 15th May 2020 (Source : Finish Meteorological Institute)
Fig 3c :ERA reanalysis Stream lines and Potential Vorticity (x106 ) on 20200515 1200Z
Department of MeteorologyFig 4a Kalpana visible images on 19th May 2020 0230Z
Fig 4b GLD360 lightning stroke maps on 19th May 2020 (Source : Finish Meteorological Institute)
Department of MeteorologyFig 4c ERA reanalysis Stream lines and Potential Vorticity (x106) on 2020051823Z and 2020051902Z.
Fig 5: Daily rainfall maps for 15th May, 18th May and 19th May
During the intensification process from a low pressure area in to a depression occurred on 15 th and
early morning hours of 16th, enhanced convective activity was apparent over Sri Lanka especially over
the south-western parts as well as north-eastern and south eastern parts (Figs 3a, 3b, 3c and 5 ) .
Department of MeteorologyDuring the rapid intensification process of AMPHAN cyclone to a super cyclonic storm, extreme
weather conditions with strong winds, lightning and very heavy rainfall exceeding 150mm experienced
particularly over southwestern parts of Sri Lanka on 18th night and 19th morning (Figs 4a, 4b, 4c and
5) . This rapid intensification brought the strong, north-westerly to westerly winds with high potential
values at low levels (850mb) and mid levels (500mb) over Sri Lanka (Fig 4c), enhancing convective
rain (Figs 4b and 5) exceeding 150mm over western parts of Sri Lanka on 18th night and 19th morning.
Extreme weather events leading to landslides and cutting failures at Kegalle, Ratnapura, and
Mataradistricts, strong winds at Kegalle, Ratnapura, Matara, Galle, Hambantota, Kandy, NuwaraEliya,
Gampaha, Kalutara, Colombo , Jaffna, Kilinochchi, Mullaitivu, Matale, Badulla, Monaragala,
Puttalam, affected more than 6000 families and around 25,000 people. 8 people were died following
this disaster (source DMC).
Fig 6: Monsoon onset isochrones for May 2020 (Source : IMD)
Surface pressure and winds:The surface pressure was below average during 15-23rd and about or
above average for the rest of the month. There were even or fairly even pressure distribution from
1stto 5th and 10th to 14th, and southwesterly pressure gradient for the rest of the month. The pressure
gradient was steep during 18-20th, moderate during 16-17th ,21-25th and 27th and mild from 06thto 09th,
15th, 26thand 28th to 31st.
The surface wind was light and variable until 15th and westerly to Southwesterly for the rest of the
month and speed varied within 05-15kts.
Department of MeteorologyUpper winds:
At 850hPa, Westerly wind flow was dominated over the island. North easterly South westerly
oriented trough axis associated Cyclonic circulation centered over Westcentral BoB was evident to the
northwest of Sri Lanka. Influence from super cyclonic storm Amphan dominates the average wind
flow over South Asian region (Fig 12)
At 700 hPa, Northwesterly wind flow was dominated over the island. North easterly South westerly
oriented trough axis associated Cyclonic circulation centered over Westcentral BoB was evident across
of Sri Lanka. Influence from super cyclonic storm Amphan dominates the average wind flow over
South Asian region (Fig 13)
At 500 hPa, Westerly wind flow was dominated over the island. North easterly South westerly
oriented trough axis was evident to the northwest of Sri Lanka . Influence from super cyclonic storm
Amphan dominates the average wind flow over South Asian region (Fig 14)
The 200 hpa the upper tropospheric ridge was laid from 100N400E to 130N800E and 150N1000E
bringing predominantly southeasterly winds across Sri Lanka.
.
Fig 7: Monthly Total Rainfall(mm) with 30 years (1961-1990) of their averages at Main
Meteorological stations areas duringMay 2020
Department of MeteorologyFig 8: Monthly Total Rainfall(mm) with 30 years (1961-1990) of their averages at Hydro catchment
areas duringMay 2020
Fig 9: monthly total no of rainy days with 30 years(1961-1990) of their averages at main
Meteorological stations during
Fig 10: Ocean Surface Winds and Ocean Surface Temperature for May 2020
Department of MeteorologyFig 11 Phase diagram of MJO Index
Fig. 12 Monthly average wind pattern at 850hpa level during the month of May 2020 (JRA55)
Department of MeteorologyFig. 13 Monthly average wind pattern at 700hpa level during the month of May 2020 (JRA55)
Fig. 14 Monthly average wind pattern at 500hpa level during the month of May 2020 (JRA55)
Fig 15 Maximum Temperature anomaly (0C) for May 2020
Department of MeteorologyFig 16 Minimum Temperature anomaly (0C) for May 2020
Temperature Field:
The maximum temperatures in the day were mostly 1-30C above normal in most places during the
first 2 weeks of the month. Slightly below average temperatures were experienced during third week
and near average temperatures were reported during the last week (Fig 15).Highest recorded maximum
temperature for the month of May 2020 was37.80C at Batticaloa on 21st May (Table 5a).
Night minimum temperatures over most parts were abovenormal especially during the second half of
the month (Fig 16). 40C above normal night temperatures were reported at Ratmalana on 25th. Lowest
recorded minimum temperature for the month of May 2020 was 9.80C at NuwaraEliya on 3rd May
(Table 5b).
Maximum and Minimum departures from normal day/night temperature were shown in table 5.
Rainfall: Wetter than normal condition was evident over most parts of the Island except western
coastal areas (Fig 1) for May 2020. Above normal rainfall was reported from most of the principal
meteorological stations except stations located in western coastal belt such as Ratmalana, Colombo,
Katunayaka and Puttalum as well as Jaffna, Trincomalee and Hambantota where below average
rainfall was reported (Fig 7). Maximum percentage was reported from Polonnaruwa (334.4%) while
minimum from Hambantota station (30.4%) (Table 2).Number of rainy days was about or above
average except Ratmalana (Fig 9). It is worthy mentioned that Polonnaruwa station which received
maximum percentage of rainfall reported 3 times more number of rainy days than climatological
average (Table 2).
Most of the hydro catchment stations, except Samanalawewa reported above average rainfall (Fig 8).
Department of MeteorologyHighest cumulative rainfall was 998.2 mm at Guruluvana . Highest rainfall received during 24hours,
was 260 mm at Kukuleganga on the 26th. Significant rainfalls exceeding 100mm reported during May
2020 are shown in table 4.
The monthly total rainfall map, total rainfall and the number of rain days at the principal
meteorological stations, total rainfall at hydro catchment areas, significant rainfalls exceeding 100mm
are shown in figures 1,8,9 and 10 and tables 2,3, and 4.
Table 1hazards caused by convective activity during first two weeks of May 2020
dat Lightning Strong Winds Minor floods Cutting failure
e
01 Thambalagamuwa,
Kinniya
02 Udapalatha
03 Warakapola Paathadumbara,
Warakapola, Dehiowita,
Galigamuwa,
Yatiyantota
04 Rambewa
05 Kanthale, Morawewa,
Deraniyagala,
Bulathkohupitiya
06 Pachchilaippalai,
Karachchi
07 Kundasale
08 Yatinuwara
09 Madadumbara, Paathadumb
Mawanella ara
10 Lunugamwehera, Dompe, Gangaihalakorale, MawanellaNuwarael
RuwanwellaMahakumbukkada Hambantota, Gampaha, iya
wala Aththanagalla, JaEla, Udapalatha
Meerigama, Mahena,
Warakapola
11 AnamaduwaYatiyantota Panwila, Udunuwara, Chilaw Udapalatha
UdapalathaGangaihalako
rale
12 AranayakeMaritimepaththu Karaweddi, Godakawela DehiowitaDeraniyag
ala
13 Thunukkai. Openayake
Department of MeteorologyTable-02- total rainfall and the number of rain days at the principal meteorological stations recorded in
the month against the respective averages (1961-1990).
Monthly Total rainfall(mm) Monthly Total No of rainy Days
Meteorological station 2020-May Average % 2020-May Average %
Anuradhapuraya 206.0 84.3 244.4% 12 6 200%
Badulla 198.5 104.0 190.9% 13 10 130%
Bandarawela 249.2 104.2 239.2% 17 9 188.9%
Batticaloa 44.1 39.3 112.2% 3 3 100%
Colombo 200.2 392.4 51.0% 17 16 106.25%
Galle 314.4 290.4 108.3% 18 16 112.5%
Hambantota 25.9 85.1 30.4% 9 7 128.6%
Jaffna 39.9 46.7 85.4% 7 3 233.3%
Monaragala 191.0 11
Katugastota 316.3 144.0 219.7% 17 11 154.6%
Katunayake 203.7 317.6 64.1% 17 16 106.25%
Kurunegala 373.5 188.3 198.4% 18 12 150%
MahaIluppallama 264.4 93.0 284.3% 16 6 266.7%
Mannar 69.5 44.7 155.5% 8 3 266. 7%
Polonnaruwa 193.6 57.9 334.4% 9 3 300%
NuwaraEliya 287.8 175.9 163.6% 20 13 153.85%
Poothuvil 41.3 35.1 117.7% 7 na
Puttlam 66.0 84.3 78.3% 8 7 114.3%
Rathmalana 220.4 360.6 61.1% 14 17 82.4%
Rathnapura 737.1 475.9 154.9% 22 20 110%
Trincomalee 10.6 50.2 21.1% 5 4 125%
Vavuniya 196.4 74.8 262.6% 10 6 166. 7%
Mattala 29.8 10
Table-03-Monthly Total Rainfall (mm) with 30 years (1961-1990) of their averages at Hydro catchment areas
Hydro Catchment May 2020 Average % (Percentage of average)
Castlereigh 577.3 366.2 157.6%
Norton 805.1 534.4 150.7%
Maussakele 577.1 358.0 161.2%
Canyon 788.7 449.0 175.7%
Laksapana 798.4 604.3 132.1%
Kotmale 432.9 148.7 291.1%
Victoriya 177.8 31.9 556.7%
Randenigala 88.3 72.6 121.6%
Bowatenna 188.6 165.0 114.3%
Ukuwela 300.3 195.5 153.6%
SamanalaWewa 254.5 642.3 39.6%
Maskeliya 421.9 307.1 137.4%
Neboda 576.1
Note that the meteorological day in this text is reckoned as the 24hr period from 08.30hrs to 08.30hrs following day
Department of MeteorologyTable 4 : Significant rainfalls exceeding 100mm reported during May 2020
Date Rainfall amount received at partcular stations
08 Canawarella113mm; Galgamuwa107.4mm
09 Lower Spring Valley157 mm; Deniyaya112 mm;
10 Kukuleganga125 mm; Dehiwala104.2 mm;
11 Polonnaruwa111.5 mm;
12 Lower Spring Valley147 mm; Guruluwana116.3 mm; Karagala105 mm;
15 Monrovia193.3 mm; Norton187.3 mm; Karagala182 mm; Ilubuluwa Estate173 mm;
Watawala169.3 mm; Galle163.3 mm; Undugoda162 mm; Rathnapura155.6 mm;
Warakapola152.4 mm; Tampana145.5 mm; Baddegama145 mm; Castlereigh144 mm;
Weweltalawa135 mm; Maussakele133.25 mm; Canyon125 mm; Laksapana124 mm;
Guruluwana113.4 mm; Rathmalana111.8 mm; Kurunagala110.2 mm;
Beausejour Lower 109 mm; Kukuleganga105 mm; Vogan Estate103.3 mm;
Mathugama101 mm;
16 Colombo Fort122.3 mm;
17 IlubuluwaEstat113 mm;
18 Rathnapura193.3 mm; Kuttapitiya Tea Fac187.3 mm; Watawala172.3 mm; Deniyaya168.5
mm; Guruluwana 121.4 mm; Batuwanagala118.8 mm; Norton103.5 mm;
19 Ilubuluwa Estate145 mm; Kotagala Rosita121.8 mm; Norton119.8 mm; Laksapana119.8
mm; Watawala104.6 mm;
22 Kuttapitiya Tea Fac112.3 mm;
24 Guruluwana170.4 mm; Elston123 mm; Moralioya100 mm;
26 Kukuleganga 260 mm; Padukka Estate 160.5 mm; Nittambuwa 148 mm;
Gampaha(Bot-Garden)134 mm;
Table 5(a) - Extremes of Maximum Temperatures NoMay 2020
Maximum
Offsets Highest
Value (-) (+) Std.Div
Value 37.80C 5.9 4.8 1.91
Station Batticaloa Trincomalee Batticoloa Ratnapura
Date 21/05/2020 16/05/2020 21/05/2020
Table 5(b) -Extremes of Minimum Temperature May 2020
Minimum
Offsets Highest
Value (-) (+) Std.Div
0
Value 9.8 C 3.1 4.4 1.65
Station NuwaraEliya Mannar Ratmalana Mannar
Date 03/05/2020 18/04/2020 17/05/2020
Prepared by National Meteorological Centre(NMC)
Department of Meteorology
Department of MeteorologyYou can also read