Weekly Influenza and COVID-19 Surveillance graphs - GOV.UK
←
→
Page content transcription
If your browser does not render page correctly, please read the page content below
Weekly Influenza and COVID-19
                       Surveillance graphs
   UKHSA publishes a weekly national influenza and COVID-19 surveillance report
   which summaries the information from the surveillance systems which are used
   to monitor influenza, COVID-19 and other seasonal respiratory viruses in
   England.

   Additional figures based on these surveillance systems are included in this slide
   set.

   The figures presented in this slide set are based on data from week 04 (between
   23 January and 29 January 2023).

                                                                                   1
1 February 2023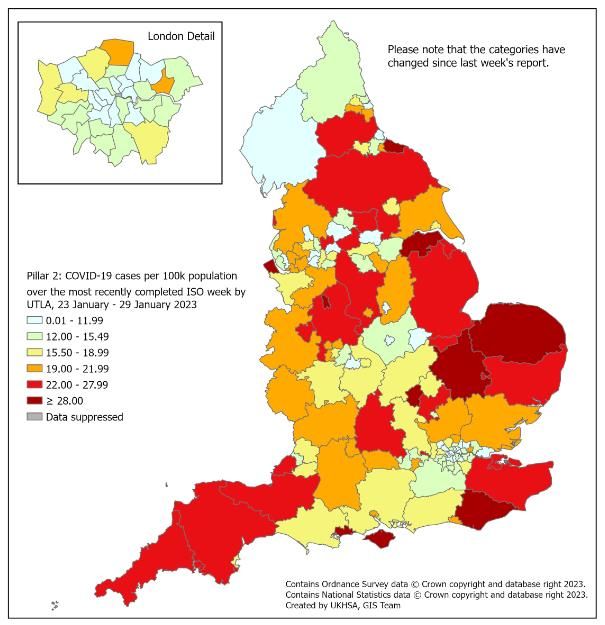
Contents

   1)    Confirmed COVID-19 episodes in England
   2)    Respiratory Datamart system (England)
   3)    Second generation surveillance system (SGSS)
   4)    Community surveillance
   5)    Surveillance in ‘educational-age’ cohorts
   6)    Primary Care surveillance
   7)    Secondary Care surveillance
   8)    SARS-CoV-2 Whole Genome Sequencing (WGS) coverage, England
   9)    Co/secondary infections with COVID-19

                                                                      2
1 February 2023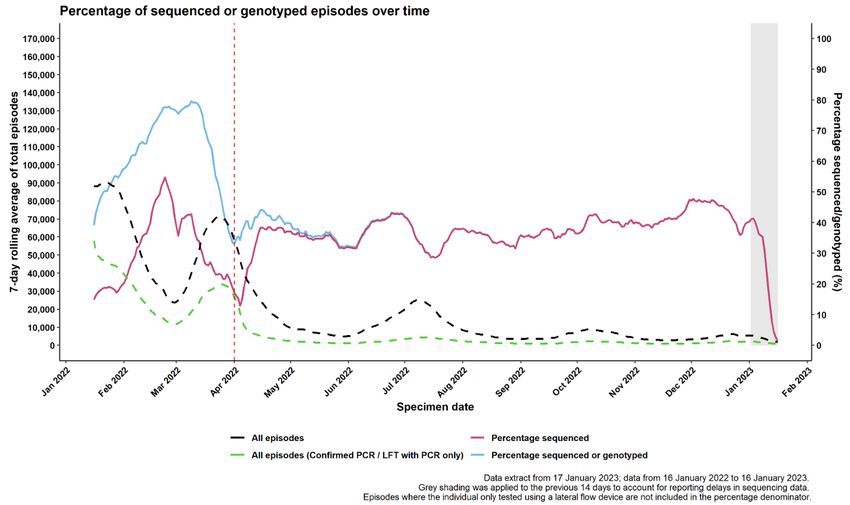
Confirmed COVID-19 episodes in
                    England

                                          3
1 February 2023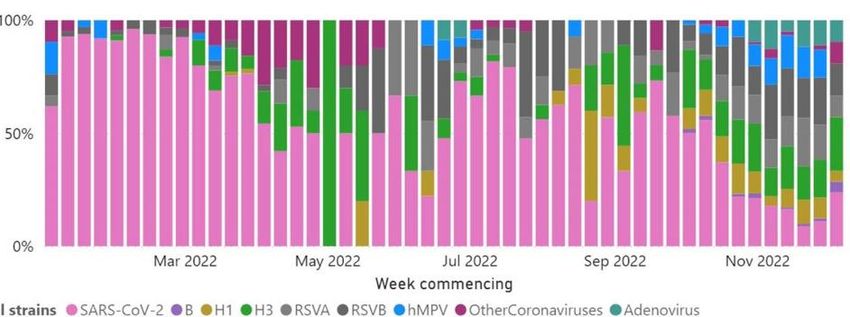
Confirmed COVID-19 episodes in England

    Data Information

    • From the week 32 report onwards, case rates have been updated to use the latest ONS population estimates for mid-2020. Previously
      case rates were calculated using the mid-2019 population estimates

    • From 11 January 2022 the requirement for confirmatory PCR testing in individuals who test positive using a lateral flow device was
      temporarily removed.

    • Rates by ethnicity and IMD quantile will continue to be presented using the mid-2019 estimates, until the mid-2020 estimates become
      available.

    • From 31 January 2022, UKHSA moved all COVID-19 case reporting in England to use a new episode-based definition which includes
      possible reinfections. Each infection episode is counted separately if there are at least 91 days between positive test results (PCR or
      LFD). Each infection episode begins with the earliest positive specimen date. Further information can be found on the UK COVID-19
      dashboard.

    • Since 1 April 2022, free universal symptomatic and asymptomatic testing for the general public in England is no longer available, as
      outlined in the plan for living with COVID-19. As such, there will be a reduction in the reporting of data obtained through Pillar 2 from
      April 2022 onwards. Data in this report should be interpreted in the context of this change to testing. Public health guidance remains in
      place for cases and their close contacts

                                                                                                                                          4
1 February 2023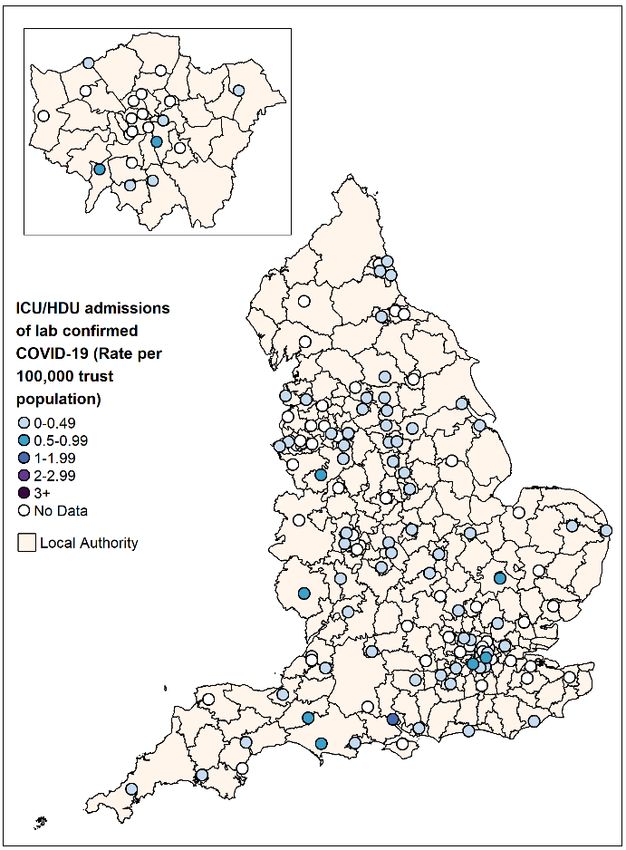
Confirmed COVID-19 episodes tested under Pillar 2, based on sample week with
                          overall weekly PCR positivity for Pillar 2 (%)

                     1100000                                                                                    60.0
                                                 Pillar 2 COVID-19
                     1000000                     episodes                                                       55.0

                     900000                                                                                     50.0
                                                 Pillar 2 positivity (%)
                                                                                                                45.0
                     800000
                                                                                                                40.0
                     700000
   Number of cases

                                                                                                                          Positivity (%)
                                                                                                                35.0
                     600000
                                                                                                                30.0
                     500000
                                                                                                                25.0
                     400000
                                                                                                                20.0
                     300000
                                                                                                                15.0
                     200000                                                                                     10.0
                     100000                                                                                     5.0

                          0                                                                                     0.0
                               5   7   9 11 13 15 17 19 21 23 25 27 29 31 33 35 37 39 41 43 45 47 49 51 1   3
                                                                  Sample week

1 February 2023                                                                                                       5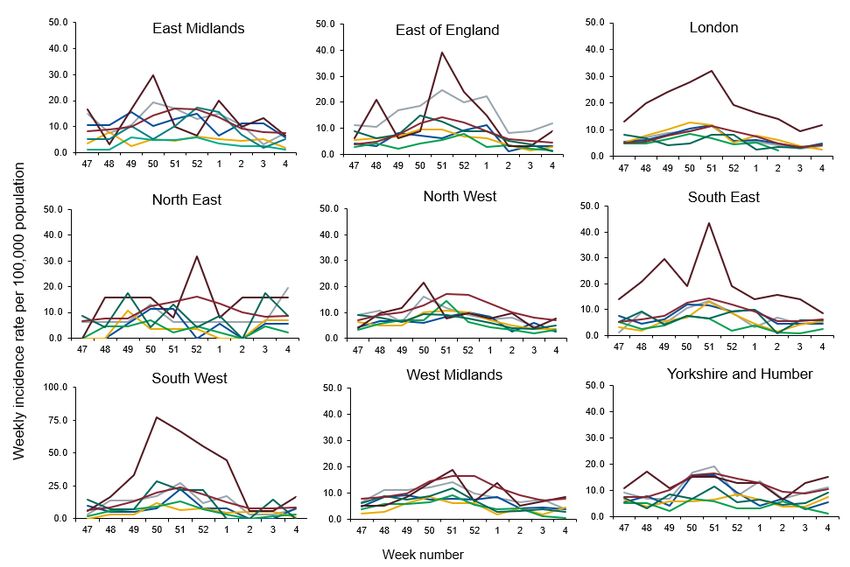
Weekly confirmed COVID-19 case rates per 100,000, by episode, tested under
                                        Pillar 2, by sex

                        2,000
                                                    Male         Female

                        1,500
Case rate per 100,000

                        1,000

                         500

                           0
                                5   7    9   11 13 15 17 19 21 23 25 27 29 31 33 35 37 39 41 43 45 47 49 51   1   3
                                                                       Week number

                        1 February 2023                                                                               6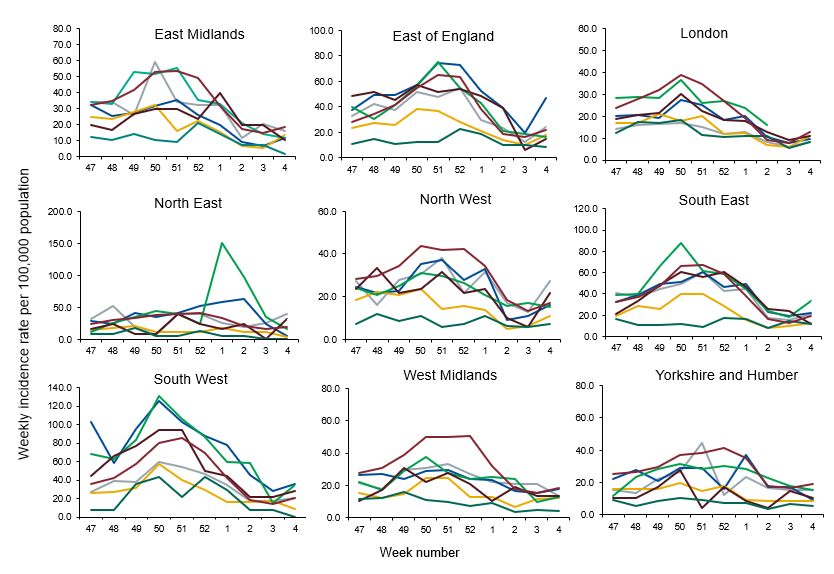
Weekly confirmed COVID-19 case rates per 100,000, by episode, tested under
                                Pillar 2, by age group

                        2,500                     0 to 4        5 to 9
                                                  10 to 19      20 to 29
                                                  30 to 39      40 to 49
                                                  50 to 59      60 to 69
                        2,000                     70 to 79      80+
Case rate per 100,000

                        1,500

                        1,000

                         500

                           0
                                4   6   8 10 12 14 16 18 20 22 24 26 28 30 32 34 36 38 40 42 44 46 48 50 52 2
                                                                   Week number

1 February 2023                                                                                                 7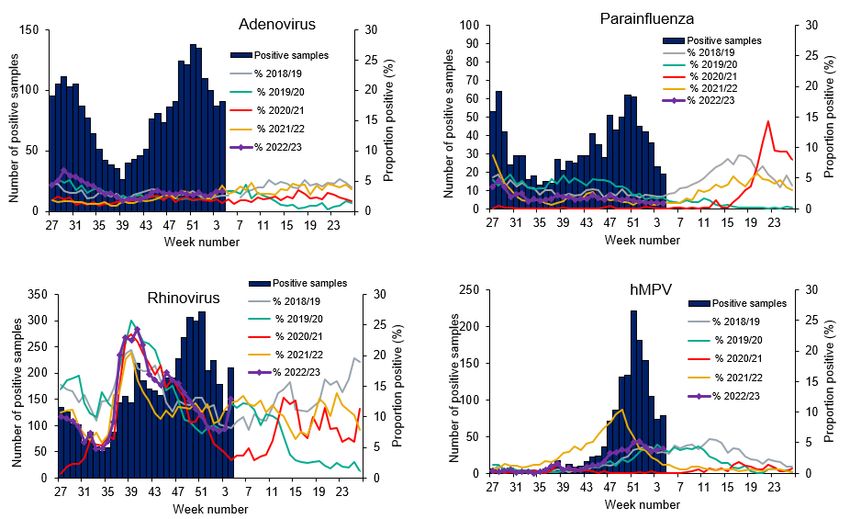
Weekly PCR positivity (%) of confirmed COVID-19 cases tested overall
                              and by sex under Pillar 2

                   50.0               Male      Female      All

                   45.0

                   40.0

                   35.0

                   30.0
  Positivity (%)

                   25.0

                   20.0

                   15.0

                   10.0

                    5.0

                    0.0
                          5   7   9    11 13 15 17 19 21 23 25 27 29 31 33 35 37 39 41 43 45 47 49 51   1   3
                                                              Week number

1 February 2023                                                                                                 8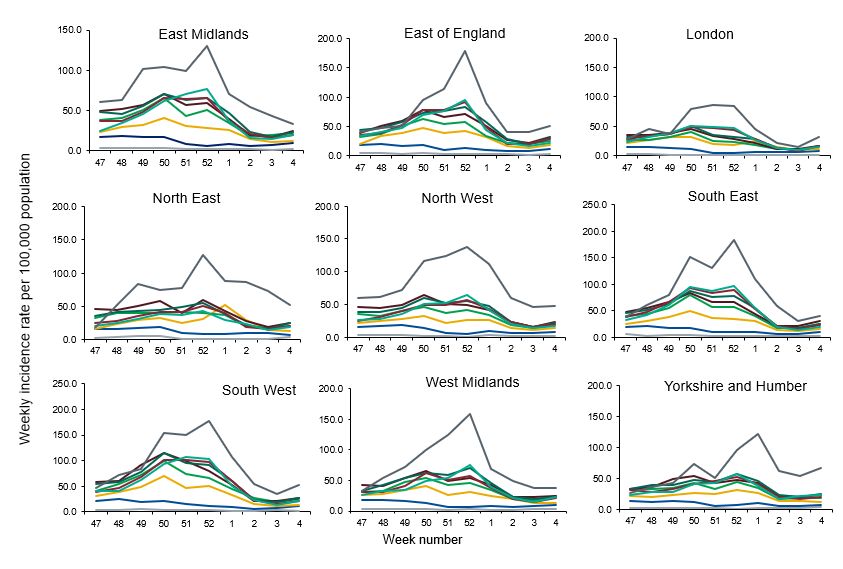
Weekly PCR positivity (%) of confirmed COVID-19 cases tested under Pillar 2,
                           by male and age group

               120.0
                                                                      0 to 4       5 to 9       10 to 19
                                                                      20 to 29     30 to 39     40 to 49
               100.0
                                                                      50 to 59     60 to 69     70 to 79
                                                                      80+
                80.0
% positivity

                60.0

                40.0

                20.0

                 0.0
                       5   7   9   11 13 15 17 19 21 23 25 27 29 31 33 35 37 39 41 43 45 47 49 51   1   3
                                                            Week number

    1 February 2023                                                                                         9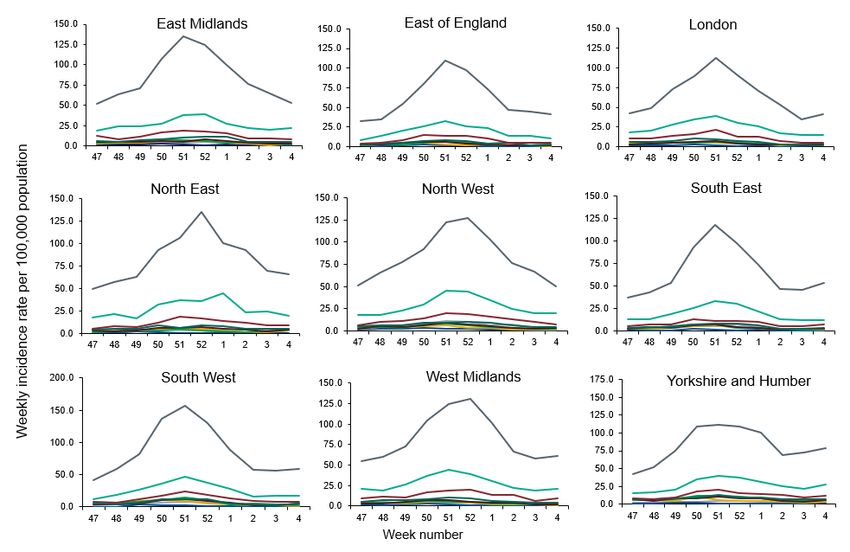
Weekly PCR positivity (%) of confirmed COVID-19 cases tested under Pillar 2, by
                               female and age group

               100.0
                                                                0 to 4     5 to 9     10 to 19
                90.0                                            20 to 29   30 to 39   40 to 49

                80.0                                            50 to 59   60 to 69   70 to 79
                                                                80+
                70.0

                60.0
% positivity

                50.0

                40.0

                30.0

                20.0

                10.0

                 0.0
                       5   7    9   11 13 15 17 19 21 23 25 27 29 31 33 35 37 39 41 43 45 47 49 51   1   3
                                                              Week number

1 February 2023                                                                                              10
Weekly confirmed COVID-19 case rates by episode, per 100,000
population (Pillar 2), by UKHSA centres and sample week
3,000
East Midlands
East of England
2,500 London
Rates per 100,000 population
North East
North West
2,000
South East
South West
1,500 West Midlands
Yorkshire and Humber
1,000
500
0
5 7 9 11 13 15 17 19 21 23 25 27 29 31 33 35 37 39 41 43 45 47 49 51 1 3
Week number
1 February 2023 11Weekly PCR positivity of confirmed COVID-19 cases tested under Pillar 2 (%)
by UKHSA centres and sample week
65.0
East Midlands
60.0 East of England
55.0 London
North East
50.0
North West
45.0 South East
40.0 South West
% positivity
35.0 West Midlands
Yorkshire and the Humber
30.0
25.0
20.0
15.0
10.0
5.0
0.0
5 7 9 11 13 15 17 19 21 23 25 27 29 31 33 35 37 39 41 43 45 47 49 51 1 3
Week number
1 February 2023 12Weekly incidence per 100,000 population by ethnicity (Pillar 2), England
1,000.0 White Indian (Asian or Asian British)
Black / African / Caribbean / Black British Pakistani (Asian or Asian British)
900.0 Other Asian / Asian British Mixed / Multiple ethnic groups
Other ethnic group
800.0
Incidence rate per 100,000 population
700.0
600.0
500.0
400.0
300.0
200.0
100.0
0.0
5 7 9 11 13 15 17 19 21 23 25 27 29 31 33 35 37 39 41 43 45 47 49 51 1 3
Week number
1 February 2023 13Weekly COVID-19 episodes tested under Pillar 1, per 100,000 population by age
group and region, weeks 47 to 4
14
1 February 2023Weekly COVID-19 episodes tested under Pillar 2, per 100,000 population by age
group and region, weeks 47 to 4
1 February 2023 15Weekly COVID-19 episodes tested under Pillar 1, per 100,000 population by
ethnicity and region, weeks 47 to 4
16
1 February 2023Weekly COVID-19 episodes tested under Pillar 2 per 100,000 population by
ethnicity and region, weeks 47 to 4
1 February 2023 17Weekly COVID-19 rate tested under Pillar 1, per 100,000 population by IMD
quintile (1 being the most deprived and 5 being the least deprived)
200.0
175.0 IMD Q1
IMD Q2
Case rate per 100,000 population
150.0 IMD Q3
IMD Q4
125.0
IMD Q5
100.0
75.0
50.0
25.0
0.0
42454851 1 4 7 101316192225283134374043464952 3 6 9 1215182124273033363942454851 2
Week Number
18
1 February 2023*incidence rates have been calculated using the mid-2019 ONS population estimatesWeekly COVID-19 rate tested under Pillar 2, per 100,000 population by IMD
quintile (1 being the most deprived and 5 being the least deprived)
2,800.0
IMD Q1
2,400.0 IMD Q2
Case rate per 100,000 population
IMD Q3
2,000.0 IMD Q4
IMD Q5
1,600.0
1,200.0
800.0
400.0
0.0
42454851 1 4 7 101316192225283134374043464952 3 6 9 1215182124273033363942454851 2
Week Number
1 February 2023 19Weekly rate of COVID-19 episodes per 100,000 population (Pillar 2), by upper-tier
local authority, England (box shows enlarged map of London area)
1 February 2023 20Respiratory Datamart system (England)
21
1 February 2023Respiratory DataMart – Influenza subtypes
22
1 February 2023Respiratory DataMart – Respiratory syncytial virus (RSV)
23
1 February 2023Respiratory DataMart – Respiratory syncytial virus
(RSV) weekly positivity by UKHSA region
25.0
North of England
Proportion positive (%)
South of England
20.0
London
15.0 Midlands and East of England
10.0
5.0
0.0
42 46 50 1 5 9 13 17 21 25 29 33 37 41 45 49 1 5 9 13 17 21 25 29 33 37 41 45 49 1
Week number
24
1 February 2023Respiratory DataMart – other respiratory viruses
25
1 February 2023Second generation surveillance system
(SGSS)
26
1 February 2023SGSS reported Influenza A cases by region (all ages)
The presented figures are based on laboratory reports through SGSS. Testing and reporting procedures
vary by virus, UKHSA centre and over time, including short-term trends in testing. Therefore
1 February 2023 comparisons should be done with caution. 27
Previously, this data was presented by report date however is now presented by specimen date.SGSS reported Influenza B cases by region (all ages)
The presented figures are based on laboratory reports through SGSS. Testing and reporting procedures
vary by virus, UKHSA centre and over time, including short-term trends in testing. Therefore
1 February 2023 comparisons should be done with caution. 28
Previously, this data was presented by report date however is now presented by specimen date.SGSS reported RSV cases by region (all ages)
The presented figures are based on laboratory reports through SGSS. Testing and reporting procedures vary by virus,
UKHSA centre and over time, including short-term trends in testing. Therefore comparisons should be done with caution.
Previously, this data was presented by report date however is now presented by specimen date. 29
1 February 2023SGSS reported Adenovirus cases by region (all ages)
The presented figures are based on laboratory reports through SGSS. Testing and reporting procedures vary by virus,
30
UKHSA centre and over time, including short-term trends in testing. Therefore comparisons should be done with caution.
1 February 2023SGSS reported Parainfluenza cases by region (all ages)
The presented figures are based on laboratory reports through SGSS. Testing and reporting procedures vary by virus,
UKHSA centre and over time, including short-term trends in testing. Therefore comparisons should be done with 31
1 February 2023 caution.SGSS reported Rhinovirus cases by region (all ages)
The presented figures are based on laboratory reports through SGSS. Testing and reporting procedures vary by virus,
32
UKHSA centre and over time, including short-term trends in testing. Therefore comparisons should be done with caution.
1 February 2023SGSS reported hMPV cases by region (all ages)
The presented figures are based on laboratory reports through SGSS. Testing and reporting procedures vary by virus,
UKHSA centre and over time, including short-term trends in testing. Therefore comparisons should be done with caution. 33
1 February 2023SGSS reported RSV cases by region (all ages)
The presented figures are based on laboratory reports through SGSS. Testing and reporting procedures vary by virus,
UKHSA centre and over time, including short-term trends in testing. Therefore comparisons should be done with caution. 34
1 February 2023Community surveillance
35
1 February 2023Acute respiratory infection (ARI) outbreaks linked to educational settings
Data Information
• We report on new acute respiratory infection (ARI) incidents reported to UKHSA Health Protection Teams (HPTs) and entered
on HPZone in the previous reporting week by setting and locality.
• Daily and weekly aggregated surveillance reports are extracted from HPZone to generate the line listing.
• The weekly extracts include incidents reported in the previous epidemiological week (Monday to Sunday) by locality and
context (setting e.g. school)
• The ARI incidents captured on HPZone represent a subset of all ongoing clusters and outbreaks in England rather than an
exhaustive listing.
• SARS-CoV2 testing policies and public health guidance for different settings changed over time. This means that any
interpretation of seasonal and temporal trends since March 2020 should take this into account.
•
• From week 14 2022 all reported outbreaks are considered suspected, in line with changes in reporting and the
implementation of the living with COVID-19 plan. (Prior to this, individual cases notes for situations associated with
educational settings were reviewed by an epidemiologist and an assessment made about whether the criteria for a confirmed
COVID-19 cluster or outbreak were met).
• The ARI definition includes presentations of both of influenza-like illness (ILI) and other acute viral respiratory infections
(AVRI). Causal pathogens can include Influenza A and B, Respiratory Syncytial Virus (RSV), adenovirus, rhinovirus,
parainfluenza, human metapneumovirus (hMPV) and SARS-CoV-2.
• For further info please contact: respscidsc@ukhsa.gov.uk
36
1 February 2023Number of acute respiratory infection outbreaks reported to UKHSA by
type of educational setting, England
40
College/University
Number of acute respiratory infection incidents
Special Educational Needs (SEN)
schools
Combined
Secondary School
20 Primary School
Nursery
0
35 36 37 38 39 40 41 42 43 44 45 46 47 48 49 50 51 52 1 2 3 4
Report Week
37
1 February 2023Number of acute respiratory infection outbreaks by type of educational
setting, England
End of academic year total
Week 35 2021- 34 2022
Cumulative number of suspected acute respiratory infection outbreaks by type of educational setting for the 2021/22 academic year Week 35 2021- 35 2022
UKHSA Centres Special Educational Needs
Nursery Primary School Secondary School Combined College University Total
(SEN) schools
Total 540 1761 596 161 1306 59 4423
Week 04 2023
Main table
* Number of acute respiratory infection for the most recent week in brackets
38
1 February 2023Primary Care surveillance
39
1 February 2023 Return to main menuLast updated
Proportion of detections of SARS-CoV-2, influenza and other respiratory 15 December
viruses amongst virologically-positive respiratory surveillance samples in 2022
primary care in England by week
Since October 2021 the UKHSA Respiratory Virus Unit has been undertaking extended respiratory virus
testing of samples submitted from primary care surveillance, covering the viruses listed in the figure.
Samples which test positive are summed and presented in the figure to indicate recent trends in detections.
Source: RCGP Research and Surveillance Centre sentinel primary care practices and the UKHSA Respiratory Virus Unit
40
1 February 2023Secondary Care surveillance
41
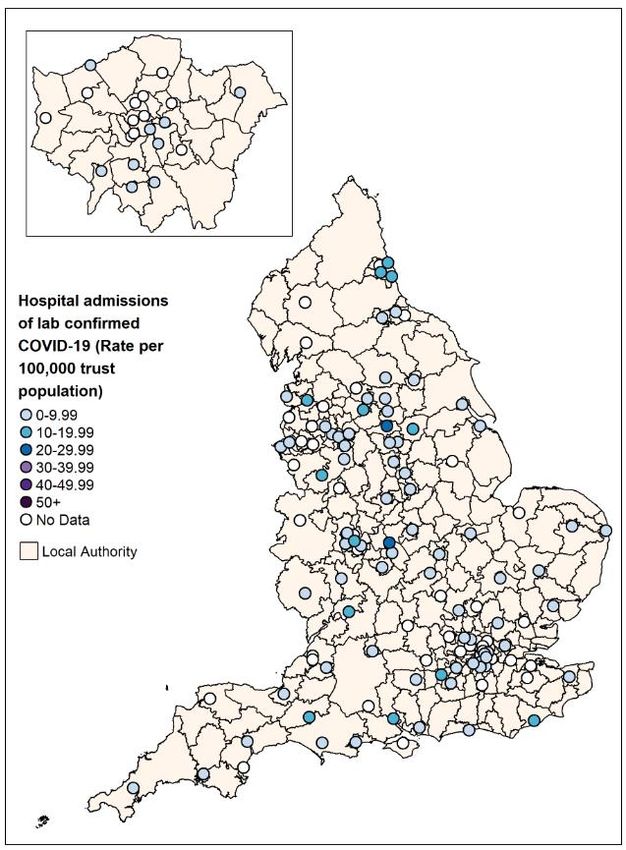
1 February 2023 Return to main menuWeekly admission rates for hospital and ICU/HDU laboratory confirmed
COVID-19 cases reported through SARI Watch, week 04
Source: UKHSA SARI-Watch (Severe Acute Respiratory Infection-Watch, formerly CHESS).
*Only NHS Acute trusts that have reported ≥1 day in the past week; excludes Specialist trusts. Acute NHS trusts (including Specialist trusts) reporting into SARI-Watch COVID-19
hospitalisation surveillance are typically around 100 per week. This was 88 for the hospitalisation (all levels of care) indicator in week 23 January 2023 to 29 January inclusive and 78 trusts
for the ICU/HDU indicator. For the maps, as Specialist trusts are excluded, the number of trusts providing data on COVID-19 hospitalisations in week ending 29 January 2023 was 79 and
70 for ICU/HDU admissions for COVID-19.
42
1 February 2023Weekly COVID-19 hospitalisation rate per 100,000 trust catchment population by
age group and region, weeks 47 to 04
43
1 February 2023Last updated 08
Hospital admission rate (excluding ICU/HDU) by ethnicity per 100,000 December 2022
trust catchment population, by month
140.0
Per 100,000 Ethnicity-specific Trust Catchment Population
120.0
100.0
80.0
60.0
40.0
20.0
0.0
Mar 2020 Aug 2020 Jan 2021 Jun 2021 Nov 2021 Apr 2022 Sep 2022
Month
White Asian Black Mixed Other
Caveat: From week 24 (2021) the ethnicity analysis is based on a new method for assigning ethnicity, developed by UKHSA. The previous method used the most recent
ethnicity recorded through linkage to Hospital Episode Statistics. However, this method led to unfeasibly high rates in the ‘Other’ ethnic group when applied to COVID-
19 cases, hospitalisation or mortality. The new method uses the most frequent ethnicity recorded through linkage to Hospital Episode Statistics, unless the most
frequent was ‘Other’ when the second most frequent was chosen.
44
1 February 2023Last updated 08
Rate of admission to ICU/HDU by ethnicity, per 100,000 trust catchment December 2022
population, by month
40.0
Per 100,000 Ethnicity-specific Trust Catchment Population
35.0
30.0
25.0
20.0
15.0
10.0
5.0
0.0
Mar 2020 Aug 2020 Jan 2021 Jun 2021 Nov 2021 Apr 2022 Sep 2022
Month
White Asian Black Mixed Other
Caveat: From week (24 2021) the ethnicity analysis is based on a new method for assigning ethnicity, developed by UKHSA. The previous method used the most recent
ethnicity recorded through linkage to Hospital Episode Statistics. However, this method led to unfeasibly high rates in the ‘Other’ ethnic group when applied to COVID-
19 cases, hospitalisation or mortality. The new method uses the most frequent ethnicity recorded through linkage to Hospital Episode Statistics, unless the most
frequent was ‘Other’ when the second most frequent was chosen.
45
1 February 2023Last updated 26
COVID-19 as primary reason for admission among SARS-CoV-2 positive January 2023
patient by week of admission
100%
80%
60%
40%
20%
0%
2021.35 (n=392)
2021.39 (n=328)
2021.43 (n=471)
2021.47 (n=351)
2021.51 (n=555)
2022.03 (n=644)
2022.07 (n=420)
2022.11 (n=759)
2022.15 (n=521)
2022.19 (n=179)
2022.23 (n=210)
2022.27 (n=488)
2022.31 (n=189)
2022.39 (n=259)
2022.43 (n=134)
2022.47 (n=108)
2022.51 (n=271)
2022.35(n=139)
2023.03 (n=80)
No Yes
Notes
1) Case-level sentinel data from SARI-Watch, form week 35 2021 (commencing 30 August 2021) to week 03 2023 (ending 22
January 2023) inclusive
2) Total 32,388 records in period of analysis, of which 33% (n=10,650) had COVID-19 as primary reason for admission ('Yes').
3) SARS-CoV-2 patients with evidence of COVID-19 treatment (antivirals or respiratory support) or COVID-19 death but have 'No' or
'Unknown' for COVID-19 as primary reason for admission (n=2,948) are reassigned to COVID-19 as primary reason of admisison
('Yes').
4) Reassignment increases COVID-19 as primary reason for admission ('Yes') from 10,650 to 13,598
5) 22% (7,089/32,888) of total records in this period have missing data on the ‘Admission due to COVID-19’ indicator – these are
excluded from analysis
6) Caveats: London trusts under-represented and most recent weeks are subject to retrospective updates
1 February 2023 46SARS-CoV-2 Whole Genome Sequencing (WGS)
coverage, England
47Last updated
19 January
Coverage of sequencing with a valid result and genotyping 2023
over time (16 January 2022 to 16 January 2023)
Episodes where the individual only tested using a lateral flow device are excluded. Grey shading was applied to the previous 14 days to
account for reporting delays in sequencing data 48Preceding, co- and secondary infections in
COVID-19 and influenza patients in England,
Jul 2022 – Jan 2023
HCAI, Fungal, AMR, AMU & Sepsis Division
HCAI, Fungal, AMR, AMU & Sepsis DivisionPreceding/co-/secondary infections with COVID-19 Background • Numbers of preceding/co-/secondary infection remain low across UKHSA surveillance systems. • Free community testing ended 31 March 2022 as part of the government’s Living with COVID-19 plan, with asymptomatic testing continuing in some settings. As of 31 August 2022, asymptomatic testing in all settings, including hospitals, has been paused. Please use caution when comparing incidence of bacterial, fungal and viral preceding/co-/secondary infections with COVID-19 over time due to these differences in testing strategies. • Published data analyses from pandemic wave 1 indicates increased mortality associated with COVID-19 and influenza, key bacterial and fungal infections and invasive pneumococcal disease (IPD) in comparison to patients without co/secondary infection. • Data analysis from wave 1 indicates that Aspergillus and candidemia cases had increased risk of mortality in comparison to patients without co/secondary infection. • For patients with severe respiratory failure requiring Extra Corporeal Membrane Oxygenation (ECMO), analysis of data from six adult ECMO centres in England indicates that among patients with severe respiratory failure due to COVID-19, clinically significant co/secondary infections were detected in 33% initially, rising to 40% in the 2021-22 season. In the current season (2022-23), influenza is now the predominant cause of severe respiratory failure, with more than two thirds having co/secondary infections detected. There have been no reports of COVID-19 admissions requiring ECMO since September 2022. 1 February 2023 50
Surveillance of bacterial, fungal and respiratory viral infections,
         in COVID-19 and influenza patients in England
Data information
• Data are provisional and subject to change due to possible delayed reporting of microbiological
  samples
• Relative undertesting for other pathogens may result in an underestimate of preceding/co-
  /secondary infection cases. In addition, testing varies between pathogens therefore caution should
  be used in comparing preceding/co-/secondary infection rates between different pathogens
• Preceding/co-/secondary infections refers to when a patient has a COVID-19 or influenza infection
  with one or more other pathogen (Please see Appendix 1 – Preceding/co-/secondary infection
  definitions.)
    – Preceding infection: SARS-CoV-2 or influenza detected after another pathogen
    – Co-infection: SARS-CoV-2 or influenza and other pathogen detected at the same time
    – Secondary infection: SARS-CoV-2 or influenza detected before another pathogen
• The following outputs included in this section have been produced via the Unified Infection Dataset
  (UID)
• Bacterial, fungal and respiratory viral infection data sources:
    – Fungal, bacterial and respiratory viral data (excluding Clostridioides difficile, Invasive
       pneumococcal disease & Haemophilus influenzae): Second Generation Surveillance System
       (SGSS)
    – Respiratory viral data: Respiratory Datamart
    – Clostridioides difficile: HCAI Data Capture System
    – Invasive pneumococcal disease: reference lab
    – Haemophilus influenzae: reference lab
1 February 2023                                                                                     51
Co/secondary infections among patients with severe respiratory
failure requiring Extra Corporeal Membrane Oxygenation (ECMO)
Analysis is based on cumulative data from six adult ECMO centres in England. Surveillance is all year
round. Each season commences around October (ISO week 40) ending in September (ISO week 39) in the
following year.
Current season 2022-23
• Data is from 3 October 2022 to 1 January 2023 inclusive (weeks 40 to 52). In this period there was a total of
64 admissions across SRFs requiring ECMO.
• Of 64, 43 were for laboratory confirmed acute respiratory infection (ARI) including n=31 influenza, n=3 RSV,
n=3 S. pyogenes (Group A streptococcus), the remaining n=6 due to other infection aetiologies. There were
no COVID-19 admissions in this season.
• Of 43 lab confirmed ARI, 56% (n=24) had clinically significant co/secondary infections reported:
– Of 31 influenza cases, 68% (n=21) had co/secondary infections including n=9 GAS and n=4 S.
aureus.
– As comparison: co/secondary infections accounted for 43% of influenza cases in 2019-20 and 49% in
both 2018-19 and 2017-18 seasons
– In total this season, 10 GAS co/secondary infections were detected among 43 lab confirmed ARI.
Prior season 2021-22
Data is from 4 October 2021 to 2 October 2022. 34% (33/96) of all laboratory confirmed ARI admitted to SRFs
requiring ECMO had clinically significant co/secondary infections. 80% (77/96) of laboratory confirmed
ARI were due to COVID-19. Among COVID-19 admitted cases, 40% (31/77) had clinically significant
co/secondary infections reported.
1 February 2023 52Number of COVID-19 patient-episodes with bacterial, fungal or respiratory viral
infections in COVID-19 patients diagnosed in England from ISO week 27 of
2022*, by infection type and timing of diagnosis
COVID-19
Timing of bacterial/fungal/viral diagnosis in relation to Key findings:
patient- COVID-19 diagnosis
episodes
• 0.84% of COVID-
with 19 patient-
Bacterial/ fungal/ viral infection Secondary
bacterial/ Preceding infection Coinfection episodes had a
by specimen type infection
fungal/ viral bacterial, fungal or
infection
other respiratory
% of % % of % % of % % of viral infection
n COVID
cases
n infections COVID
by site cases
n infections COVID
by site cases
n infections COVID
by site cases
detected in either
the 28 days prior or
Bacterial/fungal bloodstream & following their
60 0.01 17 28.33Most frequent bacterial/fungal species in blood or lower respiratory tract
specimens, by timing of diagnosis, in COVID-19 patients diagnosed in England
from ISO week 27 of 2022
Blood Lower respiratory tract
2000 500
1800 450
1600 400
pre-/co/secondary infection
pre-/co-/secondary infection
1400 350
No. bacterial/fungal
No. bacterial/fungal
1200 300
1000 250
800 200
600 150
400 100
200 50
0 0
Please note different y-axes
Key findings:
From ISO week 27 of 2022, the most frequent bacterial/fungal organisms identified from blood specimens were
Escherichia coli, Staphylococcus aureus and Klebsiella pneumoniae and from respiratory specimens were S.
aureus, Pseudomonas aeruginosa and E. coli.
1 February 2023 54Most frequent viral specimens, by timing of diagnosis, in COVID-19 patients
diagnosed in England from ISO week 27 of 2022
2000
1800
pre-/co-/secondary infection 1600
1400
No. respiratory viral
1200
1000
800
600
400
200
0
Preceding infection Co-infection Secondary infection
Key findings:
From ISO week 27 of 2022, the most frequent viral organisms identified from respiratory specimens were influenza
A, RSV and rhinovirus.
1 February 2023 55Number of influenza patient-episodes with bacterial, fungal or
respiratory viral infections in influenza patients diagnosed in England
from ISO week 27 of 2022*, by infection type and timing of diagnosis
Influenza Timing of bacterial/fungal/viral diagnosis in relation to Key findings:
influenza diagnosis
patient- • 10.67% of influenza
episodes
with
patient-episodes had a
Bacterial/ fungal/ viral infection Secondary bacterial, fungal or
bacterial/ Preceding infection Coinfection
by specimen type** infection
fungal/ viral other respiratory viral
infection infection detected in
% of % % of % % of % % of
either the 28 days prior
n Influenza
cases
n infections Influenza
by site cases
n infections Influenza
by site cases
n infections Influenza
by site cases
or following their
influenza diagnosis.
Bacterial/fungal bloodstream
infection
828 1.31 250 30.19 0.39 354 42.75 0.56 224 27.05 0.35 • Majority of infections
with key organisms
Bacterial/fungal lower respiratory
334 0.53 61 18.26 0.10 114 34.13 0.18 159 47.60 0.25 were categorised as
infection
co-infections (64.30%).
SARS-CoV-2 infection 2,395 3.78 380 15.87 0.60 1,536 64.13 2.42 479 20.00 0.76
• Most influenza patients
Clostridioides difficile infection 29 0.05 10 34.48 0.02 5 17.24 0.01 14 48.28 0.02 with a preceding, co-
Respiratory virus infection*** 3,081 4.86 421 13.66 0.66 2,268 73.61 3.58 392 12.72 0.62 or secondary infection
with key organisms
Invasive pneumococcal disease 88 0.14 10 11.36 0.02 68 77.27 0.11 10 11.36 0.02 were categorised as 0
to 9 years old
Haemophilus influenzae infection 4 0.01 2 50.00Most frequent bacterial/fungal/respiratory viral infections, by timing of
diagnosis, in influenza patients diagnosed in England from ISO week 27 of
2022
2500
No. of pre-/co-/secondary infection episodes
2000
1500
1000
500
0
Preceding infection Co-infection Secondary infection
Key findings:
From ISO week 27 of 2022, the most frequent organisms identified were COVID-19, RSV and rhinovirus.
*The baseline infection is any type of influenza (influenza A or B or both) for all bacterial/fungal/respiratory viral preceding/co-/secondary infections except for
influenza B where the baseline infection is influenza A
1 February 2023 57Appendix 1: Pre-/co-/secondary infection definitions
The day pertains to the date of the sample collection that yielded a positive result. These definitions do not apply to persistent
COVID-19 patients. Patients with persistent COVID-19 require independent clinical assessment.
Definition of infection pre-SARS-CoV-2/influenza infection (other pathogen is primary
infection)
Definition co-infection with SARS-CoV-2/influenza
Organism or
†
Definition of post SARS-CoV-2/influenza secondary infection (SARS-CoV-2/influenza is
primary infection)
Influenza A +/- 1d 2-28d^
Influenza B +/- 1d 2-28d^
RSV +/- 1d 2-28d
Adenovirus +/- 1d 2-28d
Enterovirus +/- 1d 2-28d
Human metapneumovirus +/- 1d 2-28d
Parainfluenza (any subtype) +/- 1d 2-28d
Seasonal coronavirus +/- 1d * 2-28d
Rhinovirus +/- 1d 2-28d
Co-infections in ECMO patient (patients with most severe clinical respiratory signs)
ECMO patients Individual case review Individual case review
Blood stream and respiratory infections (bacterial and fungal)
Achromobacter xylosoxidans +/- 1d 2-28d
Acinetobacter spp., +/- 1d 2-28d
Aspergillus +/- 1d 2-28d (pre) 2-60d (post, continually hospitalised patients only)
Bordetella pertussis +/- 28 d Culture/PCR (based on pertussis sample N/A (Pertussis presentation is often delayed)
date)
+/- 28 Serology/Oral fluid (anti-pertussis toxin Ig)
(based on pertussis symptom onset date, excluding
cases without onset date)
Burkholderia cepacia +/- 1d 2-28d
Candida spp +/- 1d 2-28d (pre) 2-60d (post, continually hospitalised patients only)
Chlamydia pneumoniae 0-7d PCR PCR within 14-28 d (8-13d PCR*)
Enterobacter spp., +/- 1d 2-28d
Enterococcus spp. +/- 1d 2-28d
E. coli +/- 1d 2-28d
Haemophilus influenzae +/- 2d 3-28d
Continued overleaf
1 February 2023 58Appendix 1 continued: Pre-/co-/secondary infection definitions
The day pertains to the date of the sample collection that yielded Definition of infection
a positive pre-SARS-CoV-2/influenza
result. These definitions infection
do (other pathogen
not apply to is primary
infection)
Definition co-infection
persistent COVID-19 patients. Patients withwith SARS-CoV-2/influenza
persistent COVID-19 require independent clinical assessment.
Organism or
†
Definition of post SARS-CoV-2/influenza secondary infection (SARS-CoV-2/influenza is
primary infection)
Blood stream and respiratory infections (bacterial and fungal)
Klebsiella spp. +/- 1d 2-28d
Legionella pneumophila/species Individual case review Individual case review
Mycoplasma pneumoniae 0-7d PCR, IgM serology 0-21dAppendix 1 continued: Pre-/co-/secondary infection definitions
Notes
† From the first specimen date of a SARS-CoV-2/influenza patient episode.
* Additional data check required. (Resistance is not detailed, data for MERS is not currently available).
^ Definition post- SARS-CoV-2 secondary infection (SARS-CoV-2 is primary infection).This has been extended from prior
14d secondary infection definition for influenza used by UKHSA to account for disparities in testing throughout the 28d
period after SARS-CoV-2 detection.
‡ Streptococcus species includes the following groups and species:
Group Species/other names
Anginosus Group Streptococcus anginosus; Streptococcus constellatus (Streptococcus constellatus subspecies constellatus Streptococcus
constellatus subspecies pharynges); Streptococcus Group F; Streptococcus intermedius; Streptococcus milleri group;
Streptococcus sinensis
Bovis Group Streptococcus alactolyticus; Streptococcus bovis untyped; Streptococcus equinus; Streptococcus gallolyticus subspecies
gallolyticus (Streptococcus bovis biotype I); Streptococcus infantarius (Streptococcus infantarius sp infantarius; Streptococcus
bovis biotype II); Streptococcus lutetiensis; Streptococcus infantarius subspecies coli (Streptococcus bovis biotype II);
Streptococcus pasteurianus (Streptococcus bovis biotype II)
Closely Related Genera Abiotrophia spp.; Aerococcus spp.; Faklamia spp.; Gemella spp.; Globicatella sanguinis; Granulicatella spp.; Leuconostoc
spp.; Pedicoccus spp.; Peptostreptococcus spp.
Mitis Group Streptococcus cristatus; Streptococcus mitior; Streptococcus mitis; Streptococcus oralis; Streptococcus pseudopneumoniae;
Streptococcus infantis; Streptococcus peroris
Mutans Group Streptococcus mutans; Streptococcus sobrinus
Other streptococci (including but not Anaerobic streptococcus; Streptococcus acidominimus; Streptococcus spp., other named/not fully identified; Streptococcus
limited to) suis; Streptococcus uberis
Salivarius Group Streptococcus vestibularis; Streptococcus thermophilus
Sanguinis Group Streptococcus gordonii; Streptococcus massiliensis; Streptococcus parasanguinis; Streptococcus sanguinis
Streptococcus Group A Group A; Streptococcus pyogenes; Streptococcus dysgalactiae subspecies equisimilis
Streptococcus Group B Group B; Streptococcus agalactiae
Streptococcus Group C Group C; Streptococcus dysgalactiae subspecies equisimilis; Streptococcus equi subspecies zooepidemicus
Streptococcus Group G Group G; Streptococcus canis; Streptococcus dysgalactiae subspecies equisimilis
1 February 2023 60You can also read