Weekly Market Guide - Raymond James
←
→
Page content transcription
If your browser does not render page correctly, please read the page content below
PORTFOLIO STRATEGY | PUBLISHED BY
RAYMOND JAMES & ASSOCIATES
Michael Gibbs, Director of Equity Portfolio & Technical Strategy | (901) 579-4346 | michael.gibbs@raymondjames.com DECEMBER 17, 2020 | 5:11 PM EST
Joey Madere, CFA | (901) 529-5331 | joey.madere@raymondjames.com
Richard Sewell, CFA | (901) 524-4194 | richard.sewell@raymondjames.com
Mitch Clayton, CMT, Senior Technical Analyst | (901) 579-4812 | mitch.clayton@raymondjames.com
Weekly Market Guide
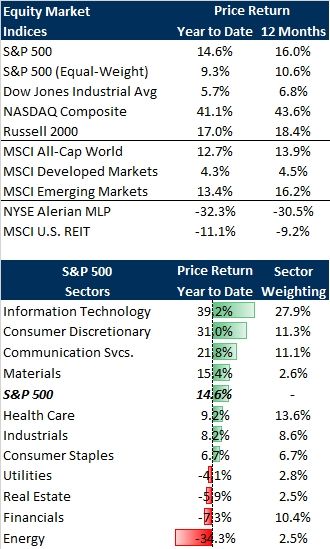
Equity markets have sustained their advance with areas most levered to the economic recovery showing
the strongest momentum. The small caps have now advanced 27% since the end of October and are now
outperforming the S&P 500 year-to-date. At the sector and stock level, the hardest hit areas from the pandemic
have generally seen the greatest upside. For example, Energy and Financials (down 52% and 22% respectively
from 12/31 through October) have led the charge higher by 37% and 20% respectively since then. Also, S&P
500 stocks down 30% through October are up 36% on average since, a stark contrast to those up 30% prior to
November being up (only) 11.6%. This phenomenon, spurred by very positive vaccine data and optimism over
the recovery in 2021, is also being seen globally with a similar relationship between worst performers prior to
the vaccine news correlating with best performance since then (led by some of the hardest hit Latin America and
European countries).
The improved breadth is positive for equity market momentum over the intermediate term in our view. It has
also created a good environment for active management with better opportunities for stock selection across all
areas of the market. We recommend pro-cyclical exposure to portfolios, and believe it is important for investors
to find a balance between the areas operating best through the pandemic along with the areas most levered to
the economic recovery. Accordingly, our overweight-rated sectors are Technology, Health Care, Communication
Services, Consumer Discretionary, and Industrials.
We remain positive on equities over the next 6-12 months due to our view of 3+ vaccines allowing an economic
reopening as 2021 progresses, along with fiscal and monetary stimulus supporting the recovery and the likelihood
of interest rates remaining lower for longer. This should support an earnings recovery and allow valuation to
remain elevated (albeit lower than current levels). We maintain a base case S&P 500 target of 4025 (using $175
earnings and 23x P/E). And while the current equity momentum could continue through year end and into January,
we do want to acknowledge numerous items that could impact volatility. Fiscal talks are currently ongoing (and
we believe something likely gets done), but the absence of additional fiscal aid (with the virus surge and localized
shutdowns impacting the economy) would be a setback. Additionally, the January 5th Georgia Senate runoffs
have the potential to alter the legislative agenda dramatically in the event of a Democratic sweep. Therefore,
our overriding view remains positive on equities. But we believe it is prudent to accumulate over time and make
portfolio adjustments in a pragmatic way, particularly with new money coming in at current levels. .
INTERNATIONAL HEADQUARTERS: THE RAYMOND JAMES FINANCIAL CENTER | 880 CARILLON PARKWAY | ST. PETERSBURG FLORIDA 33716PORTFOLIO STRATEGY
MACRO: US
Investors are closely monitoring fiscal talks, where discussions are building toward
a potential fiscal aid package. Nothing is finalized yet, but reports suggest it could
in the ~$900B range and include stimulus checks, small business relief, and funding
for vaccine distribution, education, transportation, and health care- omitting the
most contentious issues surrounding state & local aid and liability protections. We
believe something likely gets done and needs to get done amidst localized
shutdowns and the ongoing virus surge. Some of the recent economic data,
showing a stall in the recovery, likely puts added pressure on government officials
to come to an agreement.
Retail sales and industrial
production slowed down
Along with fiscal stimulus, we believe central banks also remain very supportive. as localized shutdowns
This week, the Fed tweaked its message slightly with the takeaway being that occurred in November
policy will remain accommodative for a while (likely several years). The likelihood
that interest rates remain lower for longer is supportive of equity markets in our
view.
US economic data reported in the past week:
Event Period Actual Consensus Prior
PPI SA M/M NOV 0.10% 0.10% 0.30%
PPI NSA Y/Y NOV 0.76% 0.70% 0.51%
Michigan Sentiment NSA (Preliminary) DEC 81.4 76.0 76.9
Empire State Index SA DEC 4.9 7.0 6.3
Industrial Production SA M/M NOV 0.40% 0.30% 0.90% R
Retail Sales ex-Auto SA M/M NOV -0.90% 0.10% -0.10% R
Retail Sales SA M/M NOV -1.1% -0.30% -0.10% R
PMI surveys, particularly for
PMI Composite SA (Preliminary) DEC 55.7 - 58.6
Markit PMI Manufacturing SA (Preliminary) DEC 56.5 56.0 56.7
services, suggest this trend is likely
Markit PMI Services SA (Preliminary) DEC 55.3 56.5 58.4 to continue with the virus surge
NAHB Housing Market Index SA DEC 86.0 88.0 90.0 ongoing- putting added pressure
Building Permits SAAR (Preliminary) NOV 1,639K 1,550K 1,544K on Congress to pass fiscal aid
Continuing Jobless Claims SA 12/05 5,508K 5,700K 5,781K R
Housing Starts SAAR NOV 1,547K 1,525K 1,528K R
Housing Starts M/M NOV 1.2% 0.0% 6.3% R
Initial Claims SA 12/12 885.0K 800.0K 862.0K R
Philadelphia Fed Index SA DEC 11.1 20.0 26.3
Kansas City Fed Manufacturing Index DEC 14.0 8.0 11.0 Source: FactSet, Raymond James Equity Portfolio & Technical Strategy
PAGE 2 OF 13PORTFOLIO STRATEGY
FUNDAMENTALS
Investors remain focused on the expected recovery next year following encouraging
vaccine news, looking past the current virus surge and economic impact of localized S&P 500 Valuation vs
shutdowns. Q4 estimates have continued to drift higher, and while the level of beats is Bond Yield still
unlikely to match the historical surprises of Q2 and Q3 (21% average beat collectively) attractive in our view
we do expect upside. Additionally, we believe vaccinations over the coming months
(potentially 100M Americans by the end of March) should allow a reopening as 2021
progresses. This, along with unprecedented stimulus globally this year, supports an
earnings recovery that we believe can result in S&P 500 earnings of $175.
As earnings recover, valuation should begin to normalize from lofty levels. This should
see earnings grow faster than equity markets in 2021, as the S&P 500 P/E moves lower
from 26.3x currently. We use 23x as our base case P/E for 2021 and believe valuation
can remain elevated due to the likelihood that interest rates and inflation remain
lower for longer. For example, the current equity risk premium is 2.9% which is
historically elevated (0.6% long term average) and just under pre-pandemic levels, an
attractive value proposition for equities vs bonds in our view. These assumptions of
$175 earnings and a 23x P/E result in our base case S&P 500 target of 4025.
S&P 500 Consensus Earnings Estimates over Past Year
2019 2020 2021 2022
240 EPS Growth
Estimates
220
2019 1.5%
200 196.18 2020 -14.5%
180
2021 21.9%
168.14 2022 16.7%
160
140 137.90 2021 estimates
120
continue upward trend-
similar to recovery out
of last two recessions
Source: FactSet, Raymond James Equity Portfolio & Technical Strategy
PAGE 3 OF 13PORTFOLIO STRATEGY
TECHNICAL: S&P 500
A very brief consolidation with rolling pullbacks
S&P 500 pulling back after
beneath the surface may have been the seasonal
reaching technical resistance in
weakness typically seen in the first couple weeks of
the 3532-3566 area
December. With positive vaccine news (Pfizer vaccine
EUA and Moderna vaccine EUA expected tomorrow)
and momentum building toward a fiscal aid package,
equities could remain seasonally strong through year
S&P 500 3-month base end.
breakout remains the
dominant technical force The base break out to new highs remains the
dominant force technically, and the three-month
base could make the current wave last longer and to
a greater degree. We continue to watch the 3710 area
for initial technical resistance, followed by 3753 and
3876. The first area of substantial support should be
found around 3588, followed by the 50 DMA (currently
3546).
Brief consolidation
indicative of strong
upward trend
Source: FactSet, Raymond James Equity Portfolio & Technical Strategy
PAGE 4 OF 13PORTFOLIO STRATEGY
SEASONALITY
We have been mentioning in previous reports that it is not uncommon for the seasonally strong November-December period to experience a pause in the first
couple of weeks in December. For the S&P 500, there was a slight consolidation with rolling pullbacks beneath the surface. With the breakout above this range,
seasonal strength could see the equity market momentum continue through year end. However a runaway to the upside is less likely given the degree of gains off
the November low. The January-February period is the next logical potential pullback period and makes sense considering optimism is running high right now, the
January 5th Georgia Senate runoffs will be closely monitored, and there could always be setbacks to the vaccine narrative (i.e. distribution, capacity issues).
Jan-Feb period next logical Was that our seasonal pause?
potential pullback period
Source: FactSet, Raymond James Equity Portfolio & Technical Strategy
PAGE 5 OF 13PORTFOLIO STRATEGY
S&P 500 TREND OUT OF RECESSIONS
In an attempt to put the current market ascent into perspective, we look to previous recoveries out of recessions. The last two recessions (2009 and 2003), along
with 1982 are shown below. As you can see, the rate of ascent and path out of the recessionary bear market low has tracked very similarly to the 2009 and 1982
periods. The 2003 recovery did not gain to the same extent but followed a similar path as well. Interestingly, these three prior periods saw gains continue for
another month or so beyond the current point before becoming a bit more choppy. We do not recommend investing solely based on historical trends, but it is
something to keep in mind. The rate of ascent has been phenomenal, but a healthy consolidation period with pullbacks as the market digests these gains is likely to
occur at some point in the coming months.
Source: FactSet, Raymond James Equity Portfolio & Technical Strategy
PAGE 6 OF 13PORTFOLIO STRATEGY
DISTANCE FROM 200 DAY MOVING AVERAGE SETS THE TABLE FOR A PAUSE
Equities have gotten extended above their 200 day moving average, following the surge higher since October. The S&P 500 is 16% above its 200 day moving average
and the small cap index is 30% above its 200 DMA. These surges are what we have been looking for and expecting (in the early stages of a new bull market), but it is
also historically common for the market to digest these gains over a period of time after reaching these levels. This was seen in the early stages of 2003/2004
recovery, as well as the 2009/2010 recovery. We believe a digestion period would be healthy for the market and also a good buying opportunity.
4%, 5%, and 6%
pullbacks
Source: FactSet, Raymond James Equity Portfolio & Technical Strategy
PAGE 7 OF 13PORTFOLIO STRATEGY
ROTATION
Equity markets have sustained their advance with areas most levered to the economic recovery showing the strongest momentum. At the sector and stock level,
the hardest hit areas from the pandemic have generally seen the greatest upside since the positive vaccine news. For example, Energy and Financials (down 52%
and 22% respectively from 12/31 through October) have led the charge higher by 37% and 20% respectively since October. Also, S&P 500 stocks down 30% through
October are up 36.8% on average since, a stark contrast to those up 30% prior to November being up (only) 11.8%. The improved breadth is positive for equity
market momentum over the intermediate term in our view. It has also created a good environment for active management with better opportunities for stock
selection across all areas of the market. We recommend pro-cyclical exposure to portfolios, and believe it is important for investors to find their appropriate balance
between the areas operating best through the pandemic along with the areas most levered to the economic recovery. Accordingly, our overweight-rated sectors are
Technology, Health Care, Communication Services, Consumer Discretionary, and Industrials.
S&P 500 Sector 12/31 - 10/31/2020 Since 10/30/2020
Energy -52.5% 37.6%
Financials -22.5% 20.1%
Industrials -6.8% 16.6%
Areas most impacted by the
Information Technology 20.9% 15.7%
pandemic have seen outsized
S&P 500 1.2% 13.8%
gains since the vaccine news
Materials 2.9% 13.5%
Communication Services 8.2% 12.0% Don’t forget about
Health Care -0.3% 10.8% Tech though-
Consumer Discretionary 18.8% 10.7% holding its own
Consumer Staples -1.2% 8.6%
Real Estate - -12.0% 8.1%
Utilities -3.5% 0.4%
Stock Returns
1/1-10/31/20 Since 10/31
30% 11.77%
Source: FactSet, Raymond James Equity Portfolio & Technical Strategy
PAGE 8 OF 13PORTFOLIO STRATEGY
CONSUMER DISCRETIONARY AND INDUSTRIALS
We recommend accumulating select names in Consumer Discretionary. The The industrials remain our favored “recovery” area currently. The
sector has leverage to the economic recovery, and low interest rates and oil manufacturing backdrop continues to improve globally, and low inventories are
prices remain supportive. Additionally, we believe something gets done on fiscal likely to support a continuation of this trend. The group has consolidated
stimulus which will be a boost to the consumer. slightly, and we would use the opportunity to accumulate favored names near
support levels.
Source: FactSet, Raymond James Equity Portfolio & Technical Strategy
PAGE 9 OF 13PORTFOLIO STRATEGY
ENERGY
Oil prices have risen by 35% (to 48.42/bbl from 35.79/bbl) since October. The move started on the likelihood of a divided Congress following the election results and
surged higher on the positive vaccine news. This has created optimism toward an economic reopening as 2021 progresses, along with a more difficult path to
legislative changes. Accordingly, the Energy sector has surged 37% higher since then. We maintain an underweight recommendation to the Energy sector and are
not yet convinced that investors should allocate a substantial portion of their portfolios to the sector. However, we do view the sector as a fertile area for aggressive
traders, given volatility and fundamental/sentiment challenges keeping the risk level high. Aggressive traders that are willing to accept the likelihood of elevated
volatility, look to accumulate favored names as they consolidate some of their recent strength near support levels. For oil prices, after breaking out of its past
several month range, watch technical resistance at ~50/barrel.
Source: FactSet, Raymond James Equity Portfolio & Technical Strategy
M20-3375800
PAGE 10 OF 13PORTFOLIO STRATEGY
IMPORTANT INVESTOR DISCLOSURES
This material is being provided for informational purposes only. Expressions of opinion are provided as of the date above and subject to change. Any information should not
be deemed a recommendation to buy, hold or sell any security. Certain information has been obtained from third-party sources we consider reliable, but we do not guarantee
that such information is accurate or complete. This report is not a complete description of the securities, markets, or developments referred to in this material and does not
include all available data necessary for making an investment decision. Prior to making an investment decision, please consult with your financial advisor about your individual
situation. Investing involves risk and you may incur a profit or loss regardless of strategy selected. There is no guarantee that the statements, opinions or forecasts provided
herein will prove to be correct.
Sector investments are companies engaged in business related to a specific sector. They are subject to fierce competition and their products and services may be subject to
rapid obsolescence. There are additional risks associated with investing in an individual sector, including limited diversification.
Commodities and currencies investing are generally considered speculative because of the significant potential for investment loss. Their markets are likely to be volatile and
there may be sharp price fluctuations even during periods when prices overall are rising.
Links to third-party websites are being provided for informational purposes only. Raymond James is not affiliated with and does not endorse, authorize, or sponsor any of
the listed websites or their respective sponsors. Raymond James is not responsible for the content of any third-party website or the collection or use of information regarding
any websites users and/or members.
This report is provided to clients of Raymond James only for your personal, noncommercial use. Except as expressly authorized by Raymond James, you may not copy,
reproduce, transmit, sell, display, distribute, publish, broadcast, circulate, modify, disseminate, or commercially exploit the information contained in this report, in printed,
electronic, or any other form, in any manner, without the prior express written consent of Raymond James. You also agree not to use the information provided in this report for
any unlawful purpose. This report and its contents are the property of Raymond James and are protected by applicable copyright, trade secret, or other intellectual property
laws (of the United States and other countries). United States law, 17 U.S.C. Sec. 501 et seq, provides for civil and criminal penalties for copyright infringement. No copyright
claimed in incorporated U.S. government works.
Index Definitions
The S&P 500 is an unmanaged index of 500 widely held stocks that is generally considered representative of the U.S. stock market.
The Dow Jones Industrial Average (DJIA) is a price-weighted average of 30 significant stocks traded on the New York Stock Exchange (NYSE) and the NASDAQ.
The NASDAQ Composite is a stock market index of the common stocks and similar securities listed on the NASDAQ stock market.
The MSCI World All Cap Index captures large, mid, small and micro-cap representation across 23 Developed Markets (DM) countries. With 11,732 constituents, the index is
comprehensive, covering approximately 99% of the free float-adjusted market capitalization in each country.
The MSCI EAFE (Europe, Australasia, and Far East) is a free float-adjusted market capitalization index that is designed to measure developed market equity performance,
excluding the United States & Canada. The EAFE consists of the country indices of 21 developed nations.
The MSCI Emerging Markets Index is designed to measure equity market performance in 23 emerging market countries. The index's three largest industries are materials,
energy, and banks.
The Russell 2000 index is an index measuring the performance of approximately 2,000 smallest-cap American companies in the Russell 3000 Index, which is made up of 3,000
of the largest U.S. stocks.
The NYSE Alerian MLP is the leading gauge of energy infrastructure Master Limited Partnerships (MLPs). The capped, float-adjusted, capitalization-weighted index, whose
constituents earn the majority of their cash flow from midstream activities involving energy commodities, is disseminated real-time on a price-return basis (AMZ) and on a
total-return basis (AMZX).
PAGE 11 OF 13PORTFOLIO STRATEGY
The Barclays Intermediate Government/Credit Bond index measures the performance of U.S. Dollar denominated U.S. Treasuries, government-related and investment grade
U.S. corporate securities that have a remaining maturity of greater than one year and less than ten years.
The Euro Stoxx 50 Index is a market capitalization weighted stock index of 50 large, blue-chip European companies operating within Eurozone nations. Components are
selected from the Euro STOXX Index which includes large-, mid- and small-cap stocks in the Eurozone.
The China CSI 300 is a capitalization-weighted stock market index designed to replicate the performance of top 300 stocks traded in the Shanghai and Shenzhen stock
exchanges. It had a sub-indexes CSI 100 Index and CSI 200 Index.
The S&P 500 Futures is a capitalization-weighted index of 500 stocks. The index is designed to measure performance of the broad domestic economy through changes in the
aggregate market value of 500 stocks representing all major industries.
The DJIA Futures is a stock market index futures contract traded on the Chicago Mercantile Exchange`s Globex electronic trading platform. Dow Futures is based off the Dow
30 stock index.
The Nasdaq 100 Futures is a modified capitalization-weighted index of the 100 largest and most active non-financial domestic and international companies listed on the
NASDAQ.
Europe: DAX (Deutscher Aktienindex (German stock index)) is a blue chip stock market index consisting of the 30 major German companies trading on the Frankfurt Stock
Exchange.
Asia: Nikkei is short for Japan's Nikkei 225 Stock Average, the leading and most-respected index of Japanese stocks. It is a price-weighted index composed of Japan's top 225
blue-chip companies traded on the Tokyo Stock Exchange.
Keep in mind that individuals cannot invest directly in any index, and index performance does not include transaction costs or other fees, which will affect actual investment
performance. Individual investor's results will vary. Past performance does not guarantee future results. Future investment performance cannot be guaranteed, investment
yields will fluctuate with market conditions.
International Disclosures
For�clients�in�the�United�Kingdom:
For clients of Raymond James Financial International Limited (RJFI): This document and any investment to which this document relates is intended for the sole use of
the persons to whom it is addressed, being persons who are Eligible Counterparties or Professional Clients as described in the FCA rules or persons described in Articles 19(5)
(Investment professionals) or 49(2) (high net worth companies, unincorporated associations, etc.) of the Financial Services and Markets Act 2000 (Financial Promotion) Order
2005 (as amended)or any other person to whom this promotion may lawfully be directed. It is not intended to be distributed or passed on, directly or indirectly, to any other
class of persons and may not be relied upon by such persons and is, therefore, not intended for private individuals or those who would be classified as Retail Clients.
For clients of Raymond James Investment Services, Ltd.: This document is for the use of professional investment advisers and managers and is not intended for use by
clients.
For�clients�in�France:
This document and any investment to which this document relates is intended for the sole use of the persons to whom it is addressed, being persons who are Eligible
Counterparties or Professional Clients as described in "Code Monetaire et Financier" and Reglement General de l'Autorite des marches Financiers. It is not intended to be
distributed or passed on, directly or indirectly, to any other class of persons and may not be relied upon by such persons and is, therefore, not intended for private individuals
or those who would be classified as Retail Clients.
For clients of Raymond James Euro Equities: Raymond James Euro Equities is authorised and regulated by the Autorite de Controle Prudentiel et de Resolution and the
Autorite des Marches Financiers.
PAGE 12 OF 13PORTFOLIO STRATEGY
For�institutional�clients�in�the�European�Economic�rea�(EE�)�outside�of�the�United�Kingdom:
This document (and any attachments or exhibits hereto) is intended only for EEA institutional clients or others to whom it may lawfully be submitted.
For�Canadian�clients:
This document is not prepared subject to Canadian disclosure requirements, unless a Canadian has contributed to the content of the document. In the case where there is
Canadian contribution, the document meets all applicable IIROC disclosure requirements.
Broker Dealer Disclosures
Securities are: NOT Deposits • NOT Insured by FDIC or any other government agency • NOT GUARANTEED by the bank • Subject to risk and may lose value
Raymond James & Associates, Inc., member New York Stock Exchange/SIPC. Raymond James Financial Services, Inc., member FINRA/SIPC. Raymond James® is a
registered trademark of Raymond James Financial, Inc.
PAGE 13 OF 13You can also read