Epidemics, Public Sentiment, and Infectious Disease Equity Market Volatility
←
→
Page content transcription
If your browser does not render page correctly, please read the page content below
BRIEF RESEARCH REPORT
                                                                                                                                                  published: 14 May 2021
                                                                                                                                         doi: 10.3389/fpubh.2021.686870

                                              Epidemics, Public Sentiment, and
                                              Infectious Disease Equity Market
                                              Volatility
                                              Jinxia Meng 1 , Qingyi Su 2 , Jinhua Zhang 3*, Li Wang 3 , Ruihui Xu 4* and Cheng Yan 3,5
                                              1
                                                Jiaxing Vocational and Technical College, Jiaxing, China, 2 Institute of World Economics and Politics, Chinese Academy of
                                              Social Sciences, Beijing, China, 3 School of Economics, Zhejiang University of Technology, Hangzhou, China, 4 Research
                                              Institute of the People’s Bank of China (PBC), Beijing, China, 5 Essex Business School, University of Essex, Colchester,
                                              United Kingdom

                                              Background :This article studies the relationship between the COVID-19 epidemic,
                                              public sentiment, and the volatility of infectious disease equities from the perspective
                                              of the United States. We use weekly data from January 3, 2020 to March 7, 2021. This
                                              provides a sufficient dataset for empirical analysis. Granger causality test results prove the
                                              two-way relationship between the fluctuation of infectious disease equities and confirmed
                                              cases. In addition, confirmed cases will cause the public to search for COVID-19 tests,
                                              and COVID-19 tests will also cause fluctuations in infectious disease equities, but there
                                              is no reverse correlation. The results of this research are useful to investors and policy
                                              makers. Investors can use the number of confirmed cases to predict the volatility of
                          Edited by:
                       Giray Gozgor,
                                              infectious disease equities. Similarly, policy makers can use the intervention of retrieved
 Istanbul Medeniyet University, Turkey        information to stabilize public sentiment and equity market fluctuations, and integrate a
                     Reviewed by:             variety of information to make more scientific judgments on the trends of the epidemic.
                    Shaolong Zeng,
   Hangzhou Normal University, China          Keywords: COVID-19, public sentiment, infectious disease equities, epidemic, confirmed cases
                       Yuhua Song,
          Zhejiang University, China

                  *Correspondence:
                                              INTRODUCTION
                              Ruihui Xu
                   xruihui@pbc.gov.cn         Since the initial outbreak of COVID-19, this global epidemic has spread rapidly. According to
                          Jinhua Zhang        data from Johns Hopkins Coronavirus Resource Center on March 23, 2021, the global number of
                  celliazjh@zjut.edu.cn       Coronavirus cases has reached 123.6 million, of which the United States accounts for 29.9 million.
                                              Because the virus is highly contagious, countries have adopted strict quarantines, resulting in the
                    Specialty section:        forced closure of a large number of commercial activities. According to the U.S. Bureau of Labor
          This article was submitted to       Statistics, the unemployment rate in the United States in April 2020 was as high as 14.7%. Previous
                     Health Economics,        outbreaks of infectious diseases such as SARS and MERS-CoV did not have such a strong impact
                a section of the journal
                                              on the equity market as the COVID-19 pandemic. This shows that in response to the current
              Frontiers in Public Health
                                              coronavirus epidemic, government restrictions on business activities and stay-at-home policies
           Received: 28 March 2021            have had a direct negative impact on the service-oriented economy. This is the main reason why the
            Accepted: 14 April 2021
                                              U.S. equity market’s response to COVID-19 is stronger than its response to previous pandemics.
            Published: 14 May 2021
                                                  Many empirical studies have shown that various direct and indirect factors, such as the epidemic
                             Citation:
                                              situation and investor attention, play an important role in equity market volatility. Compared with
Meng J, Su Q, Zhang J, Wang L, Xu R
  and Yan C (2021) Epidemics, Public
                                              other sectors in the economy and financial system, the equity market will respond more directly
   Sentiment, and Infectious Disease          to epidemics such as COVID-19. Li et al. (1) and Mazur et al. (2) have examined the impact of
               Equity Market Volatility.      COVID-19 on U.S. and European equity markets. However, most of these authors examined the
       Front. Public Health 9:686870.         impact of the number of COVID-19 cases and deaths on the equity market and seldom examined
    doi: 10.3389/fpubh.2021.686870            the relationship between public sentiment, the epidemic, and equity market volatility.

Frontiers in Public Health | www.frontiersin.org                                     1                                               May 2021 | Volume 9 | Article 686870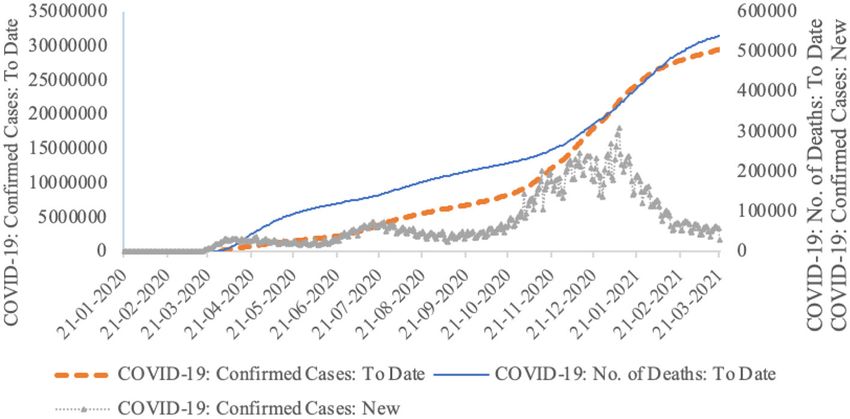
Meng et al.                                                                                                   Epidemics, Sentiment, and Equity Market

    Information epidemiology has become a research hotspot in              activity. In addition, in the summer, the closure of many tourist
the context of the spread of the COVID-19 epidemic (3). This               centers led to a decrease in the search term “sunscreen.” The
area of research involves scanning the Internet, traditional media,        article points out that understanding the trends of skin diseases
and other public channels to obtain health-related data and                and the impact on public perception during the COVID-19
content. In recent years, scholars have used the data collected            pandemic will help dermatologists better prepare.
by Google Trends and Google Flu Trends to conduct much                         Springer et al. (6) believes that people’s searches on the
of their research. Google Trends shows the keywords that the               Internet are mainly based on rational information needs and
public searches using Google. The data is normalized according             demographic needs in order to prepare for the pandemic
to search frequency and displayed in relative search volume. Data          and to protect themselves. This includes terms such as “hand
can be selected in different regions and time periods according            washing” and “social distancing.” This reflects an increase in
to needs. Researchers can use Google Trends data to investigate            people’s fear of infection. These search terms all reflect global
people’s search needs for coronavirus information around the               attention. According to Strzelecki (7), the peak time for new
world, and can choose five keywords for comparative analysis               cases occurs within 10–14 days after the keyword peaks of search
each time. This data is especially useful for studying seasonal            terms such as “COVID-19 symptoms,” “social distance,” and
infectious diseases, mental health conditions, and other diseases.         “isolation.” Heerfordt and Heerfordt (8) points out that smokers
This article uses Google Trends to analyze the public’s judgment           are not only more susceptible to flu and Middle East respiratory
and information needs on epidemic trends.                                  syndrome and other coronavirus infectious diseases, but the
    It is generally believed that industries related to people’s           consequences are also more serious. Studies have found that
livelihoods, such as healthcare, food, software and technology,            among hospitalized patients with COVID-19, smokers are two
and natural gas, are performing better during the epidemic. The            to nine times more likely to have serious complications than
negative impact of the epidemic on the real estate, aviation, hotel,       non-smokers. Quitting smoking can not only reduce respiratory
tourism, and entertainment industries is even more pronounced.             symptoms and bronchial responsiveness, but also effectively
So, what is the impact of COVID-19 on the volatility of infectious         prevent lung function decline. Walker et al. (9) show that there
disease equities? To examine equity market volatility, Baker               is a significant correlation between the use of search terms
et al. (4) constructed a newspaper-based infectious disease equity         related to “odor” and the number of coronavirus cases and
market volatility tracker, which is different from traditional             deaths. This correlation exists widely in the sample countries
equity market volatility indicators. The data spans January                examined. Generally, the detection of the first coronavirus death
1985 to the present, and the data frequency is updated once                is significantly consistent with the time of the outbreak in the
a day. In contrast, our article is not only based on Google                country. This shows that during the spread of the coronavirus
Trends, but also uses the volatility of infectious disease equities        epidemic, the sudden increase in the frequency of searches for
constructed based on traditional newspaper media to examine                keywords related to sense of smell deserves the attention of
the relationship between the epidemic, public sentiment, and               epidemic surveillance agencies.
the volatility of infectious disease equities. This is of great                Other studies look at the forecast of epidemic trends. Ortiz-
significance to investors and decision makers.                             Martínez et al. (10) present the evaluation results of the
                                                                           relationship between Colombian COVID-19 cases and Google
                                                                           searches. They find that after the first case in the country, search
LITERATURE REVIEW                                                          volume begins to increase significantly. After this, there is a high
                                                                           correlation between the incidence of COVID-19 in Colombia and
Research on COVID-19 has been extensive, and most studies                  Google searches. Although Internet searches and social media
consider disease-related keywords that the public searched for             data are related to traditional surveillance data, Internet search
on Google during the epidemic, such as skin diseases, quitting             data can predict the outbreak of a disease several days or weeks
smoking, and washing hands. Kutlu (5) uses Google Trends to                in advance. Analysis shows that Google Trends can potentially
judge the trends of skin diseases in Turkey and Italy during               determine the appropriate time and place to implement risk
the COVID-19 pandemic. The study found that from March                     communication strategies for the affected population. Gozgor
11 to June 1, 2020, there was a statistically significant positive         et al. (11), Ashraf (12), Ortiz-Martínez et al. (10), Fang et al. (13),
correlation between the number of COVID-19 cases and the                   Sharif et al. (14), Wang et al. (15), and Wu et al. (16) believe
search terms of general dermatology in Turkey. The search terms            that in countries that lack diagnostic and surveillance capabilities,
for “hair loss” and “acne” in these two countries increased during         Google Trends or Baidu index can be used to monitor search
the COVID-19 epidemic. This may be related to emotional stress,            changes related to COVID-19 and stock markets.
anxiety, and depression. The increasing number of “acne” search                Sulyok et al. (17) point out that the use of Internet search
terms in Google Trends may be related to the curfew and other              data can improve the accuracy of COVID-19 pandemic disease
blockade measures imposed on young people in Turkey and Italy.             modeling. It is believed that integrating Google Trends data into
In addition, the widespread use of masks may also cause acne.              the distributed lag model can significantly improve the prediction
Interestingly, during the COVID-19 pandemic, the significant               quality of the disease model. But Springer et al. (6) also point
reduction in sexually transmitted disease search terms may be              out the limitations of the use of Google Trends, arguing that
related to the fact that social distancing, gatherings, and stay-          Google Trends can only represent the interest of the crowd and
at-home campaigns have led to a decrease in extramarital sexual            cannot clearly distinguish fear, worry, or pure interest. Therefore,

Frontiers in Public Health | www.frontiersin.org                       2                                         May 2021 | Volume 9 | Article 686870
Meng et al. Epidemics, Sentiment, and Equity Market
FIGURE 1 | U.S. epidemic data released by Centers for Disease Control and Prevention.
researchers are cautioned to pay attention to this issue when TABLE 1 | Statistical description of the main variables.
using Google Trends.
CONFIRMEDCASE COVID-19 TEST INFECTIOUSEQUITY
Sousa-Pinto et al. (18) argue that the use of Google Trends
has changed. In recent years, Google Trends has shifted Mean 77498.46 51.24074 24.95998
from monitoring to predicting changes. Therefore, linking Median 52847 47 21.283
Google Trends with other data sources can help overcome the Maximum 243448 100 65.931
limitations of using only search information. The study by Minimum 44 9 13.159
Springer et al. (6) also shows that the current population’s main Std. Dev. 67254.04 20.57562 10.56136
interest is in medical treatment. Apart from individual reports, Skewness 1.094862 0.661805 2.095552
people’s interest in possible virus carriers or animal origins and Kurtosis 2.878847 2.930416 7.511875
repositories is also decreasing. For example, the authors find that
Jarque-Bera 10.82152 3.952763 85.32532
the search term “COVID-19” and the search term “vaccine” have
Probability 0.004468 0.13857 0
a high correlation, but the correlation with “pangolin” and “bat”
Sum 4184917 2767 1347.839
is weak.
Sum Sq. Dev. 2.40E+11 22437.87 5911.747
Observations 54 54 54
VARIABLE DESCRIPTION AND
STATISTICAL DESCRIPTION
We use INFECTIOUSEQUITY to express this. The statistical
As of March 23, 2021, the United States has become the description of the main variables is shown in Table 1.
country with the largest number of confirmed COVID-19 cases Google Trends data is on a weekly basis; therefore, our daily-
and deaths in the world, reaching 29.5 million and 543,000, based new confirmed cases and infectious disease equity market
respectively (Figure 1). Although the number of new cases in volatility tracker data must be averaged on a weekly basis. As
a single day has fallen sharply, it is still close to 30,000. Based such, part of the data contains a decimal point. Table 1 shows
on the availability and continuity of data, this article uses newly that the maximum number of newly confirmed cases is 243,448,
confirmed cases of COVID-19 as an alternative indicator of the which was obtained on January 3, 2021. The minimum value
U.S. epidemic, denoted by CONFIRMEDCASE. Data come from is 44, which was obtained on March 1, 2020, at the beginning
CEIC database. of the epidemic. The maximum value of COVID-19 TEST data
Due to public concern about the possibility of becoming is 100, which was obtained on June 21, 2020. Although the
infected with COVID-19 during the epidemic, people try their epidemic in the United States was not very serious at the time, the
best to engage in coronavirus surveillance or to search for southern states of the United States allowed companies to reopen,
relevant information. Therefore, we use the keyword search in resulting in a surge in confirmed cases. Public concern and media
Google Trends to express public sentiment. This article uses propaganda caused searches to soar rapidly. The minimum value
the keyword “COVID-19 test” to represent public sentiment is 9, which is also obtained on March 1, 2020 at the beginning of
concerning the epidemic. We use Baker et al. (4) to construct the sample period. The maximum value of the infectious disease
a newspaper-based infectious disease equity market volatility equity market volatility was obtained on March 15, 2020, and the
tracker to represent the volatility of infectious disease equities. minimum value was obtained on February 7, 2021.
Frontiers in Public Health | www.frontiersin.org 3 May 2021 | Volume 9 | Article 686870Meng et al. Epidemics, Sentiment, and Equity Market
TABLE 2 | ADF and PP test results.
Variables ADF PP
Level 1st difference Level 1st difference
Intercept Without trend and intercept Intercept Without trend and intercept
CONFIRMEDCASE −2.451 −3.976*** −1.574 −3.825***
Covid-19 Test −2.793* −6.095*** −3.200** −6.076***
INFECTIOUSEQUITY −2.351 −8.243*** −2.268 −9.985***
***, **, and * indicate the significance levels at 1%, 5%, and 10% levels, respectively.
TABLE 3 | Granger causality test results.
Null hypothesis Obs F-statistic Prob.
INFECTIOUSEQUITY does not Granger Cause CONFIRMEDCASE 52 10.1390 0.0002
CONFIRMEDCASE does not Granger Cause INFECTIOUSEQUITY 16.4139 4.00E-06
COVID-19 TEST does not Granger Cause CONFIRMEDCASE 52 1.08637 0.3458
CONFIRMEDCASE does not Granger Cause COVID-19 TEST 2.52758 0.0907
COVID-19 TEST does not Granger Cause INFECTIOUSEQUITY 52 2.78003 0.0723
INFECTIOUSEQUITY does not Granger Cause COVID-19 TEST 0.30440 0.739
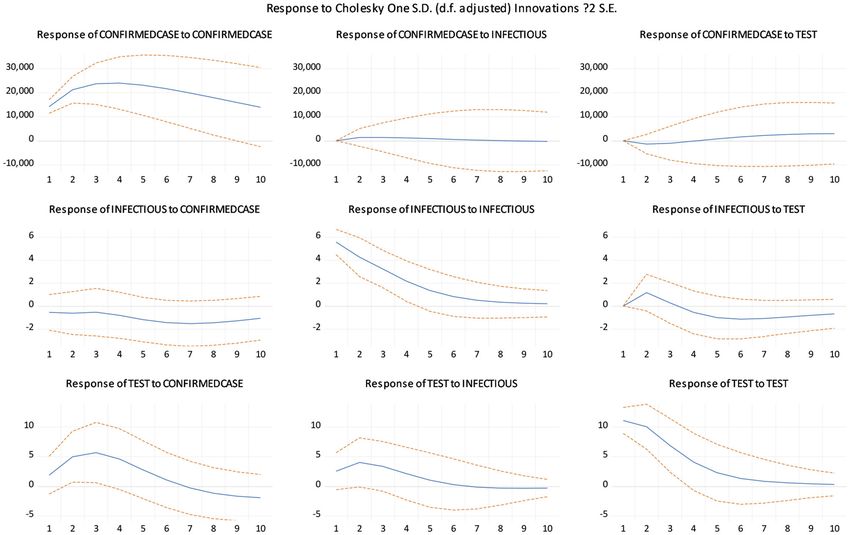
EMPIRICAL RESEARCH the fluctuation of equity information about the epidemic also
reflects the progress of confirmed cases. In sharp contrast,
The correlation between the main variables shows that confirmed CONFIRMEDCASE does not Granger Cause COVID-19 TEST,
cases are positively correlated with COVID-19 TEST. This rejecting the null hypothesis at a significance level of 10%, but
shows that the more confirmed cases, the greater the public’s the opposite is not true. COVID-19 TEST does not Granger
attention to the epidemic and the more they are willing Cause INFECTIOUSEQUITY, also rejecting the null hypothesis
to retrieve COVID-19 TEST related information. There is at a significance level of 10%, and vice versa.
a negative correlation between confirmed cases and the The results of the cointegration test show that there is a
INFECTIOUSEQUITY variable, but the correlation between cointegration relationship between the three variables. Therefore,
them is not strong. we can conduct a VAR inspection and impulse response
Table 2 uses ADF and PP to investigate the unit root test function analysis.
results. The ADF and PP tests are based on the following The impulse response function in Figure 2 mainly examines
assumptions: testing the null hypothesis of unit roots (non- the impact of one variable in different lag periods on other
stationary) and the alternative hypothesis of no unit roots variables. The calculation results show that the response of
(stationary). The model estimates the presence and absence of CONFIRMEDCASE to the INFECTIOUSEQUITY shock and the
trends, levels, and first-order differences. When the level value response of CONFIRMEDCASE to the COVID-19 TEST shock
contains a trend, the ADF and PP test results of the three are relatively stable. However, the impact of CONFIRMEDCASE
variables reject the null hypothesis that the unit root is at the 1% on itself first increases and then decreases, and there is a
significance level. This means that these series are not stationary long lag period. INFECTIOUSEQUITY is always negative for
at their level values. When the first-order difference does not the response from CONFIRMEDCASE. INFECTIOUSEQUITY’s
include trend and intercept, all three variables pass the 1% response to the shock from the COVID-19 TEST changed
significance test. This shows that the first difference of the three from positive to negative. The impact of INFECTIOUSEQUITY
variables is a stationary time series. on itself continues to decline. The response of COVID-19
Table 3 shows the test results of Granger causality. TEST to shocks from the other two variables is similar,
We have selected an appropriate lag period according to rising first and then falling in both cases. However, the
the Akaike Information Criteria (AIC). The test results response of COVID-19 TEST from its own shock continues
show that INFECTIOUSEQUITY does not Granger Cause to decline.
CONFIRMEDCASE, rejecting the null hypothesis at the
1% level. Similarly, CONFIRMEDCASE does not Granger
Cause INFECTIOUSEQUITY, rejecting the null hypothesis CONCLUSIONS AND POLICY
at the 1% significance level. This means that there is a two- RECOMMENDATIONS
way Granger causality between INFECTIOUSEQUITY and
CONFIRMEDCASE. In other words, the increase in confirmed This study empirically examines the relationship between the
cases will cause fluctuations in epidemic equities. Similarly, volatility of infectious disease equities, public sentiment, and the
Frontiers in Public Health | www.frontiersin.org 4 May 2021 | Volume 9 | Article 686870Meng et al. Epidemics, Sentiment, and Equity Market FIGURE 2 | Impulse response function. COVID-19 epidemic from the perspective of the United States. is a longer lag period. The impact of the other two variables is This study uses weekly data from January 3, 2020 to March relatively stable. 7, 2021. The research results show that the confirmed cases Based on the above research conclusions, we believe that in the United States are positively correlated with COVID-19 real-time monitoring of epidemic trends will not only help TEST. This shows that the more confirmed cases, the greater determine the volatility of epidemic-related equities, but it will the public’s attention to the epidemic and the more willing they also help policy makers to intervene before major equity market are to retrieve COVID-19 TEST related information. There is a volatility occurs, thereby preventing excessive equity market negative correlation between confirmed cases in the United States volatility. Secondly, monitoring the equity information of the and the INFECTIOUSEQUITY variable. In other words, as epidemic can also help reveal undetected epidemics or the needs more cases are confirmed, the equities related to the epidemic for medicines and anti-epidemic materials in specific areas or will gain, thereby reducing the volatility of related equities; among groups of people, so as to provide targeted epidemic there is a negative correlation between the two. The results prevention and medical services for specific groups. In addition, of the Granger causality test show that there is a two-way providing effective COVID-19 test services in accordance with Granger causality relationship between INFECTIOUSEQUITY the epidemic’s trends will also help control the epidemic in the and CONFIRMEDCASE. In other words, the increase in United States and prevent the global spread of the epidemic confirmed cases will cause fluctuations in epidemic equities. (19). The number of testing services will also help determine Similarly, the fluctuation of equity information about the the epidemic and the prosperity index of medical equities and epidemic reflects the progress of confirmed cases. In sharp industries in advance and improve the medical industry’s ability contrast, CONFIRMEDCASE can cause COVID-19 TEST. to respond to the epidemic. COVID-19 TEST will cause INFECTIOUSEQUITY, but the reverse is not true. That is, there is a one-way causal relationship DATA AVAILABILITY STATEMENT between them. The impulse response function calculation results based on the VAR model show that the impulse response of Publicly available datasets were analyzed in this study. This data the three variables from their own shock is stronger, but there can be found at: trends.google.com. Frontiers in Public Health | www.frontiersin.org 5 May 2021 | Volume 9 | Article 686870
Meng et al.                                                                                                                     Epidemics, Sentiment, and Equity Market

AUTHOR CONTRIBUTIONS                                                                   FUNDING
JM: writing-original draft. QS: writing—review and                                     The authors thank the financial support by the Zhejiang
editing. JZ: resources. LW: investigation and software. RX:                            Provincial Natural Science Foundation of China under grant
proofreading. CY: draft writing, design, and literature part.                          nos: LZ20G010002, LY20G030023, and LY20G030024 and the
All authors contributed to the article and approved the                                Humanities and Social Sciences Pre-research Fund of Zhejiang
submitted version.                                                                     University of Technology.

REFERENCES                                                                             12. Ashraf BN. Stock markets’ reaction to COVID-19: Cases or fatalities? Res Int
                                                                                           Bus Financ. (2020) 54:101249. doi: 10.1016/j.ribaf.2020.101249
 1. Li Y, Liang C, Ma F, Wang J. The role of the IDEMV in predicting European          13. Fang J, Gozgor G, Lau CKM, Lu Z. The impact of Baidu index
    stock market volatility during the COVID-19 pandemic. Financ Res Lett.                 sentiment on the volatility of China’s stock markets. Financ Res Lett. (2020)
    (2020) 36:101749. doi: 10.1016/j.frl.2020.101749                                       32:101099. doi: 10.1016/j.frl.2019.01.011
 2. Mazur M, Dang M, Vega M. COVID-19 and the march 2020 stock                         14. Sharif A, Aloui C, Yarovaya L. COVID-19 pandemic, oil prices,
    market crash. Evidence from SandP1500. Finan Res Lett. (2021)                          stock market, geopolitical risk and policy uncertainty nexus in
    38:101690. doi: 10.1016/j.frl.2020.101690                                              the US economy: fresh evidence from the wavelet-based approach.
 3. Jiang B, Liu Z, Shen R, Huang L, Tong Y, Xia Y. Have                                   Int Rev Financ Anal. (2020) 70:101496. doi: 10.1016/j.irfa.2020.
    COVID-19-related economic shocks affected the health levels                            101496
    of individuals in the United States and the United Kingdom?                        15. Wang J, Lu X, He F, Ma F. Which popular predictor is more useful to
    Front Public Health. (2020) 8:611325. doi: 10.3389/fpubh.2020.                         forecast international stock markets during the coronavirus pandemic: VIX
    611325                                                                                 vs EPU? Int Rev Financ Anal. (2020) 72:101596. doi: 10.1016/j.irfa.2020.
 4. Baker SR, Bloom N, Davis SJ, Kost KJ, Sammon MC, Viratyosin T, et al. The              101596
    unprecedented stock market reaction to COVID-19. Rev Asset Pricing Stud.           16. Wu W, Su Q, Li C, Yan C, Gozgor G. Urbanization, disasters, and
    (2020) 10:742–758. doi: 10.3386/w26945                                                 tourism development: evidence from RCEP countries. Sustainability. (2020)
 5. Kutlu Ö. Analysis of dermatologic conditions in Turkey and Italy by using              12:1221. doi: 10.3390/su12031221
    Google Trends analysis in the era of the COVID-19 pandemic. Dermatol Ther.         17. Sulyok M, Ferenci T, Walker M. Google trends data and COVID-19 in Europe:
    (2020) 33:e13949. doi: 10.1111/dth.13949                                               correlations and model enhancement are European wide. Transbound Emerg
 6. Springer S, Menzel LM, Zieger M. Google trends reveals: focus of                       Dis. (2020). doi: 10.1111/tbed.13887. [Epub ahead of print].
    interest in the population is on treatment options rather than theories            18. Sousa-Pinto B, Anto A, Czarlewski W, Anto JM, Fonseca JA, Bousquet
    about COVID-19 animal origin. Brain Behav Immun. (2020) 87:134–                        J. Assessment of the Impact of media coverage on COVID-19-related
    5. doi: 10.1016/j.bbi.2020.05.005                                                      google trends data: infodemiology study. J Med Internet Res. (2020)
 7. Strzelecki A. The second worldwide wave of interest in coronavirus since the           22:e19611. doi: 10.2196/19611
    COVID-19 outbreaks in South Korea, Italy and Iran: a Google Trends study.          19. Gozgor G. Global evidence on the determinants of public trust
    Brain Behav Immun. (2020) 88:950–1. doi: 10.1016/j.bbi.2020.04.042                     in governments during the COVID-19. Appl Res Q Life. (2021).
 8. Heerfordt C, Heerfordt IM. Has there been an increased interest in smoking             1–20. doi: 10.1007/s11482-020-09902-6. [Epub ahead of print].
    cessation during the first months of the COVID-19 pandemic? A Google
    Trends study. Public Health. (2020) 183:6–7. doi: 10.1016/j.puhe.2020.04.012       Conflict of Interest: The authors declare that the research was conducted in the
 9. Walker A, Hopkins C, Surda P. Use of Google Trends to investigate loss-            absence of any commercial or financial relationships that could be construed as a
    of-smell-related searches during the COVID-19 outbreak. Int Forum Allergy          potential conflict of interest.
    Rhinol. (2020) 10:839–847. doi: 10.1002/alr.22580
10. Ortiz-Martínez Y, Garcia-Robledo JE, Vásquez-Castañeda DL, Bonilla-Aldana          Copyright © 2021 Meng, Su, Zhang, Wang, Xu and Yan. This is an open-access
    DK, Rodriguez-Morales AJ. Can Google trends predict COVID-19 incidence             article distributed under the terms of the Creative Commons Attribution License (CC
    and help preparedness? The situation in Colombia. Travel Med Infect Dis.           BY). The use, distribution or reproduction in other forums is permitted, provided
    (2020) 37:101703. doi: 10.1016/j.tmaid.2020.101703                                 the original author(s) and the copyright owner(s) are credited and that the original
11. Gozgor G, Lau CKM, Sheng X, Yarovaya L. The role of                                publication in this journal is cited, in accordance with accepted academic practice.
    uncertainty measures on the returns of gold. Econ Lett. (2019)                     No use, distribution or reproduction is permitted which does not comply with these
    185:108680. doi: 10.1016/j.econlet.2019.108680                                     terms.

Frontiers in Public Health | www.frontiersin.org                                   6                                                May 2021 | Volume 9 | Article 686870
You can also read