Well, What Will We Drink?
←
→
Page content transcription
If your browser does not render page correctly, please read the page content below
Well, What Will We Drink?

                                                Developed by
                                               Diana Larrabee
                                        Thomas J. Corcoran High School
                                             Syracuse, New York

                                             For the
                           My Environment, My Health, My Choices project

                                            University of Rochester
                                                Rochester, NY

Abstract:
This environmental health learning experience encourages students to investigate the publicly
available information on drinking water sources. Using a directed case study, students
research information on private well water and a public water supply. Providing public water
supplier quality reports from the local area increases student interest. The students prepare a
presentation advising the Alvarez family on whether they should continue to use their well or if
they should connect to a proposed extension of their local public water supply. A laboratory
activity using serial dilution of food coloring illustrates several ways of expressing solution
concentrations.

My Environment, My Health, My Choices                                                              1
© 2006, University of Rochester
May be copied for classroom use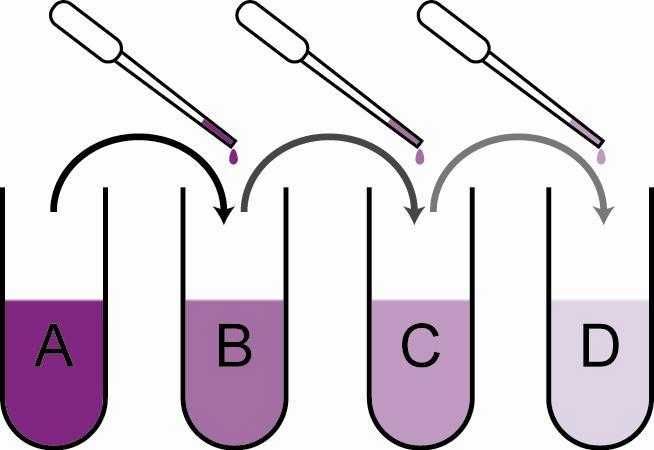
Table of Contents

    Pre/Post Test                                               3-4

    Pre/Post Test Answer Key                                    5-6

    Learning Context and Teacher Information                    7-8

    Instructions for Implementing the Activity                  8-10

    Resources                                                   10-11

    New York State Learning Standards                           12

    Possible Extensions                                         13

    Student Handouts for Day 1                                  14-16

    Student Handouts for Day 2                                  17-21

    Student Handouts for Day 3                                  22-23

    Teacher - Sample Student Answers                            24-29

Teachers, we would appreciate your feedback. Please complete our brief, online
Environmental Health Science Activity Evaluation Survey after you implement these
lessons in your classroom.
The survey is available online at: www.surveymonkey.com/s.asp?u=502132677711

My Environment, My Health, My Choices                                               2
© 2006, University of Rochester
May be copied for classroom use
Well, What Will We Drink?
(Student Pre/Post Test)
Name _________________________________
1. Pure water at 25°C has a pH of
(1) 11
(2) 7
(3) 3
(4) 14
2. When a mixture of water, sand and salt is filtered, what passes through the
filter paper?
(1) water only
(2) water and salt, only
(3) water and sand, only
(4) water, sand and salt
3. A homeowner has a problem with excessive corrosion of his copper water
supply pipes. Which is the most likely pH of his water?
(1) 6
(2) 7
(3) 8
(4) 9
4. Which salt solution is the most concentrated?
(1) 4mg salt in 1000mL of solution
(2) 4g salt in 1000mL of solution
(3) 4mg salt in 100mL of solution
(4) 4g salt in 100mL
5. A 200. gram sample of a salt solution contains 0.050 grams of NaCl. What is
the concentration of the solution parts per million (ppm)?
(1) 2.5 X 10⁻⁴ppm
(2) 50. ppm
(3) 250 ppm
(4) 5.0 X 10⁴ppm
My Environment, My Health, My Choices 3
© 2006, University of Rochester
May be copied for classroom use6. Which type of water is classified as a substance?
(1) salt water
(2) tap water
(3) pure water
(4) mineral water
7. A sample of drinking water is tested and found to have a fluoride
concentration of 1 mg per liter of water. This is the same concentration as
(1) 1 ppm
(2) 10 ppm
(3) 100 ppm
(4) 1000 ppm
8. Rust is a mixture of chemical compounds, including Fe2O3. Rust stains on
bath tubs and toilets indicate that the water contains a high concentration of
(1) lead
(2) fluorine
(3) mercury
(4) iron
9. Which of the following solutions of sodium chloride dissolved in water is the
least concentrated?
(1) 5 % by mass
(2) 0.5 % by mass
(3) 5 parts per million
(4) 50 parts per million
10. A recent measurement of Skaneateles Lake showed dissolved oxygen levels in
the lake to be at least 10 mg/kg at all depths. What is the concentration of
dissolved oxygen in the lake in parts per million (ppm)?
(1) 32 ppm
(2) 10 ppm
(3) 320 ppm
(4) 1 ppm
My Environment, My Health, My Choices 4
© 2006, University of Rochester
May be copied for classroom useTeacher Pre-test and Post-test Answer Key
1. Pure water at 25°C has a pH of
(1) 11
(2) 7
(3) 3
(4) 14
2. When a mixture of water, sand and salt is filtered, what passes through the
filter paper?
(1) water only
(2) water and salt, only
(3) water and sand, only
(4) water, sand and salt
3. A homeowner has a problem with excessive corrosion of his copper water
supply pipes. Which is the most likely pH of his water?
(1) 6
(2) 7
(3) 8
(4) 9
4. Which salt solution is the most concentrated?
(1) 4mg salt in 1000mL of solution
(2) 4g salt in 1000mL of solution
(3) 4mg salt in 100mL of solution
(4) 4g salt in 100mL
5. A 200. gram sample of a salt solution contains 0.050 grams of NaCl. What is
the concentration of the solution parts per million (ppm)?
(1) 2.5 X 10⁻⁴ppm
(2) 50. ppm
(3) 250 ppm
(4) 5.0 X 10⁴ppm
My Environment, My Health, My Choices 5
© 2006, University of Rochester
May be copied for classroom use6. Which type of water is classified as a substance?
(1) salt water
(2) tap water
(3) pure water
(4) mineral water
7. A sample of drinking water is tested and found to have a fluoride
concentration of 1 mg per liter of water. This is the same concentration as
(1) 1 ppm
(2) 10 ppm
(3) 100 ppm
(4) 1000 ppm
8. Rust is a mixture of chemical compounds, including Fe2O3. Rust stains on
bath tubs and toilets indicate that the water contains a high concentration of
(1) lead
(2) fluorine
(3) mercury
(4) iron
9. Which of the following solutions of sodium chloride dissolved in water is the
least concentrated?
(1) 5 % by mass
(2) 0.5 % by mass
(3) 5 parts per million
(4) 50 parts per million
10. A recent measurement of Skaneateles Lake showed dissolved oxygen levels
in the lake to be at least 10 mg/kg at all depths. What is the concentration of
dissolved oxygen in the lake in parts per million (ppm)?
(1) 32 ppm
(2) 10 ppm
(3) 320 ppm
(4) 1 ppm
My Environment, My Health, My Choices 6
© 2006, University of Rochester
May be copied for classroom useWell, What Will We Drink?
Learning Context
Subject Area: Chemistry
Overall Purpose: Students will investigate the advantages and disadvantages of different
sources of potable water.
Learning Objectives: Students will
· Interpret water quality data
· Compare data using solution concentration
· Use government information sources
· Use Risk/Benefit Analysis
Prerequisite knowledge and skills: Students should have
· Knowledge of Types of Matter(Solutions)
· Basic web search and navigation skills
· Cooperative group experience or instruction
· Laboratory safety and measurement skills
· Understanding of risk/benefit analysis
Procedure
Classroom Timeline:
Day 1 - Directed case study introduction and research 1-2 periods
Day 2 - Lab – 1 laboratory or class period
Day 3 - Directed case study decision making and presentations 1 period
Equipment and Supplies:
For the Case Study:
· One copy of Well, What Will We Drink? Scenario per student
· One copy of Well, What Will We Drink? Your Task, Contaminant Table per student.
· One copy of Well, What Will We Drink? Presentation per student
· One copy of Orchard Hill Labs simulated water testing report per student
· One sheet of chart paper or poster paper per group
· One set of markers per group
My Environment, My Health, My Choices 7
© 2006, University of Rochester
May be copied for classroom use· Access to resources for research (select one of the following options):
o Students search for their own resources on the web
o Students use links provided by the teacher. (See page 9)
o Students use printouts of sites provided by the teacher. (See page 9)
For the lab activity:
· One copy of Well, What Will We Drink? ppm, ppb, and Serial Dilution Lab per
student
· One set of laboratory supplies per pair of students:
o 9 stirrers (toothpicks)
o 1 small container with100-150 mL of water labeled “use for diluting solutions”
o 1 large container with 250-500 mL of water labeled “use for rinsing pipettes”
o 2 plastic dropping pipettes for use in the serial dilution procedure
o 1 pipette full of food coloring*
o 1 white plastic spot plate
* You may substitute dropper bottles of food coloring instead. If you are using the dropper
bottles of food coloring, five drops seems to be a similar volume to 10 from a pipette.
Instructions for Implementing the Activity:
Before beginning this learning experience, teachers should decide how students will do
their research. Student research for this learning experience may be accomplished in several
ways. Students may be charged with finding all of the background information on their own on
the web. Or, they may be given web addresses provided by the teacher. The third option is to
provide students with printed resources. The time required will vary based on the option
chosen. Using the water quality report from a local water supply is strongly encouraged.
Information for web addresses or print resources is provided under Recommended Student
Resources and Additional Student Resources on page 9.
Day 1: Directed Case Study - Introduction
1. Place students into cooperative groups of 3-5. Discuss group roles and ground rules.
2. Distribute Well, What Will We Drink? Scenario.
3. Have students read the scenario. Select students to read the parts of Norma and Jim.
You may also have a student narrate. Provide highlighted copies for each reader.
4. Inform the class that they will be finding the information to help the Alvarez’s decide what
water source they should use—their well or the public water supply.
5. Distribute the Well, What Will We Drink? Your Task, Contaminant Table handout.
6. Distribute print resources for student research or explain to students how they will use
the Internet to do their research. Based on how students will find information, set a
My Environment, My Health, My Choices 8
© 2006, University of Rochester
May be copied for classroom usetimeline for completion of research. If students do their own research, remind them that
they will need to cite their information sources.
7. Ask students to work together with their group to complete the task. As they work,
circulate and listen in to provide assistance through answering or asking guiding
questions.
8. Near the end of class, stop the group work. Remind students of the time line for
completing their research.
9. Explain that additional class time will be provided for groups to review and share the
results of their research during later activities. Ask for questions.
10. Collect print resources for use in other classes (optional).
Day Two: Laboratory Activity
1. Distribute laboratory supplies to each pair of students.
· 9 stirrers (toothpicks)
· 1 small container with100-150 mL of water labeled “use for diluting solutions”
· 1 large container with 250-500 mL of water labeled “use for rinsing pipettes”
· 2 plastic dropping pipettes for use in the serial dilution procedure
· 1 pipette full or dropping bottle of food coloring
· 1 white plastic spot plate
2. Distribute one copy of Well, What Will We Drink - ppm, ppb, and Serial Dilution Lab
to each student.
3. Introduce the lab by relating it to the information students found from their research.
4. Review safety procedures—particularly the appropriate handling of dropper pipettes.
5. Have students carry out the lab procedure. Monitor students as they work. Common
errors include always drawing from tube #1 and not adequately rinsing the dropper.
6. Supervise cleanup.
7. If time allows, you may wish to discuss calculating solution concentration and provide
additional practice.
Day 3: Directed Case Study – Presentations
1. Re-establish existing cooperative groups. Review roles and ground rules.
2. Distribute one copy of the Orchard Hill Labs well testing report and one copy of the
Well, What Will We Drink? Presentation handout to each student.
3. Ask students to read the Well, What Will We Drink? Presentation handout. Explain
that they should use their prior research and the Orchard Hill Labs well testing report to
prepare for their group presentation.
My Environment, My Health, My Choices 9
© 2006, University of Rochester
May be copied for classroom use4. Presentations should be 3 minutes long. Explain that groups should prepare a poster
summarizing the important points supporting their recommendations for the Alvarez
family.
5. Tell students they have 10 minutes to prepare their presentation. This may be extended
by the teacher if they need more time.
6. Distribute chart paper and markers to each group.
7. Students should make presentations to the class.
8. If time remains, a discussion of local or school drinking water would be appropriate.
Resources
Recommended Student Resources: The following resources are the minimum required to
complete the activity. If students are doing a web search, these might be suggested places to
start. If two links are provided, the second goes directly to a pdf (Acrobat) file that the teacher
can use to produce print resources.
EPA National Primary Drinking Water Standards Office of Water (4606M), EPA 816-F-03-
016, June 2003
www.epa.gov/safewater/mcl.html#mcls or
www.epa.gov/safewater/consumer/pdf/mcl.pdf
Individual Water Supply Wells – Fact Sheet #3 New York State Department of Health,
Bureau of Water Supply Protection, March 1,2006
www.health.state.ny.us/nysdoh/water/part5/append5b/fs3_water_quality.htm or
/www.health.state.ny.us/nysdoh/water/part5/append5b/docs/fs3_water_quality.pdf
Home Water Testing Fact Sheet, EPA, Office of Water, EPA 816-F-05-013 May 2005 (pdf
only)
www.epa.gov/safewater/faq/pdfs/fs_homewatertesting.pdf
Water Quality Report Links New York State Department of Health, July 2006
This page is the source for individual Annual Water Quality Reports. Students will need to
use one, preferably something local or recognizable to them.
www.health.state.ny.us/nysdoh/water/water_quality_report_links.htm
Additional Student Resources: These would be useful for student research but are optional.
Water on Tap: What You Need to Know booklet, EPA, Office of Water (4601), EPA 816-K-
03-007, October 2003
www.epa.gov/safewater/wot/index.html or
www.epa.gov/safewater/wot/pdfs/book_waterontap_full.pdf
Drinking Water From Household Wells booklet, EPA, Office of Water, EPA 816-K-02-003,
January 2002
www.epa.gov/safewater/privatewells/booklet/index.html or
www.epa.gov/safewater/privatewells/pdfs/household_wells.pdf
My Environment, My Health, My Choices 10
© 2006, University of Rochester
May be copied for classroom useTeacher Background Resources:
www.epa.gov/safewater/index.html
US Environmental Protection Agency Ground Water & Drinking Water page. Good place
to start and for students to start.
www.epa.gov/safewater/mcl.html#mcls
EPA List of Drinking Water Contaminants & MCL’s. Also available as a pdf.
www.epa.gov/safewater/wot/index.html
Water on Tap: What You Need to Know, booklet, also available in Spanish and Chinese
www.epa.gov/safewater/privatewells/booklet/index.html
Online and pdf booklet on private wells
www.health.state.ny.us/nysdoh/water/main.htm
NYS Department of Health Drinking Water Protection Program
www.health.state.ny.us/nysdoh/water/part5/append5b/fs3_water_quality.htm
Individual Water Supply Wells-Fact Sheet 3, Recommended Residential Water Quality
Testing
www.health.state.ny.us/nysdoh/water/water_quality_report_links.htm
Links to required water quality reports for large NYS public water supplies. This page
should be used to get information for the public water supply portion of the case study.
You may also be able to get print copies from the supplier directly.
www.inspect-ny.com/water/watrtest.htm
This is a non-governmental site with a lot of well documented information on home water
testing.
Cited Source: Lab adapted from
Science Demonstration Projects in Drinking Water, United States Environmental
Protection Agency, Office of Water, April 1990, EPA570/ 9-90-007, available at
http://yosemite.epa.gov/water/owrccatalog.nsf/065ca07e299b464685256ce50075c11a/c8
32d6ff5b57c8de85256b0600724dd0!OpenDocument
My Environment, My Health, My Choices 11
© 2006, University of Rochester
May be copied for classroom useNew York State Learning Standards and Performance Indicators:
Standard 4
Students will understand and apply scientific concepts, principles, and theories pertaining to the
physical setting and living environment and recognize the historical
development of ideas in science.
Key Idea 3: Matter is made up of particles whose properties determine the observable
characteristics of matter and its reactivity.
Performance Indicator 3.1:
Explain the properties of materials in terms of the arrangement and properties of the atoms
that compose them.
Major Understandings
· 3.1s Mixtures are composed of two or more different substances that can be
separated by physical means. When different substances are mixed together, a
homogeneous or heterogeneous mixture is formed.
· 3.1t The proportions of components in a mixture can be varied. Each component in a
mixture retains its original properties.
· 3.1nn Differences in properties such as density, particle size, molecular polarity,
boiling and freezing points, and solubility permit physical separation of the
components of the mixture.
· 3.1oo A solution is a homogeneous mixture of a solute dissolved in a solvent. The
solubility of a solute in a given amount of solvent is dependent on the temperature,
the pressure, and the chemical natures of the solute and solvent.
· 3.1pp The concentration of a solution may be expressed in molarity (M), percent by
volume, percent by mass, or parts per million (ppm).
· 3.1ss The acidity or alkalinity of an aqueous solution can be measured by its pH
value. The relative level of acidity or alkalinity of these solutions can be shown by
using indicators.
· 3.1tt On the pH scale, each decrease of one unit of pH represents a tenfold increase
in hydronium ion concentration.
My Environment, My Health, My Choices 12
© 2006, University of Rochester
May be copied for classroom usePossible Extensions
§ Bottled Water- Ask students to compare bottled water with public water supplies,
especially if student initiated
§ Location- Compare public water supply reports from different areas of the state, country or
world. For example, Bermuda residents still use rainwater collected from their roofs as
their primary supply of drinking water. Island nations sometimes use desalination. Arid
regions have additional concerns.
§ Well Report- Create different well reports for different groups. Getting different well reports
could lead to some interesting changes of opinion.
§ Individual Contaminant Research- Ask individual students to do more research on the
health effects of specific contaminants in well or public water supplies.
§ Apply the serial dilution technique to a pH lab.
§ Discuss situations in with minute amounts of chemical contaminants (such as hormones)
might have health effects. For example, the hormone estrogen in the blood is measured
in picograms per mL, which is a part per trillion.
My Environment, My Health, My Choices 13
© 2006, University of Rochester
May be copied for classroom useWell, What Will We Drink? Scenario “Good morning, sunshine!”, Jim said as he walked into the kitchen to grab a cup of coffee. “What’s new?” Norma Alvarez put down her newspaper and smiled at her husband. They had been married less then a year and had just purchased their first home together. They both loved the old farmhouse with its big rooms and high ceilings, even if it meant they would spend this and many other Saturdays painting and remodeling things. And it gave them lots of space for Norma’s 75 year old grandmother to live with them, and for the family they hoped to start soon. “Not much,” replied Norma. “Why don’t you pour me another cup of coffee, while I finish reading the paper? Then we can start on the living room ceiling.” Norma returned to her paper as Jim got the coffee, and poured himself a bowl of cereal. “Now, this is new,” said Norma. “This article says that Apple Tree Homes is creating a water district and connecting to the town water supply. Apparently some of the homeowners’ wells are getting low and they’re concerned that it will get worse as the new section gets developed.” Apple Tree Homes was the housing development that was built on the farmland that had once gone along with their farmhouse. Two sections of homes were done and a third was just starting to be constructed. Norma and Jim’s home had well water, also, and had passed the tests that were required for their mortgage. “According to the map, we will be eligible to join the water district,” Norma continued. “They estimate it will cost each homeowner about $800 per year for 20 years just to pay for the connections and water mains!” “And then you have to pay for the water, too,” Jim replied. “Doesn’t sound like such a great deal to me”. “Maybe we should think about it. How do we know our well won’t go dry? And what if all these new houses and businesses contaminate the water? How will we know? What if we have children or Nana gets sick.” Norma sounded really concerned now. “I suppose we should find out more. This well stuff is all new to me. I’ll dig out our well test report. Why don’t you call your cousin the chemistry teacher and see if she can find anything to help us decide. Then we can get started on that ceiling. ” My Environment, My Health, My Choices 14 © 2006, University of Rochester May be copied for classroom use
Well, What Will We Drink? Your Task

Using the resources provided, answer the following questions. This will be the research
you will use to help Norma and Jim decide what to do. You group may wish to divide the
questions up to do the research, but each member of the group is responsible for
answering all of the questions and understanding this information. You should cite the
source of your information. You will have time at the beginning of the next class to
discuss and prepare to help the Alvarez family make their decision.

Well water
    1. Who is responsible for ensuring the safety of private well water?
    2. What tests are recommended for private well water? How much do they cost?
    3. How often should it be tested?
    4. List some factors that could cause well water quality to change.
    5. What conditions might indicate the need for testing?

Public water supply
    6. What is the source of the public water supply?
    7. What is the cost of water? Convert this into price per gallon.
    8. What is added to the water? For what purpose?
    9. How does lead get into drinking water? What is the concern?
    10. What chemical water quality categories are monitored?
    11. What is the pH of the public water supply? Is this acidic, basic or neutral? Why is
        it monitored?

Contaminants
    12. What units are used most frequently in the Detected Contaminants tables? How
        are these units defined?
    13. Are any contaminants above the regulatory limits?
    14. What is an MCL? What is an Action Level (AL)?
    15. Each group member should choose and identify one measured contaminant for which
        there is an MCL. Complete the table provided for these contaminants.
    16. Why are disinfectant by-products monitored? What are the risks?
    17. Are there any specific contaminants that the Alvarez’s should be particularly
        concerned about, for their household?

My Environment, My Health, My Choices                                                     15
© 2006, University of Rochester
May be copied for classroom use
Well, What Will We Drink? Contaminant Table Contaminant Name MCL Potential Health Effects Common sources in Drinking Water My Environment, My Health, My Choices 16 © 2006, University of Rochester May be copied for classroom use
Well, What Will We Drink? Ppm, ppb, and Serial Dilution Lab
                     Adapted from “Science Demonstration Projects in Drinking Water”,
       United States Environmental Protection Agency, Office of Water, April 1990, EPA570/ 9-90-007

Background Information:

Concentrations of chemical pollutants in water are frequently expressed in units of "parts
per million" (ppm). For water, this is effectively equivalent to mg/L. Many chemical
pollutants are hazardous in small concentrations. For example, chemical fertilizers contain
nitrate, a chemical that can be dangerous to infants in quantities as small as 10 parts per
million. Trichloroethylene (TCE), a common industrial solvent, is more dangerous than
nitrate and, when present in drinking water in quantities as small as 5 parts per million, can
cause a higher than normal incidence of cancer among people who drink the water
regularly. The action level for lead is 15 ppb, or “parts per billion”. This is also expressed
as 0.015 parts per million, and is essentially equivalent to 15 µg/L (Note: 1 µg = 1/1 000 of a
milligram or 1/1 000 000 of a gram)

In this laboratory activity you will carry out a serial dilution which involves a series of
dilution steps, each of the same size. This technique is frequently used by biologists and
chemists to prepare a standard set of solutions with decreasing concentrations for an
experiment.

                        10 drops         9 drops          9 drops         9 drops
                          purple          water            water           water
                         solution           +                +               +
                                        1 drop A         1 drop B        1 drop C

My Environment, My Health, My Choices                                                                 17
© 2006, University of Rochester
May be copied for classroom use
Purpose:
· To demonstrate the concept of parts per million (ppm) and parts per billion (ppb).
· To show how chemicals may be present in very small amounts in water such that
they cannot be detected by sight, taste, or smell even though they may still pose a
threat to human health.
Materials:
· 9 stirrers (toothpicks)
· 1 small container of water—used to dilute the solutions with water.
· 1 large container of water—used for rinsing the pipettes between transfers.
· 2 plastic dropping pipettes for use in serial dilution procedure—one for water and
one for transferring dye solution from one well to another.
· 1 pipette full or dropping bottle of food coloring
· 1 white plastic spot plate
Procedure:
1. Decide on a system for numbering the wells from 1-10. You will have 2 wells left
over.
2. Place 10 drops of food coloring into well #1. This food dye is already a 1/10 solution.
The first column of the table is filled out for well #1, as an example.
3. Take one drop from well #1, transfer it to well #2, and return any extra to well # 1.
Note: Plastic droppers tend to splatter when almost empty. Don’t try to expel the
last drop. Rinse the dropper thoroughly.
4. Using a new dropper, add 9 drops of water to well #2 and stir the solution. Keep
this dropper only for water.
5. This solution, in well #2, is now 1/10 of 1/10 or 1/100. Complete the table for this
solution.
6. Continue the serial dilution by taking one drop from well #2 and placing it in well #3
then adding 9 drops of clean water (Don’t forget to rinse the food coloring dropper).
7. Continue the serial dilution until all 10 wells are occupied and the table is complete.
My Environment, My Health, My Choices 18
© 2006, University of Rochester
May be copied for classroom useObservations and Data:
Well 1 2 3 4 5 6 7 8 9 10
Fraction 1/10
Decimal 0.1
% 10 %
ppm 100,000
Color Yes,
Visible? dark
My Environment, My Health, My Choices 19
© 2006, University of Rochester
May be copied for classroom useConclusions and Questions:
1. Which was the highest numbered well in which some color was visible? What is the
concentration of food coloring in this well in ppm? In percent ?
2. Does a lack of visible color in the remaining wells mean that no food coloring is
present? Defend your answer.
3. Design a simple experiment to show that food coloring is still present in all the wells.
4. Which of the wells represents a concentration of 1 part per billion? How many times
more concentrated is 5 ppm than 5 ppb?
My Environment, My Health, My Choices 20
© 2006, University of Rochester
May be copied for classroom use5. One formula for calculating parts per million is:
Parts per million =grams of solute X 1 000 000
grams of solution
Show a correct numerical set up to demonstrate that a 4 mg/L concentration in
water is equivalent to 4 ppm. You may use 1 g/mL as the density of water.
Application:
An increase of one whole number on the pH scale represents a 10 times decrease in
effective acid concentration. For example, an acid solution with a pH of 2 is 10 times less
acidic than one with a pH of 1. How many times less acidic is an acid solution with a pH of
5 than one with a pH of 2?
To what total volume would you need to dilute 1 liter of a solution with a concentration
of 20 ppm of a toxic substance to produce a solution with a concentration of 20 ppb?
My Environment, My Health, My Choices 21
© 2006, University of Rochester
May be copied for classroom useWell, What Will We Drink? Presentation Should the Alvarez family continue to use their well water or should they switch to the public water supply? Use your research and the information in the Orchard Hill Labs well water test report to take a position on this issue. Prepare a 3 minute presentation for the Alvarez family. Your presentation must make a recommendation (take a position) and defend (support) it with information from your research. Outline your presentation below. Also, prepare a poster that summarizes the main points used to defend (support) your group’s recommendations. My Environment, My Health, My Choices 22 © 2006, University of Rochester May be copied for classroom use
Orchard Hill Labs
State Certified Water Testing

Re: 7459 MacIntosh Rd
    Orchard Hill, NY
    Water testing of premises well for mortgage

Summary:
Water sample was collected at 8:03AM May 8, 2006 from outside spigot on south wall
of house. First draw lead sample was collected, then water was allowed to run 5
minutes before second sample taken. Water was received at the lab at 10:30AM. All
parameters tested for were below MCL standards. At the time of
sampling, this well was within acceptable ranges.

Test results:

                    Biologicals    MCL        Result
                    Total Coliform < 10/100mL 0
                    Fecal Coliform 0 (zero)   0

                  Chemical              MCL          Result
                  Lead (first draw)     0.015mg/L    0.010mg/L
                  nitrate               10mg/L       3mg/L
                  nitrite               1mg/L        0
                  pH                    No limits1   6.9
                  sodium                No limits2   10mg/L

         Notes
         1. EPA standard 6.5 to 8.5. Lower pH may increase corrosion of water systems
         2. Water with more than 20mg/L should not be used for drinking by people on
            severely restricted sodium diets.

Recommendations:
     · Retest yearly
     · Consider pesticide testing due to property’s agricultural history

My Environment, My Health, My Choices                                                   23
© 2006, University of Rochester
May be copied for classroom use
Sample Student Answers: Well, What Will We Drink? Your Task
Well water
1. Who is responsible for ensuring the safety of private well water? The owner of
the well
2. What tests are recommended for private well water? How much do they cost?
Listed on “Individual Water Supply Wells – Fact Sheet #3” New York State
Department of Health. Costs can be found online, varies with tests selected.
3. How often should it be tested? Recommendations vary, probably at least yearly.
Most well owners that I spoke to don’t test.
4. List some factors that could cause well water quality to change. Answers will vary,
include drilling, mining or construction nearby, fuel spills, agricultural activity
5. What conditions might indicate the need for testing? Answers will vary, include
odor, illness, bad taste, etc.
Public water supply
6. What is the source of the public water supply? Varies, provided in the water
quality report for the area chosen.
7. What is the cost of water? Convert this into price per gallon. Varies, for
Rochester it is $2.57 for 1000 gallons, or 0.257¢
8. What is added to the water? For what purpose? Usually chlorine for disinfection
and fluoride to help prevent tooth decay
9. How does lead get into drinking water? What is the concern? Through water
supply lines or contamination of the water source. Lead can cause delays in
physical and mental development in children
10. What chemical water quality categories are monitored? Inorganics, organics,
radiologicals, disinfection byproducts
11. What is the pH of the public water supply? Is this acidic, basic or neutral? Why is
it monitored? Varies. Varies. It is monitored to prevent excess corrosion of water
equipment.
Contaminants
12. What units are used most frequently in the Detected Contaminants tables? How
are these units defined? mg/L corresponds to one part per million, µg/L
corresponds to one part per billion. Definitions are given in the public water supply
report.
My Environment, My Health, My Choices 24
© 2006, University of Rochester
May be copied for classroom use13. Are any contaminants above the regulatory limits? Will vary. Usually not.
14. What is an MCL? What is an Action Level (AL)? An MCL is Maximum Contaminant
Level. Action Level is the level which triggers treatment or other requirements.
15. Each group member should choose and identify one measured contaminant for which
there is an MCL. Complete the table provided for these contaminants.
16. Why are disinfectant by-products monitored? What are the risks? They can cause
illness if they are present in large quantities.
17. Are there any specific contaminants that the Alvarez’s should be particularly
concerned about, for their household? Answers will vary and may focus on the
needs of the older grandmother and their desire to have children.
Sample Student Answers:
Well, What Will We Drink? Contaminant Table
Contaminant Name MCL Potential Health Effects Common sources in Drinking Water
Example
antimony 0.006 increase in blood discharge from petroleum refineries,
mg/L cholesterol fire retardants, ceramics, electronics,
decrease in blood sugar solder
My Environment, My Health, My Choices 25
© 2006, University of Rochester
May be copied for classroom useMy Environment, My Health, My Choices 26 © 2006, University of Rochester May be copied for classroom use
Sample Students Answers: ppm, ppb, and Serial Dilution Lab

Observations and Data

 Well                  1                2           3         4        5          6            7            8          9            10

                                                                                         1/          1/           1/            1/
 Fraction       1/10            1/100       1/1000      1/10000   1/100000   1/1000000
                                                                                         10000000    100000000    1000000000    10000000000

 Decimal        0.1             0.01        0.001       0.0001    0.00001    0.000001    0.0000001   0.00000001   0.000000001   0.0000000001

                                                                                                                                0.00000001
 %              10 %             1%         0.1%        0.01%     0.001%     0.0001%     0.00001%    0.000001%    0.0000001%
                                                                                                                                %

 ppm            100 000          10 000     1 000       100       10         1           0.1         0.01         0.001         0.0001

                                                                  usually
 Color
                Yes, dark                                         last
 Visible?                                                         visible

My Environment, My Health, My Choices                                                                                                     27
© 2006, University of Rochester
May be copied for classroom use
Conclusions and Questions:
6. Which was the highest numbered well in which some color was visible? What is the
concentration of food coloring in this well in ppm? In percent ?
Usually 5, maybe 6
10 ppm or 1 ppm
0.001% or 0.0001%
7. Does a lack of visible color in the remaining wells mean that no food coloring is
present? Defend your answer.
Food coloring is still present but in amounts too small to be visible.
It was transferred into the wells so it must be there.
8. Design a simple experiment to show that food coloring is still present in all the wells.
Answers will vary. Evaporation of the water will show a visible color residue
for a few more cells. Some students may know about spectrophotometry.
9. Which of the wells represents a concentration of 1 part per billion? How many times
more concentrated is 5 ppm than 5 ppb?
Well number 9 is one part per billion. 5 ppm is 1000 times more
concentrated than 5ppb.
10. One formula for calculating parts per million is:
Parts per million =grams of solute X 1 000 000
grams of solution
Show a correct numerical set up to demonstrate that a 4 mg/L concentration in
water is equivalent to 4 ppm. You may use 1 g/mL as the density of water.
1 L = 1000mL D = m/V grams of solute
Parts per million = X 1 000 000
m=DXV grams of solution
m = 1 g/mL (1000 mL)
m = 1000 g ppm = 0.004 g X 1 000 000
1000 g
4mg = 0.004 g
ppm = 4 ppm
My Environment, My Health, My Choices 28
© 2006, University of Rochester
May be copied for classroom useApplication:
An increase of one whole number on the pH scale represents a 10 times decrease in
effective acid concentration. For example, an acid solution with a pH of 2 is 10 times less
acidic than one with a pH of 1. How many times less acidic is an acid solution with a pH of
5 than one with a pH of 2?
An acid solution with a pH of 5 is 1000 times less acidic than one with a pH of 2.
Assume you have 1 liter solution with a concentration of 20 ppm of a toxic substance.
How much water would you need to add to this solution reduce the concentration of the
toxic substance to 20 ppb?
1 ppm = 1000 ppb so therefore 20 ppm is 20 000 ppb. You would need to dilute
it to a volume of 1000 liters of solution. (Add 999 L)
My Environment, My Health, My Choices 29
© 2006, University of Rochester
May be copied for classroom useYou can also read