WelshGE2015 Survey: Post-Election Insights on Voting in Singapore

Page created by Emma Mendoza
 
CONTINUE READING
WelshGE2015 Survey: Post-Election Insights on Voting in Singapore
WelshGE2015 Survey:
Post-Election Insights on
Voting in Singapore
BRIDGET WELSH
P RO F ES S O R , I P E K U N I V E RS I T Y/ S E N I O R R ES EA RC H A S S O C I AT E, C E N T E R FO R EA S T
A S I A D E M O C R AT I C S T U D I ES , N AT I O N A L TA I WA N U N I V E RS I T Y/ S EN I O R A S S O C I AT E
F E L LOW, T H E H A B I B I E C E N T E R / U N I V E RS I TY F E L LOW, C H A R L ES DA RW I N
U N I V E RS I T Y
WelshGE2015 Survey: Post-Election Insights on Voting in Singapore
About the Welsh GE2015 Survey
                   This survey is an independent assessment of
                   factors explaining voting behavior in Singapore’s
                   GE2015.
                   The purpose of the Welsh GE2015 Survey is to
                   contribute to understanding and knowledge, to
                   complement and expand the existing research on
                   the political views of the Singaporean public.
                   Welsh GE2015 was privately funded by a
                   Singaporean citizen and implemented by a
                   research firm based in Singapore.
                   The survey questions and analysis were
                   developed by Professor Bridget Welsh, with
                   technical assistance provided by the Merdeka
                   Center. Questions regarding the survey can be
                   directed to bridgetwelsh1@gmail.com
WelshGE2015 Survey: Post-Election Insights on Voting in Singapore
Sampling of the Welsh GE2015 Survey
The survey was conducted by telephone.
A total sample size of 800 were interviewed,
with the results weighted in line with the
Singapore Department of Statistics 2010
Census of Population updated annually for
gender, ethnicity and age distribution.
The sample size is a nationally representative
sample with a margin of error of +/- 3.46%.
The survey had a refusal rate of 18%,
indicating reluctance to participate in survey
research on political issues.
WelshGE2015 Survey: Post-Election Insights on Voting in Singapore
Source(s) of Information: Findings
                     GE2015 was not an Internet/Social Media
                     Election
                     Mainstream media remains the dominant
                     source of information for political affairs,
                     especially television.
                     Social media and chat groups were less
                     influential as a source of information, although
                     chat groups were more important than in
                     GE2011.
                     Chat groups, such as WhatsApp, were the least
                     impactful as a news source.
WelshGE2015 Survey: Post-Election Insights on Voting in Singapore
Source(s) of Information
Main sources of information about domestic political and current affairs
80%

             71%
70%
                                                                    Mainstream media dominates
60%                             57%                                 information flow                                                        First

                                                                                                                                            Second
50%
                             44%
                                                                                                                                            Total
                 41%
40%
                                                    34%

         30%
30%                                                                      26%

                                                       20%                 19%
20%
                                                14%
                                    12%
10%                                                                                         8%
                                                                    7%                           6%
                                                                                       2%                       2%
                                                                                                           1%        1%              1%             1%
 0%
         TV Channel         Newspaper             Internet        Social media           Radio            Chat group        Not following      Others
                                                                                                                               news

 Q: Please tell me TWO sources/channels you consider to be your main source of information about domestic political and current affairs?
WelshGE2015 Survey: Post-Election Insights on Voting in Singapore
Prioritization of Sources of Information
                 1 - Lowest       2      3      4       5 - Highest      Unsure/Refuse

Newspaper                 13%                       13%                                                        33%                               21%   14%   6%

TV Channel            11%                11%                                           25%                                                26%          22%   5%

 Facebook                               21%               9%                             18%                           16%                 11%               25%

WhatsApp
 Group
                                                                       38%                 11%                        14%        5% 3%                       28%

                                 Mainstream media most important information source in GE2015
             Q: On a scale of 1-5 with 5 as the highest, how influenced were you by the following sources in the 2015 General Election?
WelshGE2015 Survey: Post-Election Insights on Voting in Singapore
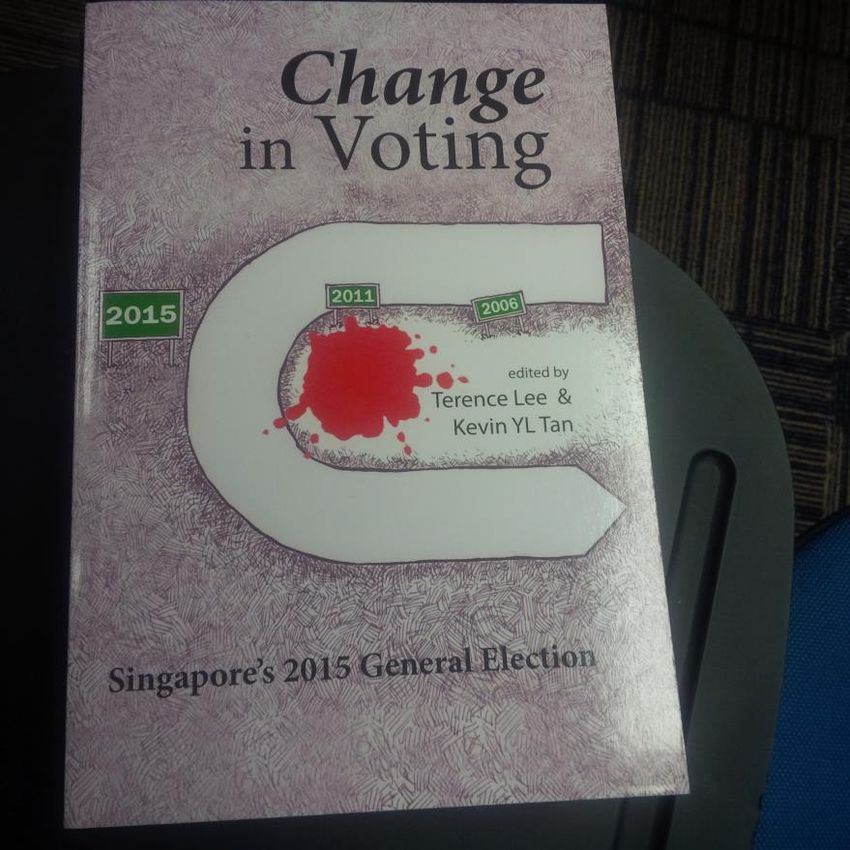
Views of Current Political Conditions
.                    A large majority perceive the country moving
                     in the right direction, with nearly a third of
                     Singaporeans strongly holding this view.
                     There are only modest demographic
                     differences in public perceptions of the
                     direction of the country.
                     For those Singaporeans perceiving the country
                     moving in the right direction, stability,
                     government performance and economic
                     development are the main reasons provided.
                     For those Singaporeans perceiving the country
                     moving in the wrong direction, immigration
                     and cost of living issues were the most
                     important, followed by concerns with
                     government performance.
WelshGE2015 Survey: Post-Election Insights on Voting in Singapore
Very positive views
Direction of the Country                                                                                                    on the direction of
                                                                                                                            Singapore

                                                                       Ethnicity / Gender                                                      Age Group
                                                               Right             Wrong                                            Right             Wrong
                                                       100                                                                100
                10%
                                                        80                                                                 80   89
           2%                                                               81           81         79          79                                                  79       83
                                                               78                                                                                        75
                                                        60                                                                 60                 73
       9%                            30%
                                                        40                                                                 40
                                                                     11          10           15         13          10
                                                        20                                                                 20         6                                  8        8
                                                                                                                                                   19         13
                                                          0                                                                 0
                                                              Chinese Malay Indian&                 Male       Female           21-29         30-39      40-49      50-59     > 60
                                                                             Others

                                                                 Household income ($)                                                     Education Level
                 49%                                   100      Right            Wrong
                                                                                                                          100     Right             Wrong

                                                        80                                                                 80
                                                                                               81              86                                                            85
                                                        60      77               76                                        60    74                78          77

                                                        40                                                                 40
    Strongly right             Strongly wrong                          13             13            13                                                              18
                                                        20                                                           11    20             6             11                        8
    Somewhat right             Somewhat wrong
                                                          0                                                                 0
    Unsure                     Refuse                         < $2,500       $2,501 –         $5,001 -        > $7,501          No formal/ Lower/  Diploma &                 Deg. &
                                                                              $5,000          $7,500                             Primary Secondary equivalent                above

  Q: Considering the conditions in the country today, how strongly would you say that things are heading in the right or wrong
  direction?
WelshGE2015 Survey: Post-Election Insights on Voting in Singapore
Direction of the Country
                                  79%                                                                              11%
                        RIGHT DIRECTION (n=633)                                                            WRONG DIRECTION (n=90)

                              Stability                           24.60%                 Negative Impact Foreign Influx                                25.60%

  Good Government Performance                          11.60%                                High Cost of Living/Inflation               14.30%

              Favourable Economic                                                       Poor Government Performance                   10.00%
                                                   9.00%
                 Development
                                                                                            Inadequate Political Change               9.90%
           Government Doing Best               4.10%
                                                                                         Housing Prices and High Fees
    Educational Opportunities and                                                                                              4.40%
                                                                                          Education and Healthcare
                                               3.80%
              Policies
                                                                                                            Poor Policies      3.90%
          Leadership Quality and
                                               3.50%
                Engagement                                                             Social Differences and Problems        3.00%
            Social Welfare Benefits           3.10%
                                                                                     Governance/Lack of Transparency         2.20%
                                Others                    16.70%
                                                                                                                  Others              10.00%
                               Unsure                           21.30%                                            Refuse     1.00%

                               Refuse        1.40%                                                                Unsure                      16.40%

             Stability and Economy versus Foreigners/Jobs and Cost of Living
Q: And what would you say is the issue that is the main reason for you answering right/wrong direction?
WelshGE2015 Survey: Post-Election Insights on Voting in Singapore
High satisfaction
Satisfaction with the Government                                                                                                                                              reported

                                                                    Ethnicity / Gender                                                          Age Group
                                                                Satisfied             Dissatisfied                                 Satisfied             Dissatisfied
                                                      100                                                                  100
                 3%4%
                                                       80                                                                   80                                                    89
                                                              83            84                                   85              87                        82           84
         11%                                                                            78           80
                                                                                                                                               73
                                    28%                60                                                                   60
                                                       40                                                                   40
                                                       20           12           12                                   10    20         11                       12           11
                                                                                             20           16                                        24                                  6
                                                         0                                                                   0
                                                             Chinese Malay Indian&                   Male       Female           21-29         30-39       40-49        50-59      > 60
                                                                            Others

                                                                Household income ($)                                                        Education Level
                54%                                   100
                                                                Satisfied             Dissatisfied
                                                                                                                           100
                                                                                                                                   Satisfied             Dissatisfied

                                                       80                                                                   80
                                                               83                83                             87                85                86                            84
                                                                                                79                                                                 75
                                                       60                                                                   60
                                                       40                                                                   40
  Strongly satisfied      Strongly dissatisfied        20                                                             11    20          9                10                            12
                                                                                                     19                                                                 22
  Somewhat satisfied      Somewhat dissatisfied                      14               14
                                                         0                                                                   0
   Unsure/ Refuse                                            < $2,500        $2,501 –          $5,001 -        > $7,501          No formal/ Lower/  Diploma &                     Deg. &
                                                                              $5,000           $7,500                             Primary Secondary equivalent                    above

  Q: How satisfied or dissatisfied are you with how the government is performing these days?
Satisfaction with the Government
                                      82%                                                                             13%
                               SATISFIED (n=661)                                                              DISSATISFIED (n=106)
         Singapore is doing
                                                                       12%              High cost of living/inflation                  20%
            well/Stability

        Peaceful conditions                                        10%                          Influx of Foreigners                 17%

   Social Welfare Benefits                                7%                                  Lack of transparency           7%

  “Effective Administration                      4%                                     CPF issues/Wages issues          5%

       Favorable Economic                                                              Inadequate Welfare for the
                                            3%                                                                           5%
           Conditions                                                                           People

                                                                                     Inefficiency of transportation
               Good policies                3%                                                                          3%
                                                                                             (poor services)

        Unsure/ Don't know                                         13%                              Unsure/ Refuse       9%

Q: What would you say is the issue that is the main reason for your answer? (satisfied with performance)
Participation in GE2015
                     Nearly two-thirds of Singaporeans followed
                     the GE2015 campaign, challenging the myth
                     that Singaporeans are politically apathetic.
                     Interest is high among younger Singaporeans.
                     Voting remains the main form of political
                     participation, with only small shares of
                     Singaporeans attending rallies or engaging in
                     campaigning.
Follow the Election Campaign
                                                     High engagement with campaign, with modest variation

                                                                   Ethnicity / Gender                                                Age Group
                                                                Yes              No                                          Yes               No
                    2%                              80                                                            80

                                                    60                67                    66                    60   67
                                                          64                                            61                          65         63         62        61
                                                                                 58
                                                    40                                                            40
    34%                                                                               39                     37                                                36
                                                                34         33                    32                          33          35         35                   34
                                                    20                                                            20

                                                     0                                                             0
                                                         Chinese Malay           Indian&    Male        Female         21-29        30-39      40-49      50-59      > 60
                                    64%                                           Others

                                                               Household income ($)                                                Education Level
                                                                Yes              No                                          Yes               No
                                                    80                                                            80

                                                    60                                                 72         60    69                                          68
                                                           62              66          65                                                            65
                                                                                                                                         58
                                                    40                                                            40
   Yes                                                                                                                                        40
                                                    20           35             33          33                                                            33             30
  No                                                                                                        27    20          27
   Unsure/Refused                                    0                                                             0
                                                          < $2,500     $2,501 –       $5,001 -        > $7,501         No formal/     Lower/   Diploma &            Deg. &
                                                                        $5,000        $7,500                            Primary      Secondary equivalent           above

 Q: Did you follow the 2015 Singapore General Election campaign?
Forms of Participation in GE2015 Campaign
    140%
                                                                                                                            First       Second

    120%

                                                                                 Political participation in campaigning low,
    100%
                                                                                 with rally attendance and chatting among
                                                                                 highest forms outside of voting.
    80%         74%
                         63%
    60%

    40%

    20%                                  15%                                 16%
                                                    8%                                               7%                   5%
                                                                    4%                       3%                   4%                           2%
                                                                                                                                       1%
     0%
                     Vote             Attend Political Rally     Participate in a chat   Persuade someone to Post blog/ on Facebook   Campaign worker
                                                                         group                  vote

      Q: Which of the following did you participate in during the GE campaign?
Views of Leadership: Findings
                     Prime Minister Lee Hsien Loong, Emeritus Senior
                     Minister and Deputy Prime Minister Tharman
                     Shanmugaratnam from the PAP have the most
                     favorable public assessments among the politicians
                     surveyed.
                     Around a quarter of Singaporeans are not familiar with
                     many leading Singaporean politicians.
                     Opposition politicians, in particular Chee Soon Juan
                     and Tan Jee Say, have the highest unfavorability ratings
                     by the public, although their favorability assessments
                     are higher than their negative views indicating
                     polarization of views of these leaders in the public.
                     Most Singaporeans are unsure who will be the future
                     prime minister of Singapore after Lee Hsien Loong.
                     Those that do answer primarily indicate Deputy Prime
                     Minister Tharman Shanmugaratnam.
Perception towards Leadership
                            Very favourable       Somewhat favourable          Somewhat unfavourable        Very unfavourable      Do not know this party      Unsure/Refuse

100%                                                                                                                                                  2%
                                                                                                                                     7%                               7%            4%
                             11%               11%               14%                                               11%
90%
                                                                                   30%                                                               24%                           19%
80%                                                                                                 39%                             25%
                                                                                                                                                                     32%
            52%
70%                          38%                                                                                   36%                                                             13%
                                               41%               39%                                                                                 13%
60%                                                                                                                                 12%
                                                                                                                                                                     12%
50%
                                                                                   47%                             12%                                                             35%
                             12%                                                                    34%                                              34%
                                               12%                9%                                                                27%
40%
                                                                                                                                                                     27%
30%         32%
                             22%                                 22%                                               28%
                                               23%                                                  9%
20%                                                                                 8%                                              19%                                            20%
                                                                                                                                                     21%
            7%                                                                      2%                                                                               17%
10%                          13%                                 11%                                13%
            1%                                  9%                                 10%                             10%
            6%                                                                                                                      10%               7%                            9%
            2%                4%                3%                5%                2%              4%                                                                5%
 0%                                                                                                 1%              2%
       Lee Hsien Loong Low Thia Khiang    Yaacob Ibrahim        Vivan         Goh Chok Tong       Tharman     Tan Chuan-Jin     Chee Soon Juan    Lina Chiam       Sylvia Lim   Tan Jee Say
                                                             Balakrishnan                      Shanmugaratnam

                    Q: Do you have a favourable or unfavourable opinion of the following leaders?
Future Prime Minister
70%
                                                                                                                               64%
60%

                                                           Uncertainty over future political leadership
50%                                                        Nearly a fifth of Singaporeans select Deputy
                                                           Prime Minister Tharman Shanmugaratnam
40%

30%

20%        19%

10%
                                4%                  3%                                                             4%
                                                                        3%             3%
                                                                                                       1%
0%
         Tharman     Chan Chun Sing           Teo Chee Hean        Tan Chuan Jin   Heng Swee Keat Yaacob Ibrahim   Others   Unsure/ Refuse
      Shanmugaratnam

 Q: Who do you think will be the next prime minister after Lee Hsien Loong?
Views of Political Parties
                       Among political parties, PAP has the most favorability
                       among Singaporeans, with limited unfavorability.
                       WP is the most popular opposition party with high levels
                       of favorability, especially when compared to other
                       opposition parties.
                       All of the opposition parties except WP have higher
                       unfavorable than favorable assessments among
                       Singaporeans. Reform Party, National Solidarity Party and
                       Singaporean Democratic Alliance has the most unfavorable
                       assessments. The favorable views of non-WP opposition
                       parties are less than a quarter of Singaporeans, with the
                       Singapore Democratic Party recording the most
                       favorability after WP.
                       A large majority of Singaporeans perceive the PAP as
                       engaging in party renewal.
                       Singaporeans are split on their views of the opposition’s
                       performance in parliament, but a majority of Singaporeans
                       want a stronger opposition.
Perception towards Political Parties
          Very favourable       Somewhat favourable           Somewhat unfavourable            Very unfavourable   Do not know this party    Unsure/Refuse

100%                                              4%                                                  2%                            2%            1%
                                                                   8%                7%                             9%                            7%
                               11%                                                                                                  8%
90%                                                                                                  14%
                                                 20%
                                                                                     17%                           17%                           18%
80%
                                                                   19%                                                              16%
             43%
                                                                                                     18%
70%                                              15%
                                                                                     18%
                               48%                                 19%                                             20%              21%
60%                                                                                                                                              24%
                                                                                                     15%
                                                 14%
50%

                                                                                     31%
40%                                                                                                                33%
                                                                   33%                                                              30%
             42%               11%                                                                   32%                                         28%
30%                                              32%
                                5%
20%
                               18%
              6%                                                                     27%                                            23%
10%                                                                21%                               18%           22%                           21%
              1%                                 16%
              5%                7%
 0%           3%
             PAP         Workers' Party      Singapore         Singapore        Reform Party     Singapore        National      Singaporeans People's Power
                                            Democractic       Democractic                       People's Party Solidarity Party     First        Party
                                               Party            Alliance

  Q: Do you have a favourable or unfavourable opinion of the following political parties?
Perceptions towards PAP                                                                                                Party renewal perceived by a majority of the public.

                                                                     Ethnicity / Gender                                                       Age Group
                                                                  Agree              Disagree                                      Agree               Disagree
                                                       100                                                                 100
                    9%
           3%                                            80                                                                 80
                                                               77          78                                    81              81                      79                      83
                                    27%                  60                            74            73                     60               69                        74
      11%                                                40                                                                 40
                                                         20                     10                                     8    20                                12            11         8
                                                                                            18            20                           14         24
                                                                     14
                                                          0                                                                  0
                                                              Chinese Malay Indian&                  Male       Female           21-29       30-39       40-49         50-59      > 60
                                                                             Others

                                                                 Household income ($)                                                       Education Level
                                                                  Agree              Disagree                                      Agree               Disagree
                     50%                               100                                                                 100
                                                         80                                                                 80
                                                                                80                              80                                83
                                                         60     77                              74                          60    74                                             75
                                                                                                                                                                  71
                                                         40                                                                 40
   Strongly agree           Strongly disagree            20                                                                 20          8              11
                                                                                                     20                                                                19             16
   Somewhat agree           Somewhat disagree                         14             14                               14
                                                          0                                                                  0
  Don’t know                No response                        < $2,500     $2,501 –            $5,001 -       > $7,501          No formal/ Lower/  Diploma &                    Deg. &
                                                                             $5,000             $7,500                            Primary Secondary equivalent                   above

  Q: Do you think PAP renewal (re-generating) as a party is progressing well?
Effectiveness of Opposition In Parliament
   Split views of opposition performance, with interesting demographic differences

                                                                      Ethnicity / Gender                                                     Age Group
                                                                   Effective             Not effective                           Effective          Not effective
                                                      80                                                              80
                            7%
             17%                                      60                                                              60

                                                      40                            50                                40         54     52          49
                                                                       49                         45 42 41
                                                             41 42             38                          38              41                 38                    39 39        40
                                                      20                                 34 32 36                     20                                  33                31

     19%                                  36%           0                                                              0
                                                            Chinese Malay Indian Others Male Female                        21-29         30-39       40-49          50-59    > 60

                                                                Household income ($)                                                    Education Level
                     22%                                           Effective             Not effective                           Effective          Not effective
                                                      80                                                              80

                                                      60                                                              60

                                                      40                        50                                    40
                                                              47                                 44 48      44 48                             45            45 47                48
                                                                                     36                                     40                                              40
                                                      20             35                                                                            35
    Very effective         Not effective at all                                                                       20
                                                                                                                                   24
   Somewhat effective      Somewhat not effective       0                                                              0
    Unsure/ Refuse                                           < $2,500          $2,501 –         $5,001 -   > $7,501        No formal/         Lower/   Diploma &            Deg. &
                                                                                $5,000          $7,500                      Primary          Secondary equivalent           above

   Q: How effective was the opposition in parliament before the election campaign?
Perspectives on Strength of Opposition
                                    Nearly two-thirds stated they wanted a stronger opposition, with variations
                                                                      Ethnicity / Gender                                                     Age Group
                                                                  Strong              Adequately                                 Strong               Adequately
                                                      80                                                                  80
              14%                                                                                                              77
                                                      60               71                                                 60
                                                                                                      62                                    64          61
                                                            56                   56        59
                                                      40                                                        54        40                                        48
      11%                                39%                                          35                                                                                      40
                                                      20                                                                  20                                             34        31
                                                                 29                             27         29        28                          28          28
                                                                            17                                                       20
                                                       0                                                                   0
                                                           Chinese Malay Indian Others Male Female                             21-29        30-39       40-49       50-59      > 60

       18%
                                                                 Household income ($)                                                      Education Level
                         19%                                      Strong              Adequately                                 Strong               Adequately
                                                      80                                                                  80

                                                      60                                                    66            60                                                  67
                                                                             65              62                                                                64
   Strong agreement with stronger opposition                 55                                                                                  53
                                                      40                                                                  40
   Somewhat agreement with stronger opposition
                                                      20              31                             31          31       20    34                    32
                                                                                                                                      29                            28
   Strong agreement with adequate opposition                                      24                                                                                               24
  Somewhat agreement with adequate opposition          0                                                                   0
                                                            < $2,500        $2,501 –        $5,001 -       > $7,501            No formal/     Lower/   Diploma &              Deg. &
   Unsure/Refused                                                            $5,000         $7,500                              Primary      Secondary equivalent             above

  Q: In the recent election campaign, did you think that Singapore needed a stronger opposition or was strong enough?
Election Issues in GE2015
                     Specific Issues were not as important as
                     perceptions of the political party and
                     candidate in GE2015.
                     Singaporeans identified a wide range of issues
                     in GE2015, with social welfare and future
                     benefits as well as cost of living/inflation and
                     immigration as among the most prominent.
                     When given a list of issues to prioritize, cost of
                     living and social welfare remained important,
                     with immigration less so and housing more so.
                     The LKY factor and Town Council governance
                     were not prioritized among Singaporeans.
Citizen-Identified Campaign Issues
                 Refuse to Ansure                              4.3%
                           Unsure                                                                                                                     19.7%
                           Others                                 4.7%
                             None           1.2%
              Ministerial Salaries    0.1%
             Town Council Issue        0.3%
          Race/Ethnic Relations          0.6%                                                 Nearly a third of Singaporeans could not identify an
                    Transparency           0.9%                                               issue that was important to them, with around a fifth
                         CPF Issue          1.0%                                              of Singaporeans pointing to non-specific issues such
      Fairness for Singaporeans             1.1%                                              as political party strength and candidate qualities.
                       Education               1.6%
         Fulfillment of Promises                1.7%
                 Healthcare costs                 2.0%
                Job Opportunities                  2.1%
                 National Policies                    2.5%
   Transportation Management                             3.1%
   Opposition Voice Parliament                             3.4%
Affordable Housing/ HDB Prices                              3.5%
Improving Economic Conditions                                3.6%
                          Stability                              4.3%                                                          Q: In the recent
                  Foreigner Influx                                                                                             election campaign,
                                                                    4.8%
                                                                                                                               was there a
        Social Welfare Benefits                                      5.0%                                                      particular issue
        Cost of Living/ Inflation                                     5.2%                                                     that was most
                  Future Benefits                                            6.0%                                              important to you?
             Candidate Qualities                                                    8.4%
      Strength of Political Party                                                      9.0%
                                  0.0%                          5.0%                    10.0%                       15.0%                           20.0%     25.0%
Perceptions of Election Issues
  50%

           43%                                                                                                                          First            Second                     Total

  40%                       38%

  30%
                                           26%
         24%

  20%
              19% 18%20%                               18%          18%              18%

                                             14%                                                        13%
                                          12%                                                                           11%
                                                         10%
  10%                                                  8%    9% 9%                 9% 9%
                                                                                                       7% 6%                6%           6%
                                                                                                                     5%                              5%
                                                                                                                                       3% 3%           3%           3%               3%
                                                                                                                                                    2%             1% 2%
  0%
        Inflation & Cost Social Welfare   Affordable   Economic   Immigration/   Political Stability   Retirement   Appreciation for    Political   Increases in   Discrimination   Unsure/Refuse
             of living                     Housing      Growth     Population                           Security    Lee Kuan Yew       Freedoms     Government
                                                                     Policy                                                                           Benefits

   Q: I am going to read you a list of issues people were seen as important in the past election, which two were the most important
   issues for you?
Voting in GE2015
Singaporeans prioritized party leadership and
candidates in GE2015, followed by the political party.
These factors worked together to influence voters.
Issues were less important in shaping voting behavior in
GE2015. Perceptions of government benefits were also
an important factor.
In self-identified reasons for voting, candidate qualities
and government performance emerged as important.
Only a small minority of voters changed their vote
during the campaign period. Voters in Singapore had
decided how to vote before the campaign started.
A majority of Singaporeans did not perceive the
opposition as having effective grassroots. This extended
to WP in the areas they contested, which has
traditionally been seen to have local grassroots.
57%
Voting Drivers
  60%

                                                                                                                            First      Second         Total

  50%

                                  43%                                                         Important synergies between leadership, candidates
                                                                                              and parties
  40%                                                                                         Issues less important in GE2015, with benefits
                                                     35%
                                                                                              emerging as important
          31%
  30%                                                                    28%                   27%
                  26%                26%
                                                 23%

  20%                         17%                                           17%                   17%
                                                         12%         11%
                                                                                        10%
  10%
                                                                                                              4%                                 6%
                                                                                                                                  3%
                                                                                                            2% 2%               1% 2%
  0%
        Party Leadership       Candidate             Party               Issue           Government        Fear of voting     Other, please     Unsure/Refuse
                                                                                          Benefits          against the          specify
                                                                                                            government

   Q: In this general election, what would you say was your main consideration when voting?
Campaign little impact on voting

Impact of Campaign on Changing Voting
                                                                   Ethnicity / Gender                                                        Age Group
                                                                 Yes                  No                                          Yes                 No
                   5%                                100                                                                  100
                           8%
                                                       80         88                           93         88               80        90          90                               88
                                                                                                                     86                                     84         84
                                                       60                        75                                        60
                                                       40                                                                  40
                                                                            16                                                                         11
                                                       20    7                             5         8           7         20   10           7                    6          4
                                                        0                                                                   0
                                                            Chinese Malay Indian&                    Male       Female          21-29        30-39     40-49      50-59         > 60
                                                                           Others

                                                               Household income ($)                                                       Education Level
                                                                 Yes                  No                                          Yes                 No
                    87%                              100                                                                  100
                                                       80              87                                            90    80                                                    89
                                                                                      86             86                                 87            86          87
                                                       60                                                                  60
    Yes                                                40                                                                  40
   No                                                  20     7                  8              10              8          20    6               7           10             8
    Unsure/Refused                                      0                                                                   0
                                                             < $2,500        $2,501 –          $5,001 -        > $7,501         No formal/ Lower/  Diploma &                Deg. &
                                                                              $5,000           $7,500                            Primary Secondary equivalent               above

  Q: Did you change your intention to vote for the PAP/Opposition during the campaign?
Views of the Opposition Grassroots
                           Perceived weak opposition grassroots, with only third favorable

                                                                      Ethnicity / Gender                                                           Age Group
                                                                   Effective          Not effective                                    Effective          Not effective
                                                       80                                                                   80
                            8%
              15%
                                                       60                                                                   60
                                                                   62                                      63                          60           59          60             61
                                                                                            54                         55                                                                55
                                                       40                       49                                          40
                                      18%
                                                                          39
                                                       20                              32                                   20   32           31
                                                                                                      25          26                                      27
                                                             22                                                                                                           18        19
                                                        0                                                                    0
                                                            Chinese Malay             Indian&         Male        Female         21-29         30-39       40-49          50-59      > 60
                                                                                       Others

        41%                           18%
                                                                  Household income ($)                                                        Education Level
                                                                   Effective          Not effective                                    Effective          Not effective
                                                       80                                                                   80

                                                       60                                             70              69    60                                                           70
     Very effective                                                                  59                                                                                   61
                                                       40            51                                                                                  55
                                                                                                                            40
     Somewhat effective                                                                                                                  39
                                                       20     30                29                                          20    26                29            29
    Not effective at all                                                                      25                 23                                                                 19
                                                        0                                                                    0
    Somewhat not effective                                   < $2,500          $2,501 –      $5,001 -           > $7,501         No formal/         Lower/   Diploma &              Deg. &
     Unsure/Refused                                                             $5,000       $7,500                               Primary          Secondary equivalent             above

   Q: How effective were the opposition grassroots in your area during the election campaign?
Views of Opposition Grassroots of Specific Parties
                  1.                                                                                  2.
                        Singapore Democratic Party (SDP)                                                   Workers’ Party (WP)

                                   7% 1%
                                         14%                                                           9%      2%6%

                                                                                                                            20%

                   32%
                                                            26%

                                                                                                47%                         17%

                                                                Effective, 40%                                                    Effective, 26%
                                        20%

      Very effective                  Not effective at all                 Unsure
      Somewhat effective              Somewhat not effective               Refuse                     In areas where specific opposition parties
                                                                                                      contested, there were different views of
   Q: How effective were the opposition grassroots in your area during the election campaign?         opposition grassroots effectiveness.
Institutional Impact on GE2015
                    Nearly two-thirds of Singaporeans reported
                    receiving government benefits in the year before
                    the election. This finding has surprisingly few
                    demographic differences.
                    People’s Associations were perceived as
                    prominent in the GE2015 campaign, but there
                    were greater demographic differences in
                    perceptions.
                    People’s Associations were seen to boost the
                    performance of the PAP in GE2015 by a majority
                    with a third disagreeing.
                    A majority of Singaporeans did not report
                    receiving benefits at the local level through the
                    PAs, with nearly a fifth reporting they did receive
                    local benefits.
Received Government Pre-Election Funds
                          Nearly two-thirds reported receiving government funds
                                                                      Ethnicity / Gender                                                 Age Group
                                                                    Yes              No                                          Yes               No
                     4%                                 80                                                            80

                                                        60                                      66                    60                                                66
                                                              64          64         62                     62             63           64         65         62
                                                        40                                                            40
     32%                                                20          32         33         34         31          33   20         34          35         31         32        29

                                                         0                                                             0
                                                             Chinese Malay           Indian&    Male        Female         21-29        30-39      40-49      50-59      > 60
                                                                                      Others
                                       64%
                                                                   Household income ($)                                                Education Level
                                                                    Yes              No                                          Yes               No
                                                        80                                                            80

                                                        60     69              67          68                         60                     68
                                                                                                           65               61                           62             62
                                                        40                                                            40
    Yes                                                                                                                                                       36
                                                        20                          29          32              33    20          30              29                         34
   No                                                                27
    Unsure/Refused                                       0                                                             0
                                                              < $2,500     $2,501 –       $5,001 -        > $7,501         No formal/     Lower/   Diploma &            Deg. &
                                                                            $5,000        $7,500                            Primary      Secondary equivalent           above

  Q: Did you receive government funds in the year before the election, e.g. tax rebate, subsidy etc.?
People’s Association Organizations
                                                        PAs were prominent in the GE2015 campaign, but views varied across Singaporeans.

                                                                       Ethnicity / Gender                                                       Age Group
                                                                   Prominent           Not Prominent                                     Prominent            Not Prominent
                                                       80                                                                    80
             16%                  20%                  60                                                                    60
                                                                        62        64
                                                                                             57                                   58           57
                                                       40    49                                          52        53        40                           52           52
                                                                                                                                                                                   45
                                                                  33                                          34                        32          33          36
                                                       20                              29                               28   20                                               28
                                                                             23                   19                                                                                    24
     17%                                                0                                                                     0
                                                            Chinese Malay Indian Others Male Female                               21-29        30-39      40-49        50-59        > 60

                                    32%                           Household income ($)                                                        Education Level
            14%
                                                                    Prominent            Not Prominent                                   Prominent            Not Prominent
                                                       80                                                                    80

                                                       60                                                                    60
                                                              59               62
    Very prominent                                                                            52                                   55               57            55
                                                       40                                                      47 46         40
                                                                                                                                                                                   45 46
    Somewhat prominent                                                                                 36
                                                       20                           26                                       20                                        30
     Not prominent at all                                              20                                                                                24
                                                                                                                                         11
                                                        0                                                                     0
      Somewhat prominent
                                                             < $2,500        $2,501 –         $5,001 -        > $7,501            No formal/     Lower/   Diploma &                Deg. &
     Unsure/Refused                                                           $5,000          $7,500                               Primary      Secondary equivalent               above

   Q: How prominent were the People's Association organizations such as Residential Committees in your area during the election
   campaign?
Perception of PA impact on PAP
                                      Majority believe PA’s boost PAP, but a third think PAs are not important

                                                                        Ethnicity / Gender                                                            Age Group
                                                                      Yes                   No                                                Yes             No
                                                        80                                                                      80
                11%
                                                        60                                                                      60
                                                                                                           61         60                 61         60
                                                                 56              54                                                                           56             54
                                                        40                                  50                                  40                                                      50
                                                                                      33         35             34                            34                                   33        35
                                                        20            31                                                   29   20                       29        31

                                                         0                                                                       0
     32%                                 56%                     Chinese Malay              Indian&        Male       Female             21-29       30-39    40-49          50-59      > 60
                                                                                             Others

                                                                      Household income ($)                                                          Education Level
                                                                      Yes                   No                                                Yes             No
                                                        100                                                                     100
                                                         80                                                                      80
                                                         60                                           67                         60
                                                                   62                  59                                                                60             60
                                                         40                                                           56         40                                                     54
     Yes
                                                                                                                                          42 39
    No                                                   20                                 35                             35    20                           30              30             34
                                                                            26                             28
     Unsure/Refused                                          0                                                                       0
                                                                  < $2,500            $2,501 –    $5,001 -           > $7,501            No formal/ Lower/  Diploma &                   Deg. &
                                                                                       $5,000     $7,500                                  Primary Secondary equivalent                  above

   Q: Do you think that these organization's benefits influenced people to support the PAP?
Local Benefits: People’s Associations/Grassroots Orgs.
                                                      Low level of perceived PA benefits, but socio-economic variation in benefit received

                                                                           Ethnicity / Gender                                                                Age Group
                                                                         Yes                   No                                                Yes                  No
                                                           80                                                                      80
                       6%                                                                                                                        80
                                                                         78                                        77                                            79        79
                                     18%                   60                                       72                        74
                                                                                                                                   60                                                      71        69
                                                                                         68

                                                           40                                                                      40

                                                           20                       27                                             20
                                                                    15                         21             16         19                 14              18        15             20         21
                                                            0                                                                       0
                                                                    Chinese Malay              Indian&        Male       Female             21-29           30-39     40-49          50-59      > 60
                                                                                                Others

                                                                         Household income ($)                                                           Education Level
                   76%                                     100
                                                                         Yes                   No
                                                                                                                                   100
                                                                                                                                                 Yes                  No

                                                            80                                                                      80
                                                                                                                              86                                                                     85
                                                            60                                                76                                                                      79
                                                                               70              72                                   60                                70
                                                                                                                                                       66
        Yes                                                 40                                                                      40
       No                                                   20                                                           9          20                                                          10
                                                                      24                  22             19                                  23                  23             15
        Unsure/Refused                                          0                                                                       0
                                                                     < $2,500            $2,501 –    $5,001 -           > $7,501            No formal/ Lower/  Diploma &                        Deg. &
                                                                                          $5,000     $7,500                                  Primary Secondary equivalent                       above

      Q: Did you receive any benefits from the People's Association or Grassroots Organisations (RCs etc) before the elections?
Post-Election Reflections
                     Most Singaporeans were either happy or
                     relieved with the election results after GE2015,
                     with a small minority regretful or angry.
                     A majority of Singaporeans do not believe the
                     opposition is adequately strong post-election,
                     with a third believing it is adequately strong.
                     A majority of Singaporeans expressed support
                     for some form of electoral reform. The main
                     reform areas involved the rights of new citizens
                     and independence of the electoral commission.
                     A fifth of Singaporeans believed there was no
                     need for electoral reform.
Perceptions of Post-Election                                                                                                                 High levels of happiness or relief after
                                                                                                                                             the elections.

                                                                     Ethnicity / Gender                                                      Age Group
                                                                  Happy/Relief        Regretful/Angry                             Happy/Relief        Regretful/Angry
                     5%                                100                                                                100

            11%                                          80                                                     89         80                           88          88        89
                                                               84          82           80                                      79
                                                         60                                         78                                      73
                                                                                                                           60
                                                         40                                                                40
                                        41%              20                                                                20
                                                                     16          18          20          22                           21         27
                                                          0                                                          11                                      12          12        11
                                                                                                                            0
                                                              Chinese Malay             Indian      Male       Female           21-29       30-39       40-49       50-59      > 60

            43%                                                  Household income ($)                                                      Education Level
                                                                  Happy/Relief        Regretful/Angry                             Happy/Relief        Regretful/Angry
                                                       100                                                                100
                                                         80     87                                                         80    90              89
                                                                                 83                            80                                                             80
                                                         60                                    76                          60                                  76

   Happy                    Regretful                    40                                                                40
   Relief                   Angry                        20                                                                20
                                                                                      17            24               20                                             24             20
                                                          0           13                                                    0         10              11
                                                               < $2,500     $2,501 –          $5,001 -        > $7,501          No formal/ Lower/  Diploma &                  Deg. &
                                                                             $5,000           $7,500                             Primary Secondary equivalent                 above

   Q: Which of the following emotions best describes your perception after the general elections?
Post-Election Perspective of Strength Opposition
               Majority believe opposition is not strong enough post-election, especially wealthier, more educated and youth
                                                                              Ethnicity / Gender                                                     Age Group
                                                                         Agree               Disagree                                       Agree              Disagree
                                                              80                                                                  80
                     10%          11%
                                                              60                                                                  60        66
                                                                         55        55        57                    59                                    56         57
                                                              40                                        52                   52   40                                            51        47
                                                                                                  41                                                38
                                                                    35        35                              34        35                                     35          36        34
         22%                                                  20                        31                                        20   30
                                              24%
                                                               0                                                                   0
                                                                   Chinese Malay Indian Others Male Female                             21-29        30-39       40-49      50-59      > 60

                                                                         Household income ($)                                                    Education Level
                                                                         Agree               Disagree                                       Agree              Disagree
                         34%                                  80                                                                  80

                                                              60                                                         71       60                                                      66
                                                                                                             59                                                            58
                                                              40                         55                                                                   50
                                                                                                                                  40
                                                                      40 45         39              36                                  36 37            39           37
      Strongly agree            Strongly disagree             20                                                    29            20                                                 27
      Somewhat agree            Somewhat disagree              0                                                                   0
       Unsure/ Refuse                                               < $2,500       $2,501 –         $5,001 -       > $7,501            No formal/     Lower/   Diploma &             Deg. &
                                                                                    $5,000          $7,500                              Primary      Secondary equivalent            above

      Q: In light of the election results, do you think the political opposition is strong enough?
Diverse views of electoral reform,
                                                                                                                                     but majority want changes.

Perpectives on Electoral Reforms
  60%
                 55%                                                                                                                     First
                                                                                                                                         Second
  50%                                                                                                                                    Total
                                           44%

  40%

                                                                      32%
                      30%                                                                        29%
  30%                                                                                                                      27%
            25%                       26%
                                                                                                     21%
                                                                 19%                                                           18%
  20%                                            18%
                                                                           13%                                                            12%
                                                                                            8%                        9%
  10%

  0%
            New citizens only          An independent           No need for any       Removal restrictions on Measures to increase        Unsure/Refuse
        eligible to vote after five electoral commission.        modifications.              media            voting secrecy during
          years as a citizen or                                                                                       polling
         after national service

    Q: Which one the following do you think would be most important to ensure that elections in Singapore are more free and fair?
    Please give Top 2 reasons
Respondent Profile
  Ethnicity                     Gender
                                                                   Occupation
                                                                Senior/Managers/Professional                              23%

                                                                              Associate
      Malay    Chinese Indian & Others      Male      Female             professional/Clerical
                                                                                                                  15%

              13% 13%                                              Service/Operators/Related
                                                                                                                   17%
                                                                            worker

                                                                          Business/Self-emp            7%
                                          49%             51%
                                                                                 Homemaker                        15%
                  74%
                                                                                        Other                            21%

  Born in Singapore             Age Group                         Monthly Household Income ($)
               Yes      No                                              < $2,500 per
                                  21-29         17%                                                18%
                                                                           month
              13%                                                    $2,501 – $5,000
                                  30-39                  23%                                                24%
                                                                        per month
                                                                     $5,001 - $7,500
                                  40-49               22%                                        15%
                                                                       per month
                                                                        > $7,501 per
                                  50-59            19%                                                  23%
                      88%                                                  month

                                   > 60            20%                        DK/NR                20%
Conclusions
              Findings of Welsh GE2015 Survey echo many of the
              findings of the Institute of Policy Studies post-election
              survey and pre-election Blackbox Quad Research,
              especially with regard to the importance of party
              leadership, candidates and the party in voting decision-
              making and with regards to the timing of decisions on
              voting.
              The Welsh poll does deepen understanding of public
              views surrounding the election.
              While Singaporeans want a stronger opposition, they
              are divided on the opposition’s performance in
              parliament and perceive weak opposition grassroots.
              The role of government at the national and local level
              was important in shaping voting behavior through the
              perception of social welfare benefits and the role of
              government-linked local institutions.
              Singaporeans are looking for reforms in the electoral
              process and a stronger opposition, suggesting that the
              political situation remains fluid in Singapore.
For Further Reading
For more detail on the analysis of the poll,
please see the following academic
publications:
Bridget Welsh, “Political Identities,
Engagement and Voting in Singapore’s 2015
Election,” in Terence Lee and Kevin YL Tan,
Change in Voting: Singapore’s 2015 General
Election. (Singapore, Ethos), pp. 191-219.
Bridget Welsh, “Clientelism and Control: PAP’s
Fight for Safety in GE2015,” The Round Table,
2016, April, Forthcoming.
Future work will analyze the role of religious
differences in voting.
You can also read