What Does It Mean To Draft Perfectly? An Evaluation Of Draft Strategy In The National Hockey League
←
→
Page content transcription
If your browser does not render page correctly, please read the page content below
University of Pennsylvania
                                                                                                   ScholarlyCommons
Joseph Wharton Research Scholars                                                                                Wharton School

2017

What Does It Mean To Draft Perfectly? An
Evaluation Of Draft Strategy In The National
Hockey League
Namita Nandakumar
University of Pennsylvania

Follow this and additional works at: http://repository.upenn.edu/joseph_wharton_scholars
    Part of the Business Commons

Recommended Citation
Nandakumar, N. (2017). "What Does It Mean To Draft Perfectly? An Evaluation Of Draft Strategy In The National Hockey League,"
Joseph Wharton Research Scholars. Available at http://repository.upenn.edu/joseph_wharton_scholars/26

This paper is posted at ScholarlyCommons. http://repository.upenn.edu/joseph_wharton_scholars/26
For more information, please contact repository@pobox.upenn.edu.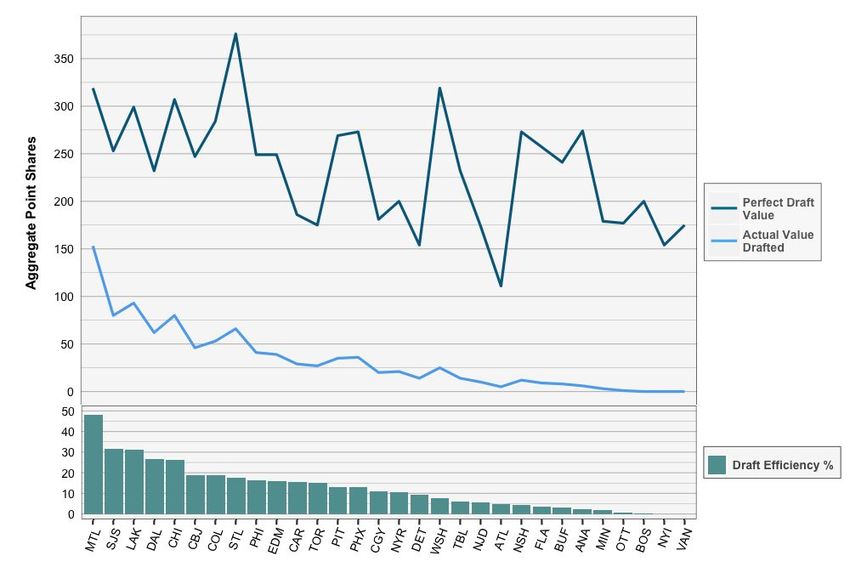
What Does It Mean To Draft Perfectly? An Evaluation Of Draft Strategy
In The National Hockey League
Abstract
We define what it means for an National Hockey League (NHL) team to have been successful in drafting, and
use this retrospective framework to determine if any teams exhibited a sustained edge in drafting from 2000 to
2009. At a high level, we compare actual draft outcomes to teams’ perfect draft outcomes. The perfect draft can
be thought of as what would happen if a general manager (GM) could redo a draft with complete knowledge
of prospects’ career values as well as other teams’ choices. A prospect’s career value is defined here as aggregate
Point Shares (from hockey-reference.com ) through the 2015-16 NHL season, though any valuation metric
can be used. When drafting perfectly, a GM picks the best player available as is commonly prescribed, but they
start with their last pick and work backwards. This subtle but important distinction alludes to the game
theoretic considerations of the draft. Simply put, the best time to pick a good prospect is just before any
opponents do. Every year, each team has a different perfect draft value, which is the aggregate career value of
their optimal picks. Having more and better picks means more potential value available and a higher perfect
draft value. By calculating the percentage of their perfect draft value that a team actually extracts, we now have
a simple draft efficiency metric that shows how teams are drafting relative to their best case scenario. This
allows us to rank and compare teams equitably by eliminating some of the advantages of having high-value
picks.

Keywords
National Hockey League, amateur draft, game theory

Disciplines
Business

           This thesis or dissertation is available at ScholarlyCommons: http://repository.upenn.edu/joseph_wharton_scholars/26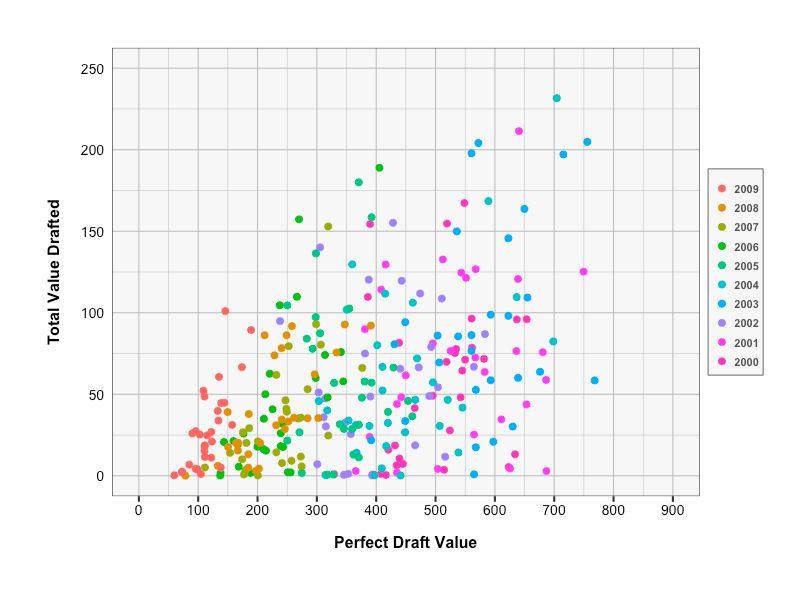
WHAT DOES IT MEAN TO DRAFT PERFECTLY?

AN EVALUATION OF DRAFT STRATEGY IN THE NATIONAL HOCKEY LEAGUE

                                          By

                                 Namita Nandakumar

  An Undergraduate Thesis submitted in partial fulfillment of the requirements for the

                         JOSEPH WHARTON SCHOLARS

                                   Faculty Advisor:

                                     Shane Jensen

                            Associate Professor, Statistics

         THE WHARTON SCHOOL, UNIVERSITY OF PENNSYLVANIA

                                      MAY 2017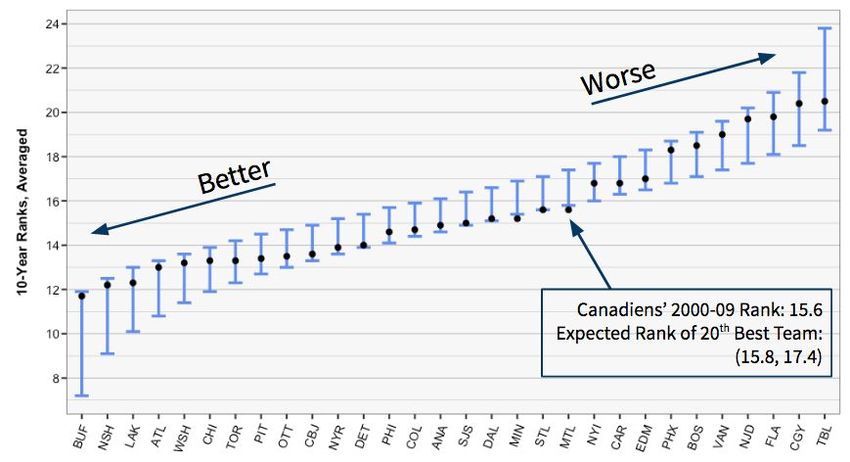
Abstract
We define what it means for an National Hockey League (NHL) team to have been successful in
drafting, and use this retrospective framework to determine if any teams exhibited a sustained edge in
drafting from 2000 to 2009. At a high level, we compare actual draft outcomes to teams’ perfect draft
outcomes. The perfect draft can be thought of as what would happen if a general manager (GM) could
redo a draft with complete knowledge of prospects’ career values as well as other teams’ choices. A
prospect’s career value is defined here as aggregate Point Shares (from hockey-reference.com) through
the 2015-16 NHL season, though any valuation metric can be used.
When drafting perfectly, a GM picks the best player available as is commonly prescribed, but
they start with their last pick and work backwards. This subtle but important distinction alludes to the
game theoretic considerations of the draft. Simply put, the best time to pick a good prospect is just
before any opponents do.
Every year, each team has a different perfect draft value, which is the aggregate career value of
their optimal picks. Having more and better picks means more potential value available and a higher
perfect draft value. By calculating the percentage of their perfect draft value that a team actually
extracts, we now have a simple draft efficiency metric that shows how teams are drafting relative to their
best case scenario. This allows us to rank and compare teams equitably by eliminating some of the
advantages of having high-value picks.
Keywords: National Hockey League, amateur draft, game theory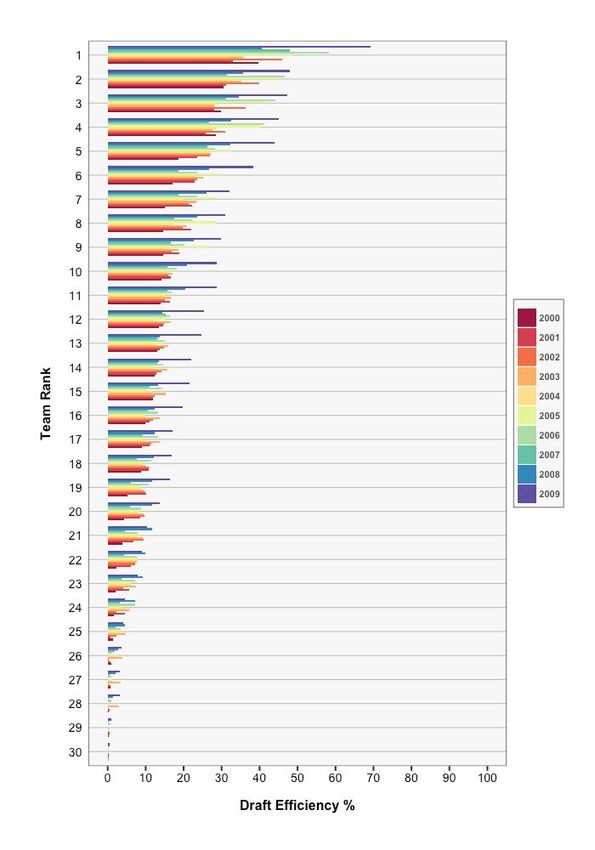
Introduction
The National Hockey League is comprised of 30 professional ice hockey teams in the United
States and Canada. Every year, the league holds an amateur entry draft, with all players eligible to be
selected once they are 18 years old. Teams are given the sole rights to their drafted players for two
years, during which time they may sign to them to an entry-level contract. There are seven rounds in the
NHL draft, and each team is initially allocated one pick per round. The first half of the first round has
the most valuable picks, which are distributed by a lottery system to teams that fail to make the playoffs
(“Draft Rules,” 2013). The draft is generally constructed in a such a way that bad teams should be able
to use it to acquire top-tier talent and improve league parity. Players who go undrafted may still sign
contracts with NHL teams, but roughly 90% of today’s NHL is made up of drafted players.
Additionally, draft picks are a common currency in player trades.
One of the most intriguing recent NHL Draft stories is the case of 2011 draft-eligible Johnny
Gaudreau. In April 2011, he was a 5’6" South Jersey native putting up excellent scoring numbers in the
United States Hockey League. However, concerns about his size meant that he was ranked 193rd among
draft-eligible North American skaters by the NHL Central Scouting Service. Since there are roughly 210
draft picks per year, he was far from a certainty in terms of being drafted by any team.
Gaudreau was eventually taken with the 104th overall pick by the Calgary Flames, well past the
point in the draft where most prospects are expected to become NHL players. This decision would seem
to indicate a lack of confidence on the part of the Calgary Flames, but this is far from the truth. A piece
in the Calgary Herald, written before the start of his NHL career, details the scouting espionage that
went into drafting Gaudreau (Cruickshank, 2014). In order to disguise their interest in Gaudreau,
Calgary never approached him before the draft, for fear of other teams valuing him higher. Furthermore,
this quote from John Weisbrod, then a scout for the Boston Bruins, is particularly interesting:Calgary beat us to the punch. There were people banging their hands on the table, like, ‘Oh, we
should have taken him a round earlier.’ It’s a calculated risk. The Flames got Gaudreau in a
really good spot.
If the Bruins should have taken him a round earlier, why didn’t they? The Bruins attempted to
leverage the fact that Gaudreau was a seemingly unknown entity to postpone selecting him. They may
have rated him very highly, but they weren’t convinced that anyone else had, leading to their decision to
wait. They were using game theory, and analysts should model the draft process in a way that reflects
these considerations.
Background
NHL teams spend millions of dollars every year on scouting departments with the sole purpose
of identifying valuable prospects to draft and sign to entry-level contracts. Though they never publicly
admit to doing so, teams have “tanked” entire seasons by trading away good players for draft picks and
icing a team of inexperienced minor leaguers. The purpose of this strategy is to lose more games and
position themselves to receive higher draft picks by lottery. A recent example is the 2015-16 Toronto
Maple Leafs, who maximized their probability of selecting top-ranked Auston Matthews in the 2016
NHL Draft by finishing last in the NHL. The draft lottery did end up working out in their favor, and the
Leafs got their man, who propelled the team to the playoffs in the 2016-17 NHL season. While tanking
is a rather extreme route, every team knows how critical the draft is to building a strong team.
Furthermore, general manager positions can be gained and lost over perceived proficiency in drafting,
which is what makes retrospective draft evaluation a particularly relevant issue.
The importance of drafting talent versus acquiring it through free agency cannot be overstated.The NHL has a hard salary cap of $73,000,000, and the best players can command contracts of upwards
of $10,000,000 per year. In order to fill out a roster of 23 or so players, it is necessary to find value
elsewhere, particularly with younger players. Entry-level contracts cover the first three seasons of every
player’s career at a maximum average annual value of $925,000 in addition to four years of restricted
free agency (“Frequently Asked Questions,” 2016). This means that young star players like Connor
McDavid, Shayne Gostisbehere, and Artemi Panarin, the 2016 Calder Trophy finalists, are currently
performing at a level well above their pay grade for the teams that drafted them.
Moreover, the probability that any one of them is traded to or signed by another team during the
prime of their career is slim. Out of the top 20 points scorers in the 2015-16 NHL season, only four
players represented teams that did not offer them their first contract. If a team cannot draft elite talent, it
is highly improbable that they will be able to acquire enough of it through trades and free agent signings.
In summary, unless the salary cap is abolished and entry-level contracts become shorter and
more expensive, drafting will remain an important part of constructing a competitive NHL team for the
foreseeable future. Moreover, in order to optimize drafting in the future, teams must have a sense of
what constituted favorable outcomes in the past.
Previous Work
Amateur drafts in many professional leagues have received scholarly attention as a way to apply
statistical and analytical methods to a sports problem. The people behind Moneyball were some of the
first to posit that certain features were not being priced into the market correctly, for example the value
of drafting a more experienced college player versus a high school phenom in baseball (Caporale &
Collier, 2013). Since then, researchers across all major sports have analyzed the relative value of draft
picks, the success of specific teams in drafting talent, and more.One of the most popular topics in draft research is defining the relative value of picks. How
much less is a second overall pick worth than a first, and does this relationship hold through each round?
This type of research is particularly enticing because the data is readily available, and it has implications
for how teams construct trades around draft picks. In fact, NFL teams use a well-known chart to
evaluate potential trades, supposedly developed by the Dallas Cowboys and MIT professors in the early
1990s. The chart shows a roughly exponential decay in pick value. In order to test its accuracy, Hurley,
Pavlov and Andrews (2012) go on to construct a Negative Binomial Distribution model with three
classes of players, and they find that the probability of someone belonging to the class with the most
NFL games played decreases as the player is drafted later. However, their new construction of “The
Chart” of pick valuation substantially differs from the original one, suggesting that conventional wisdom
cannot capture the actual magnitude and shape of that decline in value.
In terms of hockey-specific analysis, Schuckers (2011) and Tulsky (2013) construct draft pick
value charts with similarly decaying trends. Tingling, Masri and Martell (2011) show that, beyond the
first three rounds of the NHL draft, there is no significant difference in drafted players’ success rates.
They define success as the percentage of drafted players who play 160 or more games, and most
researchers use similar games played criteria as response variables. In fact, the most obvious extension
of present-day draft research is constructing additional response variables that measure the quality of a
player’s contribution to his professional league rather than the quantity. This is what informs our
decision to use Hockey Reference’s Point Shares as our player valuation metric. Furthermore, the
relative value of draft picks is a component of this analysis, but we see that it varies based on the player
quality available at different points in a specific draft.
Most previous analyses of drafting have a league-wide scope, which is why the game theoretic
implications have not been studied in great detail. For example, Schuckers and Argeris (2015) show that
teams collectively outperform NHL Central Scouting rankings when it comes to ordering draft prospectsfrom best to worst NHL outcomes. However, they probably do not outperform each other when
observed over many years. Draft decisions are evaluated based on whether one of the best players
available was selected with each of a team’s picks. In contrast to this approach, we aim to reward teams
for taking excellent players as late as possible. This is often intentional, as was the case with Calgary’s
decision to draft Johnny Gaudreau in the fourth round of the 2011 NHL Draft.
Finally, Sprigings (2016) creates a draft probability model for several highly rated players in the
2016 NHL Draft to inform teams’ decisions to trade picks in the hopes of acquiring a specific prospect.
It is necessary to forecast these probabilities in order to use a game theoretic drafting approach rather
than simply selecting the best player available at each pick. Simply put, teams will want to know how
long they can afford to wait to select someone, as this becomes a critical consideration along with the
projected value of the prospect in question.
Methodology
All draft position and player value data was scraped from hockey-reference.com. The player
value metric used is Career Point Shares (aggregated through the 2015-16 NHL season), which are an
estimate of the expected number of points in the team standings that are contributed by each player
(Kubatko, 2011). Point Shares was chosen for its interpretability as well as being mostly non-negative.
When we aggregate and compare these values, we should not penalize teams for picking a subpar NHL
player rather than not picking one at all. For this reason, all negative outcomes were set to 0.
Since teams have shown that they approach the draft with game theory in mind, we should
construct a notion of drafting that reflects these strategies. We can start by applying the method of
backward induction, well-established in the field of game theory ever since the publication of von
Neumann and Morgenstern’s Theory of Games and Economic Behavior in 1944. Backward inductioninvolves calculating optimal payouts from the last to first decision in order to determine a complete,
rational set of decisions for any actor.
In the case of drafting, the last decision that a team will make is their last available pick. We can
recommend selecting the best player left on the draft board at that point, and then iterate this strategy
backwards until their first pick. This ensures that a player is never selected before absolutely necessary,
and a team can optimize the total value of the selected players. In the case of Johnny Gaudreau, NHL
teams would have certainly been willing to use their first round picks on him after knowing the outcome
of his NHL career. However, all they needed to do was select him right before Calgary did at 104th
overall.
A historical case can illustrate this point most effectively. Suppose we build a time machine in
order to fix one specific team’s draft decisions. If we go back to the 2007 NHL Draft and act on behalf
of the Philadelphia Flyers, we have the benefit of perfect information, while every other team would act
just as they did previously.
We would redo the Flyers’ second overall pick, originally used on James van Riemsdyk. One
might initially consider the strategy of best player available. According to Career Point Shares (CPS),
Jamie Benn was the best player left on the draft board at that point, even though he was selected much
later by the Dallas Stars with the 129th overall pick. However, using backward best player available, we
realize that we only have to spend the 122nd overall pick on Jamie Benn. As any value pick chart shows,
this pick is worth considerably less than the second overall pick, and so we maximize return on
investment. Then, we can use the second overall pick on someone like Max Pacioretty. Pacioretty,
according to Career Point Shares, is not quite as valuable as Jamie Benn. However, he was picked 22nd
overall by the Montreal Canadiens, and so he would not have been available later on in the draft. Table 1
shows a comparison between the Flyers’ actual draft selections, recommended selections based on best
player available, and the optimal selections when working backwards.1
Table 1: Optimizing the Philadelphia Flyers’ 2007 Draft Selections
Pick Actual Selections CPS Best Player Available, CPS Backward Best Player Available, CPS
Perfect Information Perfect Information
2 James van Riemsdyk 31.6 Jamie Benn 55.8 Max Pacioretty 46.2
41 Kevin Marshall 0.0 P.K. Subban 52.8 P.K. Subban 52.8
66 Garrett Klotz 0.0 Alec Martinez 27.7 Alec Martinez 27.7
122 Mario Kempe 0.0 Jake Muzzin 24.6 Jamie Benn 55.8
152 Jon Kalinski 0.2 Carl Gunnarsson 23.9 Carl Hagelin 21.1
161 Patrick Maroon 9.3 Carl Hagelin 21.1 Carl Gunnarsson 23.9
182 Brad Phillips 0.0 Justin Braun 21.1 Justin Braun 21.1
Totals Actual Value Drafted 41.1 227 Perfect Draft Value 248.6
We see that backward best player available outperforms best player available, and both
outperform the Flyers’ actual draft selections by a wide margin. Additionally, the difference between
working forwards and backwards is not particularly large, but it certainly exists. Here, a difference of 20
Career Point Shares implies one expected additional win per season from 2007 till present. In general, if
a draft is less predictable and there is value to be had in all rounds, the difference between selecting the
best player available working forwards and backwards increases. If the draft is perfectly ordered, both
methods yield the same value, which would also be equivalent to the actual result.
We can calculate this aggregate value of optimal picks, or perfect draft value, for any team in
any year. Then, we can construct a draft efficiency score by dividing their actual value drafted by their
perfect draft value. For the Flyers in 2007, this score is 41.1 total Point Shares divided by 248.6 possible
Point Shares, or about 16.5%. This is a simple yet effective measure of how much value any team ended
up drafting relative to their own best case scenario. draft efficiency helps to diminish some of the
1
Note that because Gunnarsson and Hagelin were both selected after the 161st overall pick, it does not matter
whether they are picked 152nd or 161st overall in this redraft.advantages inherent to having many high-value picks in a certain draft, because the benchmark of
opportunity for those teams becomes higher.
This approach does raise some questions of feasibility. Taking the time machine scenario too
seriously will lead to some impossible hypothetical scenarios. What if picking Jamie Benn before Dallas
in 2007 causes Dallas to take Carl Hagelin, one of the next players prescribed by the perfect draft? After
all, it would be incredibly difficult to take the “butterfly effect” into account. Furthermore, what if
taking Benn before Dallas causes him to stall in his progress? Assuming player outcomes are fixed
ignores their inherent uncertainty as well as the impact of NHL coaching and development programs.
Some very high-risk, high-reward prospects are drafted in later rounds, and we cannot say that they
would pan out or bust 100% of the time.
We should consider an alternative understanding of the perfect draft that best captures its
evaluative purpose. The perfect draft shows the value that all other teams were able to select and
develop at various points in each draft. It shows what could’ve happened if a GM did everything right,
and probably also got a bit lucky. It will never be a perfect metric until we simulate multiple trials of
reality, but it certainly helps to tease out the inherent biases of fans and analysts when they evaluate
drafting more qualitatively. Moreover, this approach can be used with any valuation metric in any
league with a draft. As long as a single value can be assigned to each prospect, this algorithm can define
a set of optimal draft picks.
Team Performance Results
Figure 1 shows draft efficiency results for the 2007 NHL Draft. Teams are ordered by their draft
efficiency score from best to worst. Montreal does much better than any other team by extracting
roughly 50% of the value that was available to them. At the other end of the spectrum, the Islanders andthe Canucks drafted no successful NHLers. It is notable that the Canadiens had three more picks than
the Canucks and four more picks than the Islanders, and Montreal’s picks were on average about one
round better than those of both teams. The Canadiens clearly had more and better opportunities to
extract value from the draft, and they were able to take advantage of them. Meanwhile, the Canucks and
Islanders basically set themselves up for a high probability of failure.
We find that perfect draft value correlates positively and linearly with actual value drafted (r =
0.45) throughout the 2000-09 drafts. See Appendix B, Figure 4 for details. Still, there is clear variation.
Montreal is ranked first in draft efficiency for 2007 while Washington is 18th, despite having equivalent
perfect draft values. In fact, Washington is penalized for not taking advantage of their good picks, and
they are ranked below teams whose selections weren’t as valuable in an absolute sense.
Figure 1: 2007 Draft Efficiency ResultsIt’s important to note that every draft is different and has a unique distribution of draft efficiency
scores, as shown in Appendix B, Figure 5. In some years, one team does particularly well, and so
everyone else suffers in comparison. Other years, especially the early 2000s, exhibit more parity in
drafting. For this reason, we compare team ranks instead of raw draft efficiency percentages for the
entire decade. Every year is different, but in every year teams still want to outperform their opponents.
If we evaluate the results over 2000-09, no team does significantly better or worse when
regressing team on draft efficiency rank. Full draft efficiency ranking results by year can be found in
Appendix B, Table 2. To further understand if there are trends in the ranks, we can repeatedly simulate
ranks over 10 years to construct 95% confidence intervals for our expectations of the best team, the
second best team, and so forth, in a world where every team is equally proficient at drafting. Figure 2
displays the averaged actual ranks, which are basically in line with what would be expected from
randomly generated results, with a couple of exceptions. The top 20 teams display obvious regression to
the mean. The best teams perform systematically worse than we might expect, and the middle of the
pack teams perform systematically better than we might expect. The Canadiens are singled out in Figure
2, with an average rank of 15.6 that slightly outperforms the 95% confidence interval for the 20th best
team, (15.8, 17.4). This pattern suggests that, for most of the league, there’s a very small gap in terms of
average drafting performance, even smaller than what we might expect in a world where all differences
in outcomes are due to random variation.
In addition, there is some separation between the top 20 and bottom 10, and the worst third of the
league experienced results in line with random chance. While placing in the bottom third of the league
could be due to bad luck, there is some evidence that these teams were making subpar draft decisions.
Calgary’s decision to draft Johnny Gaudreau in 2011 was a departure from their draft strategy in the
2000s, when they were fond of drafting larger, less skilled players (Cruickshank, 2014). Mostly due to
drafting the small, skilled Gaudreau, they rank third in 2011 draft efficiency, a better result than theywere able to achieve at any point within the previous decade.
Figure 2: Expectations for Draft Efficiency Ranks
What Does It Mean to Be “Good at Drafting?”
It’s difficult to discuss drafting success in the 2000s without mentioning the Chicago
Blackhawks. With notable drafted talents such as Patrick Kane, Jonathan Toews, Brent Seabrook, Corey
Crawford, Duncan Keith, and more, they tend to fall at or near the top of any lists of the best drafting
teams in hockey. According to averaged draft efficiency rank, they are sixth in the NHL over this time
period, which already seems a bit low given their tremendous on-ice success in recent years.
However, during the 2000-09 drafts, they had at least 9 more picks than any other team,
including the first overall pick in 2007, third overall in 2006 and 2004, and so forth. For every Jonathan
Toews the Blackhawks drafted, they made a selection like Kyle Beach, who failed to make an impact at
the NHL level. If we rank teams simply based on the total Point Shares they drafted in each year, theChicago Blackhawks are actually second in the 2000s, just losing out to the top-ranked Los Angeles
Kings. However, using draft efficiency penalizes their drafting performance the most out of all teams
because their perfect draft values are particularly high.
One of the other ways to eliminate the advantage of having high-value picks is to ignore the ones
that are allocated via lottery. Schuckers (2011) and Tulsky (2013) find that these are the most valuable
picks by a large margin. The first overall pick, for example, is generally unattainable for playoff-bound
teams. If we eliminate the first half of the first round, then, in the interest of fair comparison, we should
exclude the entire first round. Doing so yields similar ranks for some teams and dramatically different
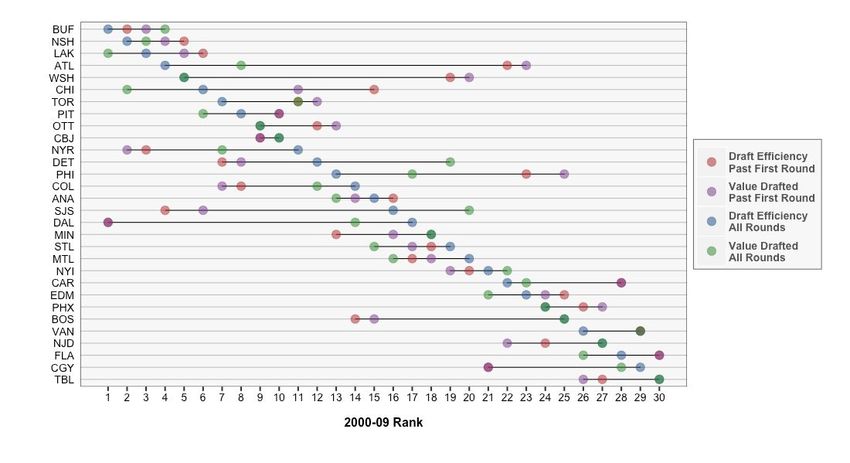
ones for others. Figure 3 displays some of the disparities in ranks among four possible systems. Teams
have a total value rank and an efficiency rank for the entire draft as well as for the second round and
beyond. The ranking systems are ordered in the legend from most to least penalization of pick value. For
a complete listing of ranks in each system, see Appendix B, Table 3.
Figure 3: Team Performance Under All Ranking SystemsNow, we get to the heart of the issue of why teams like the Blackhawks as well as teams like the
Detroit Red Wings are considered good at drafting. The Blackhawks drafted a lot of high-value players,
but they also had a lot of misses, and so they are penalized with all efficiency-based measures. They go
from second in the league to 15th as we take away their relative advantages. Meanwhile, the Red Wings
were fairly mediocre in terms of value drafted, but they did an excellent job of efficiently extracting
value from their not-so-great picks. They have the opposite trajectory in rankings, going from 20th to
fourth in the NHL as other teams’ pick advantages are removed.
This analysis lends credibility to the idea that teams should set themselves up to succeed by
accumulating many high-value draft picks. Then, even if they’re roughly average at finding value in all
rounds of the draft, they still perform very well in absolute terms. No team will care about their draft
efficiency score as long as they are consistently drafting valuable players. Despite the Red Wings’
impressive ability to find value in late rounds, teams would probably rather model themselves after the
Blackhawks. In fact, having many chances to succeed in the draft is the main idea behind strategies like
“The Process” of the Philadelphia 76ers in the NBA (Hinkie, 2016).
Future Work
The first question to ask about any draft research is “can this help a team draft better?” This
project is mostly descriptive and retrospective in nature, but it can at least serve as a warning sign for
teams who are doing particularly poorly. Of course, they often know this already due to lack of on-ice
success, although having high picks for a few years can help to mask deficiencies. Still, we do not find a
statistically significant difference in team drafting abilities throughout the 2000s, and there is a healthy
amount of random variation in all parts of the process. Evaluating one general manager or draft analyst
based on these results may not present a fair assessment of their abilities.There are ways to incorporate these ideas more prospectively into future draft strategies. First, teams need to model outcomes for each draft prospect, which is presumably being done by each team to some degree. Second, a team will need to model the distribution of picks around which a prospect is expected to be selected. Dawson Sprigings’ NHL Draft Probability Tool (2016) shows how this distribution can estimated using pre-draft rankings from various sources, but the accuracy of these estimates will drop in later rounds. See Appendix A for a simple demonstration of how projecting other teams’ preferences can inform a draft ordering decision. In general, there will need to be a certain level of precision attainable by this approach before it becomes better than simply selecting the best player available.
References
Caporale, Tony, and Trevor C. Collier. ”Scouts versus Stats: The Impact of Moneyball on the Major
League Baseball Draft.” Applied Economics 45, no. 15 (2013): 1983-990.
Cruickshank, Scott. “Scouts’ subterfuge played big role in Flames snaring Johnny Gaudreau at 2011
NHL draft.” Calgary Herald (September 15, 2014).
http://www.calgaryherald.com/sports/Scouts+subterfuge+played+role+Flames+snaring+Johnny+
Gaudreau+2011+draft/10203624/story.html
“Draft Rules.” NHL.com (September 4, 2013). http://www.nhl.com/ice/page.htm?id=86689
“Frequently Asked Questions.” CapFriendly (December 10, 2016). https://www.capfriendly.com/faq
Hinkie, Samuel. Letter of Resignation (April 6, 2016).
http://www.espn.com/pdf/2016/0406/nba_hinkie_redact.pdf
Hurley, W. J., A. Pavlov and W. Andrews. ”A Valuation Model for NFL and NHL Draft Positions.”
Journal of the Operational Research Society 63, no. 7 (July 2012): 890-98.
Kubatko, Justin. “Calculating Point Shares.” Hockey Reference (March 12, 2011).
http://www.hockey-reference.com/about/point_shares.html
Schuckers, Michael. “What’s An NHL Draft Pick Worth? A Value Pick Chart for the National Hockey
League.” Statistical Sports Consulting (2011).
http://myslu.stlawu.edu/~msch/sports/Schuckers_NHL_Draft.pdfSchuckers, Michael and Steve Argeris. “You can beat the “market”: Estimating the
return on investment for NHL team scouting.” Journal of Sports Analytics 1 (2015): 111-19.
http://content.iospress.com/download/journal-of-sports-analytics/jsa0015?id=journal-of-sp
orts-analytics%2Fjsa0015
Sprigings, Dawson. “NHL Draft Probability Tool.” Hockey Graphs (June 8, 2016).
https://hockey-graphs.com/2016/06/08/nhl-draft-probability-tool/
Tingling, Peter, Kamal Masri and Matthew Martell. “Does Order Matter? An Empirical Analysis of
NHL Draft Decisions.” Sport, Business and Management 1, no. 2 (2011): 155-71.
Tulsky, Eric. “NHL draft: What does it cost to trade up?” Broad Street Hockey (April 25, 2013).
http://www.broadstreethockey.com/2013/4/25/4262594/nhl-draft-pick-value-trading-up.
von Neumann, John, and Oskar Morgenstern. Theory of Games and Economic Behavior. Princeton
University Press (1944).Appendix A
Suppose there is a two-round draft with all 30 NHL teams. The Toronto Maple Leafs have the
first and 31st picks. You are a Leafs scout and have identified two players whom you believe will have
impressive NHL impacts based on internal team projections. All other players have a value of 20. You
also know the likelihood that each player will be drafted before the 31st pick if you do not take them
first. Given the large number of players available to be drafted, it is reasonable to assume independence.
Player Projected NHL Value Hypothetical Scouts’ Rank P(Taken Before 31st Pick)
X 90 20 0.5
Y 60 1 0.99
If you select X and then select the best player available, your expected total NHL value is 110.4:
Available at 31st Pick Probability Total NHL Value
Y 0.01 90 + 60
Other 0.99 90 + 20
If you select Y and then select the best player available, your expected total NHL value is 115:
Available at 31st Pick Probability Total NHL Value
X 0.5 60 + 90
Other 0.5 60 + 20
In this case, the behaviors of other teams motivate ordering your picks less intuitively in order to
maximize expected value. Of course, there are different risks attached to using this methodology versus
using the strategy of “best player available.” It’s worth noting that this will essentially converge to “best
player available” if you agree with the market’s assessments of prospects. Furthermore, this example
seems extreme, as scouts are not completely inept at evaluating top-end talent. Still, some teams
continue to be fond of picking their favorite prospects without regard for underlying market preferences.Appendix B
Table 2: NHL Team Draft Efficiency Ranks, 2000-09
Team 2000 2001 2002 2003 2004 2005 2006 2007 2008 2009 Average
Sabres 21 2 6 3 7 22 12 24 10 10 11.7
Predators 11 12 20 5 6 9 26 22 5 6 12.2
Kings 3 9 23 19 27 4 13 3 6 16 12.3
Thrashers 7 8 5 10 30 12 10 21 15 12 13
Capitals 22 18 13 24 2 26 2 18 2 5 13.2
Blackhawks 26 10 3 1 14 23 6 5 27 18 13.3
Maple Leafs 12 16 4 26 28 3 3 12 12 17 13.3
Penguins 16 24 14 6 4 1 5 13 29 22 13.4
Senators 6 1 29 16 18 24 7 27 3 4 13.5
Blue Jackets 17 21 7 18 26 13 4 6 13 11 13.6
Rangers 1 7 22 28 8 15 19 16 4 19 13.9
Red Wings 10 26 1 8 11 14 21 17 17 15 14
Flyers 4 6 11 7 29 19 11 9 23 27 14.6
Avalanche 14 17 8 23 21 11 17 7 28 1 14.7
Ducks 5 15 15 2 25 10 24 25 20 8 14.9
Sharks 28 3 27 4 20 5 20 2 11 30 15
Stars 13 4 18 20 23 7 25 4 25 13 15.2
Wild 2 13 12 13 22 21 22 26 19 2 15.2
Blues 24 22 26 14 12 8 8 8 9 25 15.6
Canadiens 18 11 21 11 5 2 28 1 30 29 15.6
Islanders 9 30 9 27 16 28 9 29 8 3 16.8
Hurricanes 20 28 2 15 9 17 16 11 26 24 16.8
Oilers 19 14 16 25 15 20 18 10 7 26 17
Coyotes 25 25 25 30 10 6 23 14 16 9 18.3
Bruins 23 19 24 12 3 25 1 28 22 28 18.5
Canucks 29 5 28 21 1 16 15 30 24 21 19
Devils 8 29 30 9 13 18 29 20 21 20 19.7
Panthers 30 20 10 22 17 30 14 23 18 14 19.8
Flames 15 23 19 17 24 27 27 15 14 23 20.4
Lightning 27 27 17 29 19 29 30 19 1 7 20.5Table 3: 2000-09 NHL Team Rank by System, Most to Least Penalization of Pick Value
Team Draft Efficiency, Value Drafted, Draft Efficiency, Value Drafted, Total Effect of Efficiency,
Past First Round Past First Round All Rounds All Rounds First Round Exclusion
Capitals 19 20 5 5 -14
Thrashers 22 23 4 8 -14
Blackhawks 15 11 6 2 -13
Flyers 23 25 13 17 -6
Kings 6 5 3 1 -5
Hurricanes 28 28 22 23 -5
Penguins 10 10 8 6 -4
Oilers 25 24 23 21 -4
Panthers 30 30 28 26 -4
Senators 12 13 9 9 -3
Ducks 16 14 15 13 -3
Blues 18 17 19 15 -3
Predators 5 4 2 3 -2
Coyotes 26 27 24 24 -2
Canadiens 17 18 20 16 -1
Maple Leafs 11 12 7 11 0
Canucks 29 29 26 29 0
Blue Jackets 9 9 10 10 1
Sabres 2 3 1 4 2
Islanders 20 19 21 22 2
Devils 24 22 27 27 3
Lightning 27 26 30 30 3
Rangers 3 2 11 7 4
Avalanche 8 7 14 12 4
Wild 13 16 18 18 5
Flames 21 21 29 28 7
Bruins 14 15 25 25 11
Red Wings 7 8 12 19 12
Stars 1 1 17 14 13
Sharks 4 6 16 20 16Figure 4: Actual Value Drafted vs. Perfect Draft Value, 2000-09
Earlier drafts fare better in terms of actual value drafted and perfect draft value because players
have accumulated more career value. Every additional Point Share of perfect draft value leads to an
average increase of 0.13 Point Shares of actual value drafted, and this effect is statistically significant
with p < 0.01. Still, there are many instances of teams with high perfect draft values completely failing
to draft NHL-caliber players.Figure 5: Draft Efficiency Percentage Distributions
You can also read