Winter Storm Elliott - PJM
←
→
Page content transcription
If your browser does not render page correctly, please read the page content below
Winter Storm Elliott

                       Mike Bryson, Sr. Vice President –          Brian Chmielewski, Manager –
                       System Operations                          Real-Time Market Operations
                       Donnie Bielak, Sr. Manager – Dispatch      Susan Kenney, Manager – Market
                                                                  Settlements Development
                       Stu Bresler, Sr. Vice President – Market
                       Services

www.pjm.com | Public                                                                       PJM©2023
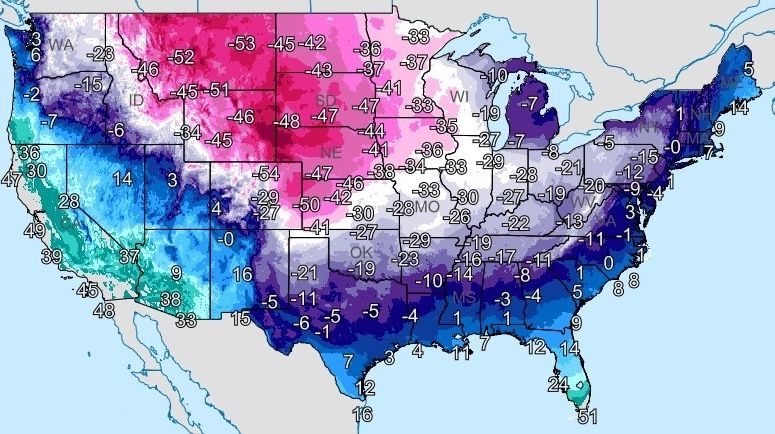
Winter Storm Elliott

                                                                                                                        Source: NOAA

                                                                                       Temperatures across the RTO plummeted
                                                                                       beginning on Dec. 23 and lasted into the
                                                                                       morning of Dec. 25 with record
                                                                                       lows in some areas as well as record
                                     The PJM Bulk Power System Operated Reliably
                                                                                       drops in some regions.
                                             Through Winter Storm Elliott
Source: NOAA and the National Weather Service; Graphic created on Dec. 21, 2022.

       www.pjm.com | Public                                                        2                                    PJM©2023
PJM Prepares Extensively for the Winter

   Winter readiness assessments: data collection on fuel inventory, supply and delivery
   characteristics, emissions limitations, and minimum operating temperatures

   Meetings with federal and state regulators and neighboring systems to review winter
   preparations; weekly operational review meetings with major natural gas pipeline
   operators

   PJM’s Cold Weather Preparation Guideline and Checklist for generation owners
   includes everything from increasing staffing for weather emergencies to performing
   required maintenance activities.

   April 2023 NERC winterization standard implementation is important. PJM
   feedback to NERC and FERC: New reliability standards need to be stronger
   and implemented sooner.

www.pjm.com | Public                         3                                       PJM©2023

Prior to Storm, PJM Issued Winter Advisory and Alerts
 Dec. 20, 2022
Cold Weather Advisory for Western Region From Dec. 23–26 (Later Expanded to Entire RTO)
• Prepare to take freeze-protection actions,        • Review weather             • Members are to update PJM with operation limitations associated
  such as erecting temporary windbreaks or            forecasts, determine any     with cold weather preparedness. Operating limitations include:
  shelters, positioning heaters, verifying heat       forecasted operational       generator capability and availability, fuel supply and inventory
  trace systems, or draining equipment prone          changes, and notify PJM      concerns, fuel switching capabilities, environmental constraints,
  to freezing.                                        of any changes.              generating unit minimums.

 Dec. 21, 2022
Cold Weather Alert Issued for the Western Region for Dec. 23
• Generation dispatchers review fuel       • Generation dispatchers monitor and report projected      • Generation dispatchers contact PJM Dispatch
  supply/delivery schedules in               fuel limitations to PJM dispatcher and update the unit     if it is anticipated that spot market gas is
  anticipation of greater-than-normal        Max Run field in Markets Gateway if less than 24 hours     unavailable, resulting in unavailability of bid-in
  operation of units.                        of run time remaining.                                     generation.

 Dec. 23, 2022
Second Cold Weather Alert Issued for the Entire RTO for Christmas Eve, Dec. 24

www.pjm.com | Public                                                     4                                                                   PJM©2023
PJM’s Dec. 23 Operating Plan Was Conservative

 PJM accounts for uncertainty and unplanned events as it develops the
 operating plan for every day.

 • Given the expected weather,     • Forecast          • PJM called over
   PJM was conservative in           load was            155,750 MW into the
   developing the operating          126,968 MW.         operating capacity
   plans for Dec. 23.                                    for the day.

Based on generator availability data submitted to PJM, we believed we had almost
29 GW of reserve capacity available to absorb load and generation contingencies
and to support our neighboring systems.
Preliminary Data

 www.pjm.com | Public                  5                                   PJM©2023

Most Drastic Temperature Drop in a Decade

                       Top Ten 12-Hour Temperature Drops Ending Under 15°

www.pjm.com | Public                            6                           PJM©2023
2022 Holiday Load
                                                     2022 holiday weekend load                               (Preliminary Data)
                                                        was extreme outlier in
     155,000                                                                                               Dec. 1–Jan. 15 Loads*
                                                        magnitude and timing.                            2022 & Previous 10 Years
     145,000
                                                                                                                                          2022
     135,000
                                                                                                                                          2021
     125,000                                                                                                                              2020

     115,000                                                                                                                              2019
MW

                                                                                                                                          2018
     105,000
                                                                                                                                          2017
      95,000                                                                                                                              2016
                                                                                                                                          2015
      85,000
                                                                                                                                          2014
      75,000
                                                                                                                                          2013
      65,000                                                                                                                              2012

      55,000
            12/1              12/6   12/11   12/16      12/21       12/26        12/31            1/5           1/10            1/15
                                                                       *Note: Load values include the estimated demand response (DR) added back.

       www.pjm.com | Public                                     7                                                                   PJM©2023
Load Stayed Unusually High Overnight
(Preliminary Data)
Christmas Eve valley
150,000 was 40,000 MW higher Dec. 23–25 Loads*
than second highest. 2022 & Previous 10 Years
140,000
2022
130,000
2021
120,000
2020
110,000 2019
100,000 2018
2017
90,000
2016
80,000
2015
70,000 2014
60,000 2013
2012
50,000
12/23 12/23 12/24 12/24 12/25 12/25 12/26
*Note: Load values include the estimated demand response (DR) added back.
www.pjm.com | Public 8 PJM©2023Actual Load Came in Higher Than Forecast
(Preliminary Data)
Dec. 23 Dec. 24
Load (MW) Temperature Load (MW) Temperature
160,000 35 ° 160,000 35 °
Actual Temp
150,000 Forecasted Temp Actual Load 30 ° 150,000 30 °
140,000
(with DR) Actual Load Actual Load
140,000
25 ° (without DR) (with DR) 25 °
130,000 Actual Load 130,000
(without DR) 20 ° 20 °
120,000 120,000
15 ° 15 °
110,000 Forecasted Load 110,000
10 ° Forecasted Load 10 °
100,000 100,000
5° Actual Temp 5°
90,000 90,000
Forecasted Temp
80,000 0° 80,000 0°
Dec. 23 Dec. 24 Dec. 24 Dec. 25
Actual load came
in over 10% over
• Severe cold and blizzard conditions • Early occurrence of cold weather
forecast. • Most drastic temperature drop in a decade • Holiday impacts: rare instance of under-forecasting
www.pjm.com | Public 9 PJM©2023As We Called Reserves, a Significant Portion of Fleet Failed To Perform
(Preliminary Data)
SATURDAY:
~46,000 MW
Over 92% of all outages were
reported to us with less than an hour’s
FRIDAY NIGHT:
~34,500 MW notice or with no notice at all.
Cause of Outage:
EARLIER FRIDAY: Emissions
~12,000 MW Ambient
Start/Failure &
Unit Trips
Fuel Supply
Plant Equipment
2 a.m. 10 a.m. 6 p.m. 2 a.m. 10 a.m. 6 p.m. 2 a.m. 10 a.m. 6 p.m.
Dec. 23 Dec. 24 Dec. 25
www.pjm.com | Public 10 PJM©2023Generator Performance
(Preliminary Data)
T O TA L F O R C E D O U TA G E S – G E N E R AT O R U C A P
2022/2023 DELIVERY YEAR
DEC. 24, 2022
Natural Gas, Other,*
Coal,
32,473 MW 54,883 MW Gas,
7,562 MW
86,058 MW
45,952 MW
(23.2% Total PJM
Capacity)
Coal,
Other,* 45,183 MW
5,917 MW
PJM’s Total Fleet Capacity – 186 GW
*Other = nuclear, oil, wind, solar, etc.
www.pjm.com | Public 11 PJM©2023Certain Generation Was Unable To Start at Stated Start Times
(Preliminary Data)
• In addition to forced outages, ~6,000 MW of steam generation was called
but was not on-line as expected per their time to start for the morning peak
on Dec. 24.
The vast majority of these resources were gas-fired resources.
• The high rates of generator outages also limited our ability to replenish
pond levels for pumped storage hydro prior to the morning peak on Dec. 24.
That left PJM with extremely limited run hours for pumped storage generation.
• Between forced outages, derates, generators that did not start on time,
and the inability to fill pumped storage hydro ponds, PJM was dealing with
~57 GW of generator unavailability for the Dec. 24 morning peak.
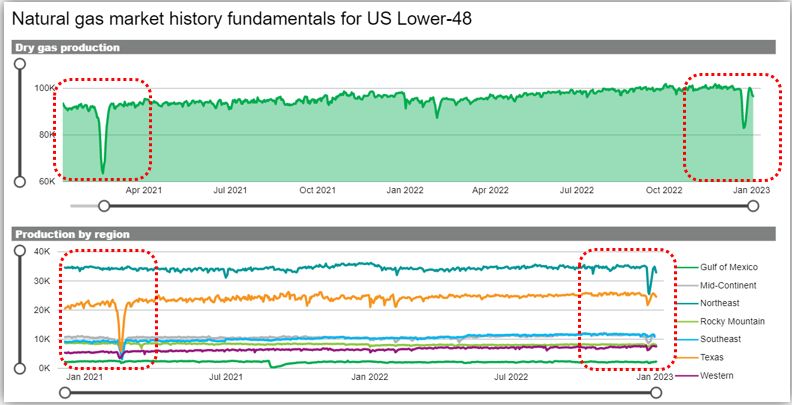
www.pjm.com | Public 12 PJM©2023Natural Gas Production Declines
Uri (February 2021) vs. Elliott (December 2022)
Jan. 1, 2021, through Jan. 2, 2023
Uri (February 2021)
• 30% nationwide production decline
• All production loss in Texas and Southwest
Uri Elliott
• No production loss in Appalachia
Elliott (December 2022)
• 20% nationwide production decline
• Largest percentage of total decline in
Appalachia (Marcellus and Utica), which
saw a nearly 30% drop in daily production
• Production has returned to near pre-event
Northeast: Marcellus and Utica Shale; Data Source: S&P Global
levels.
www.pjm.com | Public 13 PJM©2023Emergency Procedures • 12/24 04:25–22:00 – Max. Generation
PAI
Trigger
(Preliminary Data) Emergency Action
• 12/23 17:30–22:15 – Pre-Emergency Load Mgmt. Reduction Action – • 12/24 04:52–18:34 – Voltage Reduction Alert
• Cold Weather Alert issued RTO 30-minute response product issued for RTO
PAI
from 07:00 on 12/23 through • 12/23 17:30–23:00 – Maximum Generation Emergency Action, Issues EEA2 Trigger • 12/24 05:16–21:08 – Emergency Energy Request
23:00 on 12/25 for Western • 12/24 07:15–18:15 – Voltage Reduction Warning
• 12/23 17:45–21:30 – Emergency Load Mgmt. Reduction Action and a
Region. and Reduction of NCPL
NERC level EEA2
• Cold Weather Advisory • 17:45 – DOE issues Emergency Order under
• 12/23 18:00–22:15 – Pre-Emergency Load Mgmt. Reduction Action, 60-minute
extended to 07:00 on 12/23 Section 202 (c) of Federal Power Act
response product
through 23:00 on 12/26 for
Western Region. • 12/23 23:00 – Max. Generation Emergency Alert/Load Mgmt. Alert for 12/24 • 12/24 22:30 – PJM downgrades EEA2 to EEA1.
Dec. 20 Dec. 21 Dec. 23 Dec. 24 Dec. 25
Cold Weather • Cold Weather Alert • 12/24 00:04–00:30 – 100% Synchronized Reserve Event • 12/25 08:55 – Cold Weather
Advisory from 07:00 issued from 00:00 on initiated for the PJM RTO region. Alert issued from 07:00 on
on 12/23 through 12/24 through 23:59 on • 12/24 02:23–03:24 – 100% Synchronized Reserve Event 12/26 through 23:00 on
23:00 on 12/25 for 12/25 for the RTO. initiated for the PJM RTO region. 12/26 for Western Region
Western Region. • 12/23 10:14–10:25 – • 12/25 22:00 – EEA1 ends
• PJM Issues Call for Conservation effective 04:00 on
PJM expands Cold Synch. Reserve Event 12/24 through 10:00 on 12/25.
Weather Advisory to • 12/23 16:17–18:09 –
the entire RTO on • 12/24 04:20–20:30 – Emergency Load Mgmt. Reduction PAI
Synch. Reserve Event Action and a NERC level EEA2 issued – All load mgmt. Trigger
12/22.
• 12/24 04:23–05:51 – 100% Synchronized Reserve Event
initiated for the PJM RTO region.
www.pjm.com | Public 14 PJM©2023Interchange: Dec. 23–25
Net Scheduled Interchange – (not including dynamic transfers)
6,000 MWh
Dec. PJM total exports began
20 increasing and peaked 4,000 MWh Total Import
on Dec. 23 at 9 a.m. at 2,000 MWh
10,811 MWh. 0 MWh
PJM Net
-2,000 MWh
Dec. PJM began curtailing
23 exports as our capacity -4,000 MWh
position deteriorated -6,000 MWh
due to the generation -8,000 MWh
failures that we were Total Export
having. -10,000 MWh
-12,000 MWh
12/22 21:0012/23 9:0012/23 21:0012/24 9:0012/24 21:0012/25 9:0012/25 21:00
www.pjm.com | Public 15 PJM©2023PJM Media Outreach
Worked
Used Media, Press With Utility
Releases and Social Partners
Media Sites
www.pjm.com | Public 16 PJM©2023Analysis and Lessons Learned
Look at some immediate actions to be prepared for the
What’s next rest of this winter.
for PJM and
members? • Cold Weather • Data request from • Load forecast
Advisory steps affected resources approach
PJM is doing a NERC/FERC has announced a
full analysis nationwide investigation.
estimated mid-April. PJM has received requests for
information from Reliability First and SERC.
www.pjm.com | Public 17 PJM©2023System Energy Price Overview
System Energy Price
$4,000
Energy Component of LMP is capped at the energy offer
cap + 2 * Penalty Factor from first step of reserve
$3,500 Operating Reserve Demand Curve (ORDC).
$3,000
• $3,700 multiple intervals, including all of 17:00 Dec. 23 and most of
$2,500 04:00 Dec. 24
$2,000 • Total LMPs were above this level when factoring in locational
$1,500 congestion and loss prices for multiple intervals.
$1,000
$500 Penalty Factor ORDC
$0 sets a price for
12/23/2022
12/23/2022 6:00
12/23/2022 12:00
12/23/2022 18:00
12/24/2022
12/24/2022 6:00
12/24/2022 12:00
12/24/2022 18:00
12/25/2022
being unable to
meet the reserve
requirement.
www.pjm.com | Public 18 PJM©2023Impacts of Congestion
Hourly Min/Max Locational
Congestion Price
Dec. 23 $2,500 Max of Congestion Price – Real Time
Max of congestion_price_rt
Min of Congestion Price – Real Time
Min of congestion_price_rt
27 of 35 active constraints bound at $2,000
the transmission constraint penalty $1,500
factor for at least one 5-min. interval. $1,000
$500
Dec. 24
$0
28 of 42 active constraints bound at
12/23/2022
12/23/2022 3:00
12/23/2022 6:00
12/23/2022 9:00
12/23/2022 12:00
12/23/2022 15:00
12/23/2022 18:00
12/23/2022 21:00
12/24/2022
12/24/2022 3:00
12/24/2022 6:00
12/24/2022 9:00
12/24/2022 12:00
12/24/2022 15:00
12/24/2022 18:00
12/24/2022 21:00
12/25/2022
-$500
the transmission constraint penalty
factor for at least one 5-min. interval. -$1,000
-$1,500
Transmission Constraint Penalty Factors
-$2,000
These are parameters used by the Security Constrained
Economic Dispatch (SCED) applications to determine the -$2,500 Key Takeaway: Locational aspect of load to constraints
maximum cost of the re-dispatch incurred to control a ultimately impacts pricing. Zonal prices reached as high as
transmission constraint. Default is $2,000/MWh. -$3,000 ~$4,300 on Dec. 24.
www.pjm.com | Public 19 PJM©2023Reserve Market Clearing Prices
$/MWh $/MWh SRMCP (Daily Max vs. Average)
Monthly Average MCP
40 1,800
1,600
35
NSRMCP - RTO Key takeaway: Shortage
1,400
30 NSRMCP - MAD pricing through the inclusion High
1,200 of the applicable Primary Average
25 SecR - RTO Reserve and Synchronized
1,000
Reserve Penalty Factors in
20 SRMCP - RTO 800 the real-time LMP and
reserve pricing calculations
15 SRMCP - MAD 600 increased average pricing in
400 December.
10
200
5
0
10/1/2022
10/7/2022
10/13/2022
10/19/2022
10/25/2022
10/31/2022
11/6/2022
11/12/2022
11/18/2022
11/24/2022
11/30/2022
12/6/2022
12/12/2022
12/18/2022
12/24/2022
12/30/2022
0
Oct Nov Dec
2022
www.pjm.com | Public 20 PJM©2023Shortage Intervals – Friday, Dec. 23
71 Shortage Intervals approved by Dispatch All intervals reviewed and
between 16:30 and 22:45. validated during LMP
verification on Dec. 27.
Number of Intervals Reserve Penalty Factors
45 MAD & RTO – Primary
21 MAD & RTO – Primary & Synchronized
2 MAD & RTO – Primary & RTO – Synchronized
3 RTO Primary
www.pjm.com | Public 21 PJM©2023Shortage Intervals – Saturday, Dec. 24
134 Shortage Intervals approved by Dispatch All intervals reviewed and
between 00:15 and 16:15. validated during LMP
verification on Dec. 27.
Number of Intervals Reserve Penalty Factors
69 MAD & RTO – Primary
37 MAD & RTO – Primary & Synchronized
16 MAD & RTO – Primary & RTO – 30-Minute
1 MAD & RTO – Primary & RTO – Synchronized
11 RTO Primary
www.pjm.com | Public 22 PJM©2023Load Management Deployment
(Pre-Emergency and Emergency Demand Response)
Deployed and released in tranches (Emergency vs.
Pre-Emergency, 30-, 60- or 120-minute lead time, and zone)
Load Management based on system conditions
dispatched for Dec. 23, 2022 – Approximately 17:30 (first notification) through
all zones 4,000 MW of capacity deployed 22:15 (last release)
in the RTO.
Dec. 24, 2022 – Approximately 04:20 (first notification) through
7,000 MW of capacity deployed 20:30 (last release)
Load Management is required to consumer at or below the firm service load
level. Facility may reduce load or postpone electricity consumption.
www.pjm.com | Public 23 PJM©2023PAI Overview
Maximum Generation Emergency Actions Prompted
277 PAI Intervals Across Dec. 23 and Dec. 24
Start End # Intervals
Dec. 23, 2022 17:30 Dec. 23, 2022 23:00 66
Dec. 24, 2022 04:25 Dec. 24, 2022 22:00 211
Affected All Resources in the Entire RTO, Including External Capacity Resources
www.pjm.com | Public 24 PJM©2023PAI Actions to Date
During PAI Timing and cause
Retroactive replacement
transaction information
Member (400 received)
Following PAI
Communications
Preliminary Balancing Ratio
Sent information
Preliminary Balancing Ratios calculated and
posted to Data Miner
www.pjm.com | Public 25 PJM©2023Balancing Ratio
The Balancing Ratio is calculated during each Performance Assessment
Interval (PAI) to determine each generation capacity resource’s obligation
to deliver energy.
Balancing Ratio (BR) =
Total Actual Generation and Storage Performance + Net Energy Imports + DR and PRD Bonus Performance*
All Generation and Storage Committed Capacity Commitments (UCAP)
*Note: DR and PRD Bonus Performance are not included in the Preliminary Balancing Ratio due to data submission timelines.
Preliminary Balancing Ratios
Date/Time Area(s) Average BR Min BR Max BR
Dec. 23 17:00–23:00 RTO 85.48% 83.00% 86.58%
Dec. 24 04:25–22:00 RTO 80.62% 78.39% 82.73%
www.pjm.com | Public 26 PJM©2023Resource Performance Evaluation
Performance is evaluated for each committed capacity resource for each 5-minute
interval of a performance assessment event.
Performance Shortfall (per interval) =
Expected Total Excused MW
Actual Performance
Performance
• Approved planned or maintenance outages
Committed Capacity Actual Generation + Ancillary
• MW scheduled down due to economic dispatch
MW * Balancing Ratio Services
• MW scheduled down due to manual dispatch
Capacity Resources with a positive Performance Shortfall are subject to a
Non-Performance Charge = Performance Shortfall * Non-Performance Charge Rate
www.pjm.com | Public 27 PJM©2023Non-Performance Charge Rate
for Performance Shortfalls
Locational Net CONE Non-Performance Charge Rate
The Non-Performance Charge Deliverability Area ($/MW-Day, ICAP Price) ($/MW-interval)
Rate is based on yearly Net ATSI 218.79 221.83
ATSI-CLEVELAND 218.79 221.83
CONE, a divisor (i.e., an BGE 214.87 217.85
assumed 30 Emergency Action COMED 235.27 238.54
DAY 214.82 217.80
hours per year) and the number DEOK 212.27 215.22
of Real-Time Settlement DPL-SOUTH 224.18 227.29
EMAAC 246.18 249.60
Intervals in an hour. MAAC 232.67 235.90
PEPCO 246.34 249.76
Charge Rate = PPL 237.69 240.99
PS-NORTH 254.8 258.34
(Net CONE * # days in the Delivery PSEG 254.8 258.34
RTO 247.26 250.69
Year) / (30 * 12) SWMAAC 230.61 233.81
Note: Non-Performance Charge Rates are calculated for each LDA modeled for the delivery year.
www.pjm.com | Public 28 PJM©2023Estimated Non-Performance Charges
PJM’s rough estimate of non-performance charges for Dec. 23
and Dec. 24 is in the $1 billion to $2 billion range.
This estimate is provided as an initial reference point only and can change materially.
It includes preliminary excusals for MW scheduled down due to economic
dispatch. It is subject to further change (increase or decrease) based on:
Note: FRR entities
• Changes to the • Further review of actual resource performance data could have elected
final balancing ratio physical penalty in
• Further review of excusals due to economic dispatch
lieu of financial
• Approval of • Inclusion of excusals for: prior to DY.
retroactive
− Approved planned or maintenance outages
replacement
− MW scheduled down due to manual dispatch
transactions
www.pjm.com | Public 29 PJM©2023Bonus Credits:
Allocation of Collected Non-Performance Charges
Revenue collected from payment of Non-Performance Charges is distributed
to resources (of any type, even if they are not Capacity Resources) that
perform above expectations during each PAI.
§ The credit is based on the ratio of its Bonus Performance quantity to the total Bonus
Performance quantity (from all resources and PRD Providers for the same PAI).
§ Bonus Performance quantity = Actual Performance minus Expected Performance and is
capped at the scheduled megawatt quantity.
www.pjm.com | Public 30 PJM©2023Billing Timing OATT Attachment DD, Section 10A (j)The Office of the Interconnection shall bill charges and credits for performance during Performance Assessment Intervals within three calendar months after the calendar month that included such Performance Assessment Intervals, provided, for any Non- Performance Charge, the amount shall be divided by the number of months remaining in the Delivery Year for which no invoice has been issued, and the resulting amount shall be invoiced each such remaining month in the Delivery Year or during the first month of the next Delivery Year if three months do not remain in the current Delivery Year. § PJM is currently working through the billing timeline to account for any non-payment risk and liquidity concerns. § Additional information will be provided at the Jan. 24 Risk Management Committee meeting. www.pjm.com | Public 31 PJM©2023
Performance Assessment Next Steps

 • Review resource     • Retroactive                • Release of preliminary
   performance and       replacement                  resource performance data
   excusals              transaction review and       (targeted by first full week
                         approval                     of February)

                                                              Dependency for
 • Demand Response/Price Responsive Demand
                                                              calculation of final
   compliance data submission (due Feb. 14, 2023)             balancing ratio

www.pjm.com | Public                  32                                        PJM©2023
You can also read