World Bank Group | LinkedIn - DATA INSIGHTS: JOBS, SKILLS AND MIGRATION TRENDS METHODOLOGY & VALIDATION RESULTS
←
→
Page content transcription
If your browser does not render page correctly, please read the page content below

Public Disclosure Authorized

 World Bank Group | LinkedIn
 DATA INSIGHTS:
 JOBS, SKILLS AND
 MIGRATION TRENDS
Public Disclosure Authorized

 METHODOLOGY &
 VALIDATION RESULTS
 Tingting Juni Zhu Alan Fritzler Jan Orlowski
Public Disclosure Authorized
Public Disclosure Authorized

ACKNOWLEDGEMENTS

Authors:
Tingting Juni Zhu (TTL, Private Sector Specialist) and Jan Orlowski
(Economist) at Finance, Competitiveness and Innovation Global
Practice, World Bank Group, Washington, DC, and Alan Fritzler (Senior
Data Scientist) at LinkedIn Corporation, San Francisco, CA, prepared
this methodology and validation report. For questions and com-
ments, please contact Tingting Juni Zhu at tzhu@worldbank.org.

People we thank:
We would like to thank the broader team, Ramin Aliyev, Rajan
Bhardvaj, J. Ernesto Lopez Cordova, Dina Elnaggar, Elena Gex, Anh Le,
Une Lee, Jiemei Liu, Renzo Massari, Jeffrey Mccoy, Moira Mckerracher,
Rodimiro Rodrigo, David Satola, Nika Soon-Shiong, Nina Vucenik, and
Douglas Zhihua Zeng from WBG, and Hannah Brown, Pei Ying Chua,
Nick Eng, Nicole Isaac, Paul Ko, Mariano Mamertino, Di Mo ,Kevin
Morsony, Akshay Verma, Tony Vu, and Jenny Ying from LinkedIn for
their helpful comments and support of the project. In addition, task
team leaders of the World Bank Group’s operations helped configure
the research and provide feedback during the team’s work, including
Carli Blunding-Venter (Sub-Saharan Africa), Cesar A. Cancho (Europe
and Central Asia), John Gabriel Goddard (Sub-Saharan Africa), Marco
Antonio Hernandez Ore (Europe and Central Asia), and Marcin
Miroslaw Piatkowski (East Asia and Pacific). We would also like to
acknowledge the comments and feedback from Ana Paula Cusolito,
Mary C. Hallward-Driemeier, Victoria Levin, Espen Beer Prydz, and
Hernan Winkler. Finally, we would like to thank the seed funders of
this project in a big data competition at the World Bank Group
exploring nontraditional datasets for public policy-making in
developing countries: Prasanna Lal Das, Trevor Monroe, Victor Mulas,
and Klaus Tilmes. Without their entrepreneurial spirit, the project
would not have become what it is today.

ABBREVIATIONS
BLS U.S. Bureau of Labor Statistics
ECA Europe and Central Asia
EAP East Asia and Pacific
ICT Information and Communications Technology
ILO International Labor Organization
ILOSTAT International Labor Organization Statistics
ISIC International Standard Industrial Classification
LAC Latin America and the Caribbean
MENA Middle East and North Africa
OECD Organization for Economic Cooperation and Development
PIAAC Program for the International Assessment of Adult
 Competencies
PS-TRE Problem solving in technology-rich environments
NAC North America
SA South Asia
SSA Sub Saharan Africa
WBG World Bank Group

2

Table of Contents

 FIGURES . . . . . . . . . . . . . . . . . . . . . . . . . . . . . . . . . . . . . . . . . . 2 IV. LinkedIn Metrics Validation Results . . 37
 TABLES. . . . . . . . . . . . . . . . . . . . . . . . . . . . . . . . . . . . . . . . . . . . 3 A. Industry Employment Metrics. . . . . . . . . . . . . . . . . 37
 BOXES . . . . . . . . . . . . . . . . . . . . . . . . . . . . . . . . . . . . . . . . . . . . 3 1) Industry Employment Location Quotient. . . . . . . 37
 a)
 Overview. . . . . . . . . . . . . . . . . . . . . . . . . . . . . . . . . . . 37
 EXECUTIVE SUMMARY. . . . . . . . . . . . . . . . . . . . . . . . . . . . . 4
 b)
 Methodology. . . . . . . . . . . . . . . . . . . . . . . . . . . . . . . 37
 c)
 Validation Results . . . . . . . . . . . . . . . . . . . . . . . . . . 40
I. Introduction. . . . . . . . . . . . . . . . . . . . . . . . 15 (1) Industry Employment Location
 A. Using Online Data for Policy Research. . . . . . . . . . 15 Quotient Globally . . . . . . . . . . . . . . . . . . . . . . . . 40
 B. Quality Control and Limitations of (2) Employment Location Quotient
 LinkedIn Data . . . . . . . . . . . . . . . . . . . . . . . . . . . . . . . . 16 According to Industry . . . . . . . . . . . . . . . . . . . . 40
 (3) Industry Employment Location
 C. Innovative Applications of LinkedIn Data . . . . . . . 18
 Quotient According to Income Group . . . . . 41
 D. Overview of WBG-LinkedIn Partnership (4) Industry Employment Location Quotient
 and Data Update Plan. . . . . . . . . . . . . . . . . . . . . . . . . 18 According to World Bank Region. . . . . . . . . . 41
 2) Industry Employment Growth. . . . . . . . . . . . . . . . . 43
II. Data Sources. . . . . . . . . . . . . . . . . . . . . . . 19 a) Overview. . . . . . . . . . . . . . . . . . . . . . . . . . . . . . . . . . . 43
 b) Methodology. . . . . . . . . . . . . . . . . . . . . . . . . . . . . . . 44
 A. Age and Sex. . . . . . . . . . . . . . . . . . . . . . . . . . . . . . . . . . 20
 c) Validation Results . . . . . . . . . . . . . . . . . . . . . . . . . . 44
 B. Industry Employment Size . . . . . . . . . . . . . . . . . . . . 20 (1) Industry Employment Growth in All BLS
 C. Industry Employment Growth. . . . . . . . . . . . . . . . . 21 Super-Sectors . . . . . . . . . . . . . . . . . . . . . . . . . . . 44
 D. Skills . . . . . . . . . . . . . . . . . . . . . . . . . . . . . . . . . . . . . . . . 21 (2) Industry Employment Growth According to
 BLS Super-Sector. . . . . . . . . . . . . . . . . . . . . . . . 45
 E. Talent Migration. . . . . . . . . . . . . . . . . . . . . . . . . . . . . . 25
 B. Skills . . . . . . . . . . . . . . . . . . . . . . . . . . . . . . . . . . . . . . . . 49
 a) Overview. . . . . . . . . . . . . . . . . . . . . . . . . . . . . . . . . . . 49
III. LinkedIn Data Representativeness . . . 27
 b) Methodology. . . . . . . . . . . . . . . . . . . . . . . . . . . . . . . 49
 A. Age. . . . . . . . . . . . . . . . . . . . . . . . . . . . . . . . . . . . . . . . . . 27 (1) Industry Skills Needs. . . . . . . . . . . . . . . . . . . . . 49
 1) Age Distribution Globally . . . . . . . . . . . . . . . . . . . . . . 27 i. Identifying the Top Represented Skills. . . 49
 2) Age Distribution According to ii. Aggregating Skills to Groups of Skills. . . . 50
 Income Group. . . . . . . . . . . . . . . . . . . . . . . . . . . . . . . . . 28 (2) Skill Penetration Rate. . . . . . . . . . . . . . . . . . . . 51
 3) Age Distribution According to 2) Validation Results. . . . . . . . . . . . . . . . . . . . . . . . . . . . . 52
 World Bank Region. . . . . . . . . . . . . . . . . . . . . . . . . . . . 28 (1) PIAAC ICT Skills Score of Problem Solving
 B. Sex. . . . . . . . . . . . . . . . . . . . . . . . . . . . . . . . . . . . . . . . . . 30 in Technology-Rich Environments. . . . . . . . 52
 1) Sex Distribution Globally. . . . . . . . . . . . . . . . . . . . . . . 30 (2) ICT Development Index Data. . . . . . . . . . . . . 52
 2) Sex Distribution According to (3) Correlation Results. . . . . . . . . . . . . . . . . . . . . . . 53
 Income Group. . . . . . . . . . . . . . . . . . . . . . . . . . . . . . . . . 30 C. Talent Migration Metrics. . . . . . . . . . . . . . . . . . . . . . 54
 3) Sex Distribution According to a) Overview. . . . . . . . . . . . . . . . . . . . . . . . . . . . . . . . . . . 54
 World Bank Region. . . . . . . . . . . . . . . . . . . . . . . . . . . . 30 b) Methodology. . . . . . . . . . . . . . . . . . . . . . . . . . . . . . . 54
 C. Industry . . . . . . . . . . . . . . . . . . . . . . . . . . . . . . . . . . . . . 32 c) Validation Results . . . . . . . . . . . . . . . . . . . . . . . . . . 56
 1) Industry Coverage Globally. . . . . . . . . . . . . . . . . . . . 32 (1) Talent Migration Globally. . . . . . . . . . . . . . . . . 56
 2) Industry Coverage According to (2) Talent Migration According to
 Income Group. . . . . . . . . . . . . . . . . . . . . . . . . . . . . . . . . 34 Income Group. . . . . . . . . . . . . . . . . . . . . . . . . . . . 56
 3) Industry Coverage According to (3) Talent Migration According to World Bank
 World Bank Region. . . . . . . . . . . . . . . . . . . . . . . . . . . . 34 Region. . . . . . . . . . . . . . . . . . . . . . . . . . . . . . . . . . . 56

 1

TABLE OF CONTENTS continued FIGURES, TABLES, AND BOXES

V. Sample Visual Outputs and FIGURES
 Country Applications. . . . . . . . . . . . . . . . 59
 A. Industry Employment Dynamics. . . . . . . . . . . . . . . 59 Figure 0-1: World Bank Group (WBG)-LinkedIn Collaboration
 Schedule . . . . . . . . . . . . . . . . . . . . . . . . . . . . . . . . . . . . . . . . . 5
 B. Skills . . . . . . . . . . . . . . . . . . . . . . . . . . . . . . . . . . . . . . . . 65
 Figure 0-2: Three Objectives of this Methodology Report. . . . . . 6
 C. Talent Migration. . . . . . . . . . . . . . . . . . . . . . . . . . . . . . 65 Figure 0-3: LinkedIn Industry Coverage According to (A)
 Income Group and (B) World Bank Region . . . . . . . . . 7
VI. Conclusions. . . . . . . . . . . . . . . . . . . . . . . . 69 Figure 0-4: Growth from Industry Transitions according to
 Income Group Annual Average 2015-2017. . . . . . . 12
VII. References. . . . . . . . . . . . . . . . . . . . . . . . . 70 Figure 0-5: Global Artificial Intelligence Skill Penetration
 2015-2017. . . . . . . . . . . . . . . . . . . . . . . . . . . . . . . . . . . . . . 13
 Appendix A. External vs. LinkedIn Data Matching Figure 0-6: Skills with the Largest Increase in Penetration
 Methodology . . . . . . . . . . . . . . . . . . . . . . . . . . . . . . . . . . . . . 71 Across Industries 2015-2017. . . . . . . . . . . . . . . . . . . . 13
 1) Age and Sex. . . . . . . . . . . . . . . . . . . . . . . . . . . . . . . . . . . 71 Figure 0-7: Global Talent Migration 2015-2017. . . . . . . . . . . . . . 14
 2) Industry Employment Size. . . . . . . . . . . . . . . . . . . . . 71 Figure II-1: Sample LinkedIn Profile. . . . . . . . . . . . . . . . . . . . . . . . . . 19
 3) Industry Employment Growth. . . . . . . . . . . . . . . . . 73 Figure II-2: Sample LinkedIn Profile Work Experience. . . . . . . . . 21
 4) Skills. . . . . . . . . . . . . . . . . . . . . . . . . . . . . . . . . . . . . . . . . . 74 Figure II-3: Sample LinkedIn Profile Skills Section . . . . . . . . . . . . 25
 5) Talent Migration . . . . . . . . . . . . . . . . . . . . . . . . . . . . . . 74 Figure II-4: Sample LinkedIn Profile Location Information. . . . . 25
 Appendix B. LinkedIn Data Country List Figure III-1: Global Age Distribution (LinkedIn vs.
 (100,000+ members) n=140. . . . . . . . . . . . . . . . . . . . . . . 75 International Labor Organization (ILO)). . . . . . . . . . . . 27
 Figure III-2: Age Distribution According to Income Group
 Appendix C. LinkedIn to International Standard (LinkedIn vs. International Labor
 Industrial Classification 4 Industry Mapping. . . . . . . . . 78 Organization (ILO)). . . . . . . . . . . . . . . . . . . . . . . . . . . . . . . 28
 Appendix D. Migration Data Summary Charts. . . . . . . . 83 Figure III-3: Age Distribution According to World Bank Region
 (LinkedIn vs. International Labor
 Appendix E. Migration Validation Other Data Organization (ILO)). . . . . . . . . . . . . . . . . . . . . . . . . . . . . . . 29
 Sources Evaluated . . . . . . . . . . . . . . . . . . . . . . . . . . . . . . . . 84 Figure III-4: Global Sex Distribution (LinkedIn vs.
 Appendix F. Skill Group Classification. . . . . . . . . . . . . . . 86 International Labor Organization (ILO)). . . . . . . . . . . . 30
 Figure III-5: Sex Distribution According to Income Group
 (LinkedIn vs. International Labor
 Organization ((LO)). . . . . . . . . . . . . . . . . . . . . . . . . . . . . . . 31
 Figure III-6: Sex Distribution According to World Bank
 Region (LinkedIn vs. International Labor
 Organization (ILO)). . . . . . . . . . . . . . . . . . . . . . . . . . . . . . . 31
 Figure III-7: Global LinkedIn Industry Coverage (LinkedIn as
 Percentage of Total International Labor
 Organization (ILO) Workforce, 2016). . . . . . . . . . . . . . 32
 Figure III-8: LinkedIn Industry Coverage According to
 Income Group. . . . . . . . . . . . . . . . . . . . . . . . . . . . . . . . . . . .35
 Figure III-9: LinkedIn Industry Coverage According to
 World Bank Region . . . . . . . . . . . . . . . . . . . . . . . . . . . . . . 35
 Figure IV-1: Country -Industry Pair Location Quotients. . . . . . . . 40
 Figure IV-2: Global Industry Location Quotient Correlation
 (LinkedIn vs. International Labor Organization). . . . 41
 Figure IV-3: Global Industry Location Quotient Correlation
 According to Income (LinkedIn vs. International
 Labor Organization). . . . . . . . . . . . . . . . . . . . . . . . . . . . . . 42
 Figure IV-4: Global Industry Location Quotient Correlation
 According to World Bank Region (LinkedIn vs.
 International Labor Organization). . . . . . . . . . . . . . . . . 42
 Figure IV-5: Super-Sector Industry Employment Growth
 Correlation (LinkedIn vs. Bureau of Labor
 Statistics). . . . . . . . . . . . . . . . . . . . . . . . . . . . . . . . . . . . . . . . 46

2
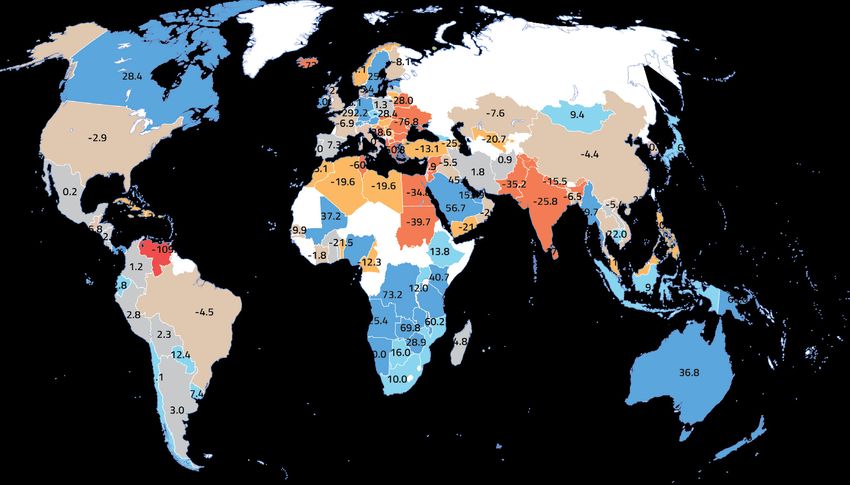
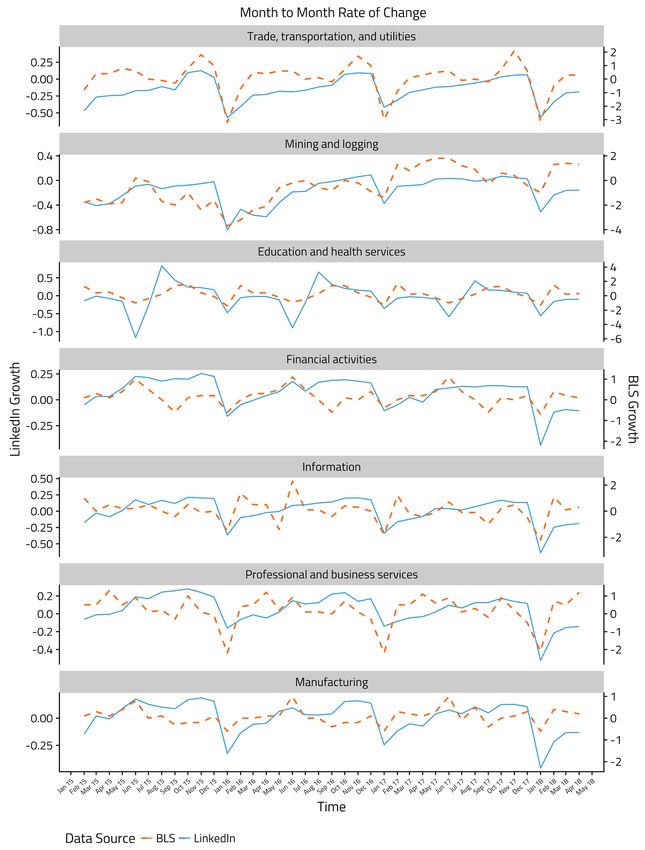
Figure IV-6: Monthly Growth of Super-Sectors with
 TABLES
 Significant Correlation Between LinkedIn and
 Bureau of Labor Statistics (BLS),
 Table 0-1: Summary of Metrics: Methodology and
 Jan 2015 – Apr 2018). . . . . . . . . . . . . . . . . . . . . . . . . . . . 47
 Validation Results. . . . . . . . . . . . . . . . . . . . . . . . . . . . . . . . . 8
Figure IV-7: Monthly Growth of Super-Sectors with
 Table 0-2: Sample Policy Questions Using LinkedIn Metrics. . 11
 Nonsignificant Correlation Between LinkedIn and
 Table II-1: LinkedIn Industry Employment Growth Data
 Bureau of Labor Statistics (BLS),
 Extraction Methods. . . . . . . . . . . . . . . . . . . . . . . . . . . . . . 22
 Jan 2015 – Apr 2018). . . . . . . . . . . . . . . . . . . . . . . . . . . . 48
 Table II-2: Summary of External Datasets Considered for
Figure IV-8: Example of Aggregating Detailed Skills into
 Skills Metrics Validation Exercises. . . . . . . . . . . . . . . . 23
 Skill Groups. . . . . . . . . . . . . . . . . . . . . . . . . . . . . . . . . . . . . . 50
 Table II-3: Summary of Other Major External Migration
Figure IV-9: Log-Transformed Outflow Migration Rate:
 Datasets Considered. . . . . . . . . . . . . . . . . . . . . . . . . . . . . 26
 Organization for Economic Cooperation and
 Table III-1: Summary of Other Considered External
 Development (OECD) vs. LinkedIn Data. . . . . . . . . . . 56
 Datasets . . . . . . . . . . . . . . . . . . . . . . . . . . . . . . . . . . . . . . . . 33
Figure IV-10: Migration Correlation Results According to
 Table IV-1: Correlations between skills and development
 Income Group (Log-Transformed) . . . . . . . . . . . . . . . . 57
 outcomes (US as the benchmark) . . . . . . . . . . . . . . . . 53
Figure IV-11: Migration Correlation Results According to
 Table IV-2: Correlations with Software Engineer in Section J
 World Bank Region (Log-Transformed) . . . . . . . . . . . 57
 skills vector (US as the benchmark). . . . . . . . . . . . . . . 53
Figure V-1: Industry Employment Size Location Quotient
 for the Finance and Insurance Sector in China,
 Macedonia, Mexico, and South Africa. . . . . . . . . . . . . 60
Figure V-2: Growth from Industry Transitions in the
 Information and Communication Sector
 BOXES
 Annual Average 2015-2017 . . . . . . . . . . . . . . . . . . . . . 61
 Box 1: Pilot Country 1–Identifying Comparative
Figure V-3: Growth from Industry Transitions Worldwide in
 Advantage and Skills Development Needs in
 100+ Countries Annual Average 2015-2017. . . . . 62
 South Africa. . . . . . . . . . . . . . . . . . . . . . . . . . . . . . . . . . . . . 38
Figure V-4: Growth from Industry Transitions According
 Box 2: Which Benchmark to Choose When Calculating
 to World Bank Region Annual Average
 Location Quotient. . . . . . . . . . . . . . . . . . . . . . . . . . . . . . . . 39
 2015-2017. . . . . . . . . . . . . . . . . . . . . . . . . . . . . . . . . . . . . . 63
 Box 3: Why we construct a balanced panel data
Figure V-5: Growth from Industry Transitions According to
 from LinkedIn. . . . . . . . . . . . . . . . . . . . . . . . . . . . . . . . . . . . 44
 Income Group Annual Average 2015-2017. . . . . . . 64
 Box 4: Why correlating industry employment growth
Figure V-6: Most-Representative Skill Groups for the Online
 of the International Labor Organization (ILO)
 Media Industry Globally. . . . . . . . . . . . . . . . . . . . . . . . . . 65
 with that of LinkedIn does not yield the
Figure V-7: Top Industries Using Artificial Intelligence Skill,
 expected result. . . . . . . . . . . . . . . . . . . . . . . . . . . . . . . . . . 45
 Globally 2015-2017. . . . . . . . . . . . . . . . . . . . . . . . . . . . . 65
 Box 5: Calculating digital marketing skill group’s
Figure V-8: Net International Talent Migration (per 10,000
 penetration rate in information and
 LinkedIn Members in Country of Interest, Annual
 communications technology (ICT) and services
 Moving Average 2015-2017) . . . . . . . . . . . . . . . . . . . . 66
 industry. . . . . . . . . . . . . . . . . . . . . . . . . . . . . . . . . . . . . . . . . 51
Figure V-9: Middle East and North Africa (MENA) Net
 Box 6: Pilot Country 2–Talent and Skill Migration,
 Migration Rate per 10,000 LinkedIn Members,
 Macedonia . . . . . . . . . . . . . . . . . . . . . . . . . . . . . . . . . . . . . . 54
 2015-2017. . . . . . . . . . . . . . . . . . . . . . . . . . . . . . . . . . . . . . 67
 Box 7: Pilot Country 3–Intercity Migration Trends in
Figure V-10: Middle East and North Africa Largest Skills
 China. . . . . . . . . . . . . . . . . . . . . . . . . . . . . . . . . . . . . . . . . . . . 55
 and Industry Loss Associated with Talent
 Box 8: Should We Weight the LinkedIn Data to Obtain a
 Movements, 2015 – 2017. . . . . . . . . . . . . . . . . . . . . . . 67
 Representative Sample When Conducting Global
 Benchmarking?. . . . . . . . . . . . . . . . . . . . . . . . . . . . . . . . . . 61
 Box 9: How to Compare Migration Flows Between
 Countries Fairly . . . . . . . . . . . . . . . . . . . . . . . . . . . . . . . . . .66

 3
EXECUTIVE SUMMARY
The World Bank Group-LinkedIn partnership pilots the useful for policy-makers. For example, LinkedIn data can help
use of private company data for generating insights on answer pressing questions such as “What skills are gained
development trends. This partnership is a three-year effort or lost in association with talent migration in my country?”
between the WBG and LinkedIn to investigate the extent to and “What are the most recent sectoral employment trends,
which LinkedIn’s data can inform policy (figure 0-1). The first and which skills are most relevant to them?” Nonetheless,
phase of the partnership evaluates LinkedIn data covering because of the granularity and sheer amount of user-
100+ countries with at least 100,000 LinkedIn members, generated data, the industry and skills classifications that
distributed across 148 industries and 50,000 skills catego- LinkedIn taxonomy uses are not standard and may not
ries. The second and third phase focus on automating and always conform to commonly used standards such as the
scaling insights, and expanding joint research. International Standard Industrial Classification (ISIC);
 European Skills/Competences, Qualifications, and Occupa-
This methodology report describes the construction and tions (ESCO); and the Occupational Information Network
validation of metrics on skills, industry employment, and (O*NET). Part of the contribution of this methodology report
talent migration in over 100 countries. This report has is to match LinkedIn’s taxonomies to these international
three objectives: (1) document the characteristics and standards to allow for easier matching of LinkedIn data with
coverage of LinkedIn data; (2) report the methods used to external datasets for further analysis. These efforts are
develop new metrics; and (3) showcase examples of policy central to the continued use of LinkedIn data as a valuable
questions that can be answered with this non-traditional complement to traditional data sources.
data (figue 0-2). Because this is the first time that LinkedIn
has shared a nontraditional dataset with a third-party LinkedIn data are best at representing skilled labor in the
organization globally as a public good (strictly unremunerat- knowledge-intensive, and tradable sectors. The LinkedIn
ed), it is important that we make these methodology and metrics were compared and validated against 23 internation-
validation results available so that researchers and poli- ally standardized data sources on industry, skill, and migration
cy-makers can build on this initial effort by the WBG and trends.1 Although LinkedIn may have better coverage in
LinkedIn. developed than developing countries, there are certain
 knowledge-intensive and tradable sectors, such as informa-
The metrics generated from LinkedIn’s data differ from tion and communication; professional, scientific, and technical
traditional government indicators in important ways. As activities; financial and business services; arts and entertain-
new development opportunities emerge, especially in the ment; manufacturing; and mining and quarrying, that have
digital economy around the globe, WBG is seeking new data good LinkedIn coverage globally (figure 0-3).2 This allows for
sources that can capture the latest development trends. benchmarking of performance across locations globally in
Traditional government surveys often cannot keep up with these six sectors.
this demand. Making LinkedIn real-time data available for
development use, especially in developing countries, can be

1 See Table II-3 and Appendix E (Migration), Table II-2 (Skills), and Table III-1 (Industry Employment) for all the external data sources that the team evaluated
2 The strong LinkedIn coverage of the mining and quarrying sector is partially due to companies on LinkedIn incorrectly identifying themselves as oil and
 energy companies rather than as utilities and hence being misclassified in ISIC sector B instead of D. An example of this is EDF Energy in the United Kingdom.
 See section II-C-1 (Industry Coverage Globally). Manufacturing has significantly lower coverage, however it is a an important tradable sector for inclusion.

4
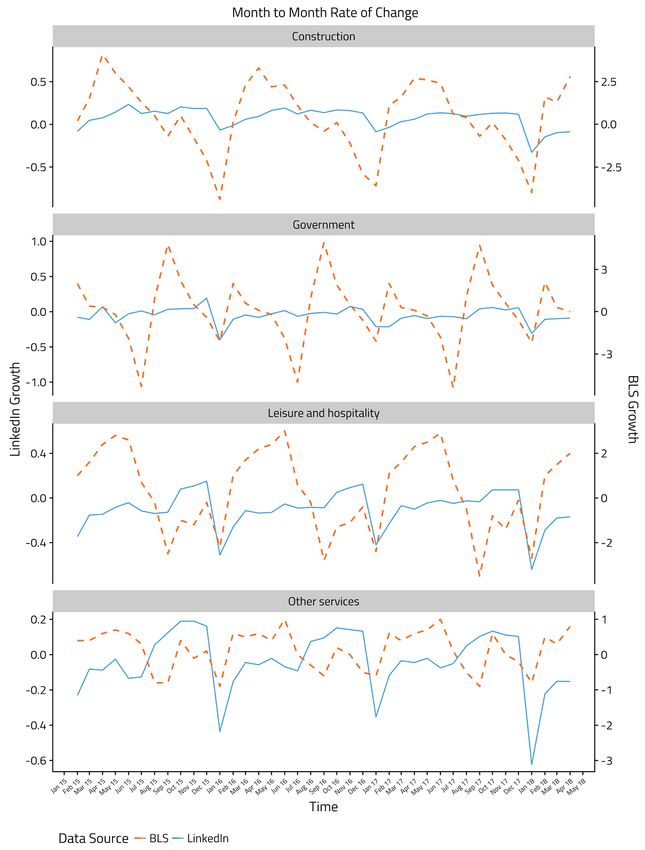
FIGURE 0-1:

World Bank Group (WBG)-LinkedIn Collaboration Schedule

 PHASE 1: PHASE 2: PHASE 3:
 Harnessing Data Deploying Scale Up
 (with a Technology for (Inform policies
 Methodology Automated Policy and WBG
 Paper) Visuals investments)

 Sept. 2017 – Oct. 2018 Nov. – Dec. 2018 2019 – 2020

 1. LinkedIn Data 1. Automated Data Tool: 1. From Open Data to Open
 Charactristics: Knowledge Standardized global data on Analytics: Sharing dataset
 intensive, tradeable sector • skills need and R codes that generate
 and high-skilled labor • industry employment country results within WBG
 2. Data Extraction Methods • talent migration trends 2. Additional Topics/Metrics:
 & Validation Results: About 600 locations Impacts of automation on
 Construct a dataset sharable in 100+ countries jobs and skills over time,
 to the public 2. Global Research: Emerging woman entrepreneurship...
 3. Pilot Insights: Country pilot skills and digital sectors due
 examples using the dataset to technological change
 (Macedonia SCD, South
 Africa RAS, China ASA)

In addition to certain sectoral skewness, young, skilled than traditional government statistics, they have the unique
individuals with at least a bachelor’s degree are more likely ability to capture the latest employment and industry skills
than those with less education to be on LinkedIn, and needs, which government statistics often miss—especially in
women are more likely to be captured in LinkedIn than the digital and disruptive technology sectors. Industry
national statistics. In general, although LinkedIn data are not employment, skills, and talent migration metrics comprise
representative of the entire economy and are self-reported, the first phase of this partnership (table 0-1).
they can uniquely capture segments of the economy that are
among the most innovative, dynamic and high-value add. In
addition, because these data are updated more frequently

 5

FIGURE 0-2:
 1
Three Objectives of this
Methodology Report
 Document Data
 Characteristics
 What are the characteristics,
 coverage, and biases of
 this data?

 2

 Describe Methods
 How are new metrics generated,
 and how do they compare to
 internationally standardized
 sources of similar data?

 3

 Showcase
 Applications
 What type of policy questions
 are best answered with this
 non-traditional data?

6

FIGURE 0-3:

LinkedIn Industry Coverage According to (A) Income Group and
(B) World Bank Region
 A. LinkedIn member coverage B. LinkedIn member coverage of
 of ILO workforce according to ILO workforce according to World
 Income Group (2016) Bank Region (2016)

 J. Information
 and
 communication

 M. Professional,
 scientific and
 technical
 activities

 B. Mining and
 quarrying

 K. Financial and
 insurance
 activities

 R. Arts,
 entertainment
 and recreation

 C. Manufacturing
 6M e

 r M .62 e

 1 e

 0.1 e

 .94 CA

 8M A

 7M C

 5M P

 6M A

 9M A
 0.5 om

 we n=5 com

 2.5 m

 n= com

 4.0 LA

 0.6 S

 0.1 SS
 1.5 N

 4.3 A
 17 E

 n= E
 n= ME
 idd M

 Lo M

 M

 M
 n= Inco
 c
 n= h In

 In

 In
 le

 le

 w
 g

 idd
 2

 n=

 n=

 n=
 Hi

 n=
 rM
 pe
 Up

 Lo

 ‘n’ denotes samples size

Note: See Section III.C for more information on LinkedIn industry representativeness. Because of lower penetration rates of some sectors, the
first phase of the World Bank Group-LinkedIn collaboration will share data only from the six knowledge-intensive and tradable sectors to ensure
data quality and minimize risks of misinterpretation of the LinkedIn data due to small sample size; the remaining sectors not shows are: : L. Real
estate activities; D. Electricity; gas, steam and air conditioning supply; N. Administrative and support service activities; P. Education; O. Public
administration and defense; compulsory social security; S. Other service activities; Q. Human health and social work activities; H. Transportation
and storage; G. Wholesale and retail trade; repair of motor vehicles and motorcycles; F. Construction; I. Accommodation and food service
activities: A. Agriculture; forestry and fishing.

Source: Authors’ calculation using LinkedIn and International Labor Organization (ILO) data in 92 countries

 7

TABLE 0-1:

Summary of Metrics: Methodology and Validation Results

 METRIC NAME METHOD TO DERIVE THE METRICSa CONFIDENCE LEVEL
 ,,.,/ =
 ,,.,/
 ; .,/
 (REASONS)

 1) Industry Employment

 ,,.,/
 Industry employ- For a given country c,
 industry i,,,.,/
 and = time t,
 ,,/ High (good global
 ment location ,,.,/ =
 ,,.,/
 ,,.,/
 coverage, good validation
 quotient (LQ) ,,.,/ = ;; .,/
 .,/ results)
 Captures the
 employment size of an where with industry size measured as a relative
 ,,.,/ term:
 industry in a particular ,,.,/ =
 ; .,/
 locale, relative to the ,,.,/
 ,,.,/ = ,,.,/
 same industry in other ,,.,/ = ,,/
 ,,/
 locales.

 ,,.,/AB −
 Industry employ- ℎ ,,. =
 =
 ,,.,/ ,,.,/
 ,,.,/,,.,/ ∗ 100
 Medium (good global
 ,,/
 ment growthb coverage, good validation
 Captures the − results but external data
 transitions among Growth is given
 as rate
 ℎ
 ℎ,,.
 of employment-level
 = ,,.,/AB change ,,.,/
 ,,.,/AB − ,,.,/ ∗ 100 source covers only specific
 ,,. = ,,.,/ ∗ 100
 industries over time by (e.g., 2015-2017) for country c and industry i, ,,.,/
 countries)
 LinkedIn members as a
 proxy for industry ,,.,/AB − ,,.,/
 employment growth. ℎ,,. = ∗ 100
 ,,.,/
 Based on the
 industries declared by
 the companies in a
 member’s work
 history.

 2) Skills

 .G = .G ∗ l n L
 .G = .G ∗ l n J
 J L
 Industry skills For each country, the weight (wi,s) denotes how distinctive and Medium (good global
 needs representative each skill s is in industry i as: coverage for knowl-
 .G = .G ∗ l n J edge-intensive and
 Captures the
 , = , ∗ l n L
 most-distinctive, I K tradable sectors, good
 most-represented validation results but
 skills of LinkedIn with mi,s indicating the number of members in industry i having skill s, external data source
 members working in
 a particular industry. N the total number of industries, and ns the total number of industries covers only specific
 Based on the skills having skill s. The first term gives greater weight to skills that have countries)
 section of the LinkedIn high membership penetration, and the second term gives less weight
 profile. to “common” skills that appear in all industries (e.g., Microsoft Office).
 In this sense, the most important skills for each industry are those
 that have high member penetration but are also unique.

 continues

8
TABLE 0-1: continued

 Skill penetration There are four steps to compute skill penetration: Medium (good global
 Measures the time coverage for knowl-
 1. Use the industry skills needs framework above to calculate the
 trend of a skill across edge-intensive and
 weight for each skill s for each occupation o in industry i:
 all occupations within

 tradable sectors, good
 an industry. Based on = ∗ ln

 validation results but
 , ,
 , , = , ,
 , , ∗ l n I
 skill addition rates, and I KK
 the number of times a external data source
 particular skill appears covers only specific
 2. Construct a list of the 30 top represented skills for each occupation
 in the top 30 skills countries)
 added across all of the o in industry i, based on the values of wi,o,s :
 occupations within an
 industry. ⌊( 11 ,,
 ⌊( 11 )),, (( 22 ,,
 22 )) …
 … ,, (( 30 , )⌋
 30 , 30
 30 )⌋

 3. Calculate the skill group penetration rate at the occupation-industry
 level pi,o,S by counting the number of skills s belonging to each skill
 group S and dividing by 30:
 30
 30 ∈
 ∑ =1 ∈
 ∑ =1

 , , =
 =
 , , 30
 30

 4. Get the average skill group S penetration rate pi,S across all occupa-
 tions o for the industry i:

 ∑
 =1 , ,
 ∑ =1 , ,

 VV ,
 =
 =
 ,

 3) Talent migration

 Inter- and High (good global
 Fintra-country coverage for knowl-
 talent migration Given as net migration, with country a the country of interest, and edge-intensive and
 FBased on user-report- country b the source of inflows or destination of outflows, at time t, tradable sectors, good
 ed location. When a

 validation results)
 =
 W,X,/

 ∗∗ 10,000
 W,X,/M,N,/
 user’s updated job W,X,/
 M,N,/ ==
 W,X,/

 W,/
 10,000
 ∗ 10,000
 location is different (net flows
 flows =

 = arrivals
 arrivals –

 – departures)
 W,/
 departures)M,/
 (net
 from their former (net flows = arrivals – departures)
 M,N,/
 location, LinkedIn (net flows =
 arrivals – departures)M,N,/ =
 M,/
 ∗ 10,000
 recognizes this as a (net flows = arrivals – departures)
 physical migration.

 Migration – Given as net migration, with country a the country of interest and Low (good global
 industries country b the source of inflows or destination of outflows,
 both
 M,N,.,,/ migration data for
 gained and lost considered for a given
 i at =
 industryM,N,.,,/ time t,
 knowledge-intensive
 M,.,/
 Based on the industry M,N,.,,/ and tradable sectors,
 associated with a M,N,.,,/ = but migration industry
 M,.,/
 member’s company at movements have no
 the time of migration. (This formula is used to calculate the top gaining and losing industries comparable global
 associated with talent migration flows.) external data for
 validation)

 continues
 MP,NP,/
 MP,NP,/ =
 MP,/
 MP,NP,/
 MP,NP,/ =
 MP,/

 9
 M,N,.,,/
 M,N,.,,/ =
 M,.,/

 Migration – skills Given as net migration, with country a the country of interest and Low (good global
 gained and lost country b the source of inflows or destination of outflows, both migration data for
 Based on the skills considered for a given skill s, at time t, knowledge-intensive and
 associated with a tradable sectors, but skills
 MP,NP,/
 member’s profile at MP,NP,/ = migration has no
 the time of migration. MP,/
 comparable global
 external data for
 (This formula is used to calculate the top gaining and losing skills associated
 with talent migration flows.)
 validation)

Notes: Confidence level is evaluated against two criteria: 1) global coverage (High: good for global, Medium: good only for certain
sectors, Low: limited coverage at the moment but expected to improve over time as LinkedIn membership grows and diversifies,
and hence worth including in the dataset and dashboard) and 2) validation results against other independent data sources (High:
highly positively correlated with various government or international organization data sources, Medium: highly positively
correlated with one other source that has data on a specific region or country only, Low: the project team was unable to find a
comparable dataset for validation). This last point also demonstrates the value of LinkedIn data in that they expand the
information available on the topic and can be complementary to traditional survey or administrative data and low confidence
level is not a reflection of the quality of the metric.

a All metrics at the city level were calculated in the same manner as at the country level, except for Industry location quotient, because we did not have
 city-level income for calculation; instead we used country average for the denominator—how a city compares with its own country average.
b Because of rapid LinkedIn membership growth around the globe, the team constructed the balanced panel data to isolate LinkedIn membership growth from
 industry employment growth, so the growth rate captured here is an employment transition rate for experienced employees who report jobs on the LinkedIn
 platform across years. For details, see Section IV-A-2.

To protect user privacy and permit comparability of Based on feedback from three World Bank Group pilot
metrics, LinkedIn metrics are normalized. Because user projects in South Africa, Macedonia, and China, sample
behavior is different in different countries (e.g., overreporting policy questions that LinkedIn metrics can answer are
of work experience; not updating profile if unemployed; listed in table 0-2. In addition to determining descriptive
LinkedIn membership growing exponentially in developing trends, another useful application of the LinkedIn metrics is to
countries and hence the data potentially capturing LinkedIn triangulate across the three categories of metrics. For
business growth instead of industry headcount growth), in example, to nurture certain growing industries, one can
addition to validating against other data sources, we used further explore what skills are needed or whether there is a
statistical methods to normalize and standardize metrics to risk of talent outflow. Furthermore, to conduct analytical and
ensure they can be compared fairly across countries and empirical research, the datasets are structured so they can be
industries. For example, we normalized most metrics easily merged with external data sources. For instance,
according to LinkedIn membership size in each country so because all the LinkedIn data on industries made available
that countries with more workers on LinkedIn did not through this partnership are equivalent to the two- to
artificially rank higher. three-digit ISIC level, and the project team has mapped these
 LinkedIn industry classifications against ISIC 4 standards,
 merging industry employment and skills needs data with
 data from economic censuses, such as wage and productivity
 data, can help in understanding private sector growth and the
 productivity and human capital components that drive that
 growth.

10
TABLE 0-2:

Sample Policy Questions Using LinkedIn Metrics

 METRIC NAME SAMPLE POLICY QUESTIONS

 1) Industry employment

 Industry employment location quotient Which industries are more concentrated in my country or city than in an
 average country in the same income group?

 Industry employment growth What are the most recent employment growth trends in my country or city,
 especially in knowledge-intensive and tradable sectors?

 2) Skills

 Industry skills needs For the industries I am interested in, what are the latest, most important skills?

 Skill penetration Are particular skills (e.g. Artificial Intelligence) being applied across industries ?
 How is this changing over time?

 3) Talent migration

 Inter- and intra-country talent Am I (net) losing talent? With which countries do I compete for talent?
 migration

 Migration – industries gained and lost To which industries are these talents moving?

 Migration – skills gained and lost What skills are gained or lost in association with talent migration?

To further demonstrate how the above metrics can be used
to inform policies for World Bank projects, we provide
some sample visuals in this report. One is the top growing
and declining sectors globally in 100+ countries (figure 0-4).
Emerging sectors, such as renewables and environment and
Internet have registered rapid employment growth in the
past three years, whereas newspaper and outsourcing are in
decline in countries in all income groups. This type of insight
can be generalized across World Bank regions or specified to
a particular country as well (see Section V: Sample Visual
Outputs and Country Applications).

 11
FIGURE 0-4:

 Growth from Industry Transitions according to Income Group
h from Industry Transitions According to Income Group
 Average, 2015-2017
 Annual Average 2015-2017
ndex ISIC Section Name Industry Name High Income Upper Middle Income Lower Middle Income Low Income Avg. Growth Rate 3Yr Avg
 Mining and quarrying Mining & Metals Growth from Industry Transitions
 0.3% According to Income
 0.7% Group -0.5% 0.1% -4% 4%
 Oil & Energy -0.7%
 Annual Average, 2015-2017 -0.5% -0.7% -1.1%
 Manufacturing Aviation and Aerospace 1.5% 1.2% 0.1% -1.4%
 ISIC Section Index ISIC Section Name Industry Name High Income Upper Middle Income Lower Middle Income Low Income Avg. Growth Rate 3Yr Avg
 Renewables and Environment
 B Mining and quarrying 1.4% & Metals
 Mining 1.5% 0.3% 1.4% 0.7% -0.5% 2.0% 0.1% -4% 4%
 Pharmaceuticals 1.2%
 Oil & Energy 0.6% -0.7% 0.2% -0.5% -0.5% -0.7% -1.1%
 C Manufacturing Aviation and Aerospace 1.5% 1.2% 0.1% -1.4%
 Automotive 1.0% 0.0% 0.0% -0.5%
 Renewables and Environment 1.4% 1.5% 1.4% 2.0%
 Industrial Automation 1.0% -0.6% -0.6%
 Pharmaceuticals 1.2% 0.6% 0.2% -0.5%
 Packaging and Containers 1.0%
 Automotive 1.0% 1.0% 0.4% 0.0% 0.0% -0.5%
 Glass Ceramics and Concrete 0.8%
 Industrial Automation 0.1% -1.4%
 1.0% -0.6% -0.6%

 Chemicals Packaging and Containers
 0.8% 1.1% 1.0% 0.0% 1.0% 0.5% 0.4%
 Glass Ceramics and Concrete 0.8% 0.1% -1.4%
 Plastics 0.7% 0.6% 0.5%
 Chemicals 0.8% 1.1% 0.0% 0.5%
 Machinery 0.6%
 Plastics -0.4% 0.7% 0.0% 0.6% -0.4% 0.5%
 Paper & Forest Products 0.4%
 Machinery -0.2% 0.6% 0.8%-0.4% 0.0% -0.4%

 Shipbuilding Paper & Forest Products
 0.4% -0.3% 0.4%
 -1.9% -0.2% 0.8%
 Shipbuilding 0.4% -0.3% -1.9%
 Food Production 0.1% 0.1% 0.2% 0.2%
 Food Production 0.1% 0.1% 0.2% 0.2%
 Electrical and Electronic Manufacturing 0.0% -0.2%
 Electrical and Electronic Manufacturing 0.0% 0.0% -0.2% -0.2% 0.0% -0.2%
 Textiles 0.0% Textiles -0.2% 0.0% -0.2% -0.2% -0.2%

 Railroad Manufacture 0.0% Railroad Manufacture -2.5% 0.0% -2.5% 3.1% 3.1%
 Printing -0.1% -0.2% -0.1%
 Printing -0.1% -0.2% -0.1%
 J Information and Computer and Network Security 3.9% 0.9% -0.7% 0.3%
 Information and Computer and Network Security communication Internet 3.9% 0.9% -0.7%
 3.1% 1.4% 0.3% 1.0% -0.1%
 communication Internet 3.1%Software
 Computer 1.4% 1.8% 1.0% 0.9% -0.1% -0.4% -0.4%

 Computer Software Computer
 1.8% Games 0.9% 1.3%-0.4% -1.3% -0.4%-1.7%
 Wireless 1.2% -1.0% -1.3%
 Computer Games 1.3% -1.3% -1.7%
 Information Technology and Services 0.5% -0.2% -0.5% -0.5%
 Wireless 1.2% and Editing
 Writing -1.0% -1.3%
 0.5% 0.2% 0.6%
 Information Technology and Services 0.5%
 Computer Networking -0.2% 0.2% -0.5% -0.2% -0.5% -0.9%
 Writing and Editing Online Media
 0.5% 0.2% 0.2% 0.6% 0.8% 0.1%
 Motion Pictures and Film -0.1% -0.5% 0.7%
 Computer Networking 0.2% -0.2% -0.9%
 Semiconductors -0.3% -1.1% -2.9%
 Online Media 0.2%
 Computer Hardware 0.8% -0.5% 0.1%-1.4% -0.6%
 Motion Pictures and Film -0.1% Media Production -0.5% -0.5% 0.7%-0.9% -0.3% -0.3%

 Semiconductors -0.3% Broadcast Media -1.1% -0.5% -2.9% -0.6% -0.8% 0.0%
 Telecommunications -1.0% -1.2% -0.8% -0.5%
 Computer Hardware -0.5% -1.4% -0.6%
 Publishing -1.2% -1.7% -0.7% -0.3%
 Media Production -0.5% Newspapers -0.9% -2.4% -0.3% -2.6% -0.3%-1.8%
 Broadcast Media K Financial and-0.5%
 insurance Venture Capital and Private -0.6%
 Equity -0.8%
 4.0% 2.0% 0.0% 3.2%
 activities Investment Management -1.2% 2.7% 0.8% 1.8% 1.4%
 Telecommunications -1.0% -0.8% -0.5%
 Capital Markets 1.6% 1.3% 0.2%
 Publishing -1.2% -1.7% -0.7% -0.3%
 Financial Services 1.2% 0.4% 0.8% 0.7%
 Newspapers -2.4% Insurance
 -2.6% -1.8%
 0.9% 0.1% 0.3% -0.3%
 Financial and insurance Venture Capital and Private Equity Banking 4.0% 2.0% 0.3% 3.2%
 -0.3% -0.1% 0.3%
 activities Investment
 2.7% Banking 0.8% -0.1% -0.1%
 1.8% 1.4%0.3%
 Investment Management
 M Professional scientific Biotechnology 2.4% 1.2% 0.0%
 Capital Markets 1.6% 1.3% 0.2%
 and technical activities Alternative Dispute Resolution 1.9%
 Financial Services 1.2% Office
 Executive 0.4% 1.6% 0.8% 1.0% 0.7%
 -0.1%
 Insurance 0.9%
 Management Consulting 0.1% 0.9% 0.3% 0.2% -0.3% 0.3% 0.3%

 Banking Information Services
 0.3% -0.3% 0.8% -0.1% -0.2% 0.3% 0.5%
 Veterinary 0.7% -0.2% -1.1%
 Investment Banking -0.1% -0.1% 0.3%
 Translation and Localization 0.7% -0.4% 0.2%
 Professional scientific Biotechnology 2.4% Training & Coaching
 Professional 1.2% 0.7% 0.0% 0.1% -0.3% -0.1%
 and technical activities Alternative Dispute Resolution 1.9%
 Environmental Services 0.6% -0.1% 0.4% 0.1%

 Executive Office Design
 1.6% 1.0% 0.6% -0.1% -0.5% -0.1% -0.9%
 Nanotechnology 0.3% -1.5%
 Management Consulting 0.9% 0.2% 0.3% 0.3%
 Photography 0.3% 0.4% 0.2%
 Information Services Marketing and Advertising -0.2%
 0.8% 0.3% 0.5% -0.3% 0.0% 0.5%
 Veterinary 0.7%
 Architecture & Planning -0.2% 0.3%-1.1% -0.7% -0.1% 0.7%

 Translation and Localization Legal Services
 0.7% -0.4% 0.3% 0.2% -0.3% 0.1% 0.2%
 Graphic Design 0.2% -0.3% 0.2% -0.3%
 Professional Training & Coaching 0.7% 0.1% -0.3% -0.1%
 Mechanical or Industrial Engineering 0.2% -0.1% -0.6% -0.2%
 Environmental Services 0.6%
 Law Practice -0.1% -0.2% 0.4% -0.3% 0.1%
 -0.2% -0.3%
 Design 0.6%
 Events Services -0.5% -0.8% -0.1% -0.6% -0.9% -0.6%

 Nanotechnology Accounting
 0.3% -1.5% -1.0% -2.0% -1.7% -1.1%
 Public Relations and Communications -1.0% -1.5% 0.2% -0.8%
 Photography 0.3% 0.4% 0.2%
 Research -1.1% -0.9% -1.2% -1.2%
 Marketing and Advertising 0.3%
 Market Research -0.3% -2.4% 0.0%
 -2.1% 0.5%
 -1.2% -1.7%
 Architecture & Planning 0.3%
 Outsourcing/Offshoring -0.7% -3.6% -0.1% -1.6% -2.1% 0.7% -1.3%

 Legal Services R Arts, entertainment and 0.3%
 Gambling & Casinos -0.3% 2.1% 0.1% -0.6% 0.2% 1.9%
 recreation Animation 1.8% 1.3% 0.9%
 Graphic Design 0.2% -0.3% 0.2% -0.3%
 Health Wellness and Fitness 1.1% 0.3% 0.3% 0.5%
 Mechanical or Industrial Engineering 0.2%
 Arts and Crafts -0.1% 0.4% -0.6% 0.1% -0.2% 0.4%
 Law Practice -0.2% Fine Art -0.3% 0.3% -0.2% -0.6% -0.3% 0.2%

 Events Services -0.8% Sports -0.6% 0.3% -0.6% 0.0% 0.5%
 Libraries 0.0% 0.9% -1.0%
 Accounting -1.0% -2.0% -1.7% -1.1%
 Entertainment 0.0% -1.3% 0.4% -0.3%
 Public Relations and Communications -1.0% Music -1.5% 0.0% 0.2% -0.1% -0.8% -0.1%
 Research -1.1% Museums and Institutions -0.9% -0.7% -1.2% -1.1% -1.2% 0.8%
 Market Research -2.4% Performing Arts -2.1% -0.8% -1.2% -0.2% -1.7% -1.1%

 Outsourcing/Offshoring -3.6% -1.6% -5% 0% -2.1%5% -5% 0% 5% -1.3% -5% 0% 5% -5% 0% 5%

 Arts, entertainment and Gambling & Casinos 2.1%
 Average of Growth Rate 3Yr Avg for each Industry Name broken down by Wb -0.6%
 Income vs. ISIC Section Index and ISIC Section Name. Color1.9%
 shows average of Growth Rate 3Yr Avg. The marks are labeled by average of Growth Rate
 recreation Note: Industries where
 Animation N
Another value that the LinkedIn metrics add is in the The current round of technological advancement (aka
emerging skills and industries that official statistics often Industry 4.0) seems more pervasive than the previous
do not capture. LinkedIn’s skill metrics allow the World Bank rounds and is being transmitted to developing countries
Group to measure how new technologies—such as artificial more quickly. Around the globe, disruptive technology skills
intelligence—are spreading across industries and changing have appeared in many developing countries in the past three
labor markets around the globe. For example, artificial years, although typically “human” skills (e.g., those related to
intelligence skills are among the fastest-growing skills on sociobehavioral characteristics, interpersonal communication,
LinkedIn, with a 190% increase from 2015 to 2017 across all and cognitive skills) are also on the rise (figure 0-6).
industries (figure 0-5).

FIGURE 0-5: Software & IT Services
 Education
Global Artificial Hardware & Networking

Intelligence Skill Finance
 Manufacturing

Penetration Consumer Goods
 Health Care
2015-2017 Corporate Services
 Entertainment
 Media & Communications
 Design
 Retail
 Nonprofit
 Wellness & Fitness
 Energy & Mining
 Recreation & Travel
 Public Administration
 Real Estate
 Transport & Logistics
 Public Safety
 Legal
 Construction
 2017
 Arts
 2016
 Agriculture 2015

 0.00 0.02 0.04 0.06 0.08 0.10
Source: Authors’ calculation using LinkedIn data. Skill Penetration

FIGURE 0-6:

Skills with the Largest Increase in Penetration Across Industries
2015-2017
1. Leadership 6. Digital Literacy
2. Development Tools 7. People Management
3. Oral Communication 8. Data Science
4. Web Development 9. Graphic Design
5. Business Management 10. People Management

Source: Authors’ calculation using LinkedIn data.

 13
Near-real-time global talent migration trends can also be All the visuals will be automated and updated annually3
 captured through LinkedIn data to allow developing until June 2020 under this three-year WBG-LinkedIn
 country policy-makers to assess the health of their partnership on linkedindata.worldbank.org. The underlying
 countries’ talent pipelines. The Middle East and North Africa, dataset, as well as other resources that are helpful for policy-
 Latin America and the Caribbean, and South Asia have seen makers around the world, will also be updated and made
 the greatest talent loss in recent years, whereas Organization available for free at the same URL as a public good.4 Subject
 for Economic Cooperation and Development (OECD) countries to demand and user feedback, more metrics may be added
 such as Australia, New Zealand, and Canada are attracting later.
 the most talent (figure 0-7).

 FIGURE 0-7:

 Global Talent Migration 2015-2017

 Avg. Net Per 10000
 25.7 -109.2 292.2

 -8.1
 -24.1
 39.6
 15.4 Source: Authors’ calculation using LinkedIn data.
 38.0 1.3 -28.0
 292.2 -28.4-76.8 -7.6
 9.4
 -12.0
 7.3 -50.3 -20.7
 -13.1 -25.4
 -60.5 -41.9 0.9 -4.4
 1.8
 -25.1 45.4
 -19.6 -19.6 -34.8 -35.2 -15.5
 56.7 153.9 -25.8 59.7 -5.4
 37.2
9 -39.7 -21.9
 22.0
 -21.5
 -1.8 13.8 -17.9
 -12.3 -11.1
 40.7 9.0
 73.2
 3 There
 25.5 will be a minimum of an annual refresh by LinkedIn. The online visuals can be updated more frequently if there is strong user demand
 25.44 The
 60.2aggregated datasets and visuals are available to all for the public good under the Creative Commons Attribution 3.0 IGO license with attribution to both
 69.8
 LinkedIn4.8
 Corporation and the World Bank Group. The World Bank Group and LinkedIn Corporation (including its affiliates) do not take responsibility and are
 16.0 -3.3
 not liable for any damage caused through use of data and insights through this website, including any indirect, special, incidental or consequential damages.

 10.0

 14
I. Introduction

The objectives of this methodology report are to document companies with their own proprietary job posting data that
LinkedIn data characteristics worldwide in terms of age, sex, have acquired external economic research arms or created
industry, and skills distribution; the methodology and inhouse research teams to analyze the data. In other cases,
assumptions that go into developing the LinkedIn datasets private firms share data with international organizations to
that LinkedIn Corporation shares with the World Bank Group analyze job postings, such as a recent World Bank report on
and our best attempt to compare these LinkedIn metrics with job postings in India (Nomura et al. 2018).
other government administrative and survey data; and
sample analytical and visual examples using these metrics to The richness of LinkedIn data, which cover a range of topics
answer policy questions related to industry growth, skills from skills to migration and are available on a granular level,
gaps, and talent attraction and retention. arguably exceeds that of data from the above projects.
 Furthermore, the initiatives mentioned above have relied
 almost solely on job posting data, whereas LinkedIn takes
A. USING ONLINE DATA FOR POLICY advantage of detailed member profiles in addition to job
RESEARCH postings and hires. A 2016 RTI International publication
 discusses the above projects and defines general limitations
There has been considerable research interest in the use of of labor market information according to timeliness of data,
web-based data for economic analysis in recent years accuracy of surveys and questionnaires, capacity to conduct
(Antenucci et al. 2014; Askitas and Zimmermann 2009, 2015; analysis, integration of various data sources, use by nongov-
Chancellor and Counts 2018; Kuhn and Mansour 2014; ernment agencies (accessibility to data), and cost of acquiring
Guerrero and Lopez, 2017; Tambe 2014). In particular the data (Johnson 2016). The LinkedIn data and the joint
reports by Tambe (2014) and Antenucci et al. (2014) consider WBG-LinkedIn collaboration address each of these limita-
labor markets and how online data-driven research may tions. As will be discussed in detail in this report, LinkedIn
facilitate policy-making and correlate with “on-the-ground” data allow for near-real-time updates. Furthermore, LinkedIn
indicators. In general, research in this field has been focusing facilitates comparisons between countries (or cities or
on extracting a limited number of metrics in selected regions) by having a single data structure and taxonomy.
countries to answer specific research questions. This Finally, the aim of the collaboration is to offer a public good in
WBG-LinkedIn dashboard and the underlying dataset cover the form of a transparent, publicly accessible dashboard
hundreds of locations worldwide and allow for benchmarking presenting insights in addition to the underlying datasets.
for policy-makers.
 The rising use of online data to answer far-ranging societal
Data projects of this nature are often referred to as labor questions in a wide array of disciplines not only comes with
market information based, and their value depends heavily on tremendous insights (Boyd and Crawford, 2012), but also
the type and availability of the data. A handful of private marks a shift in quantitative and qualitative analysis. Tufekci
companies and organizations have pursued ambitious (2014) describes this shift and calls for a close inspection of
domestic and limited global projects, primarily from the U.S. this dramatic change in how we analyze data and the
perspective. Groups pursuing these projects, including methodologies and interpretations and interpretations we
Burning Glass, Wanted Analytics, Glassdoor, and Career use. That report primarily addresses concerns about bias
Builder, rely unsurprisingly often on web-based data. These found in online data from a single social network or platform
organizations primarily aggregate various sources of online (e.g., Twitter). Similarly, when using LinkedIn data, with one
data on employment. Glassdoor and Career Builder are online structure and platform used to derive insights, one must

 15
openly address and measure the inherent bias found in the
 B. QUALITY CONTROL AND LIMITATIONS
user base and interaction between users and the platform.
 OF LINKEDIN DATA
Other research on the use of online data calls into question
the use of traditional statistical techniques, in which
 Before analyzing bias, we impose a number of basic rules on
statistical significance (for example) may be inapplicable to
 the data. First, spam and other inactive profiles are removed
the huge datasets that are built using online data (Gandomi
 from the sample so that it includes only active LinkedIn
et al. 2015). The authors address concerns about data
 members.5 Second, each dataset is filtered to display an
heterogeneity, noise accumulation, and spurious correlation.
 aggregated number with at least 50 observations per the
LinkedIn metrics and validation exercises presented in this
 most granular data-point. For example, for a given skill in a
report occur at country aggregate levels. Thus, although
 given industry and city to be displayed in the dataset, at least
concerns about excessively large samples for correlation
 50 members must have reported the skill in their LinkedIn
(dimensionality) are not major concerns, attention should be
 profile. This rule is consistent across all datasets and is
paid to concerns about heterogeneity arising from many
 imposed to ensure the accuracy and privacy of user data.
individual members and noise accumulation. Another report
 Such procedures are increasingly important in online data and
on the use of online data for health care warns of identifying
 are referred to as “data forensics” in a report on use of online
patterns where none exist because of the complex nature of
 data in economics (Horton et al. 2015). In the industry
data connections (European Commission Directorate General
 employment-related metrics, instead of using a member’s
for Health and Consumers 2014).
 self-reported industry, we use the company that the member
 worked for and the industry that the company reported that
LinkedIn data meet the online data description above and
 it belonged to on LinkedIn. This dramatically shrinks the
exceed it on a variety of levels. LinkedIn data not only allow
 sample size because not every company has a profile on
for comparison of diverse geographic regions (100+ countries
 LinkedIn and reports which industry it belongs to. Nonethe-
and hundreds of cities) in the form of one unified structure
 less, using this filter helps increase the accuracy of industry
and comparable data points, but are also updated in real time
 employment data because members can have different
by members. The importance of frequently updated data is
 understandings of which industry the company is in based on
emphasized in a report by Aslett and Abott (2018) stating
 their position, experience, and daily work routine.
that the “time value of data is a significant driver for Perva-
sive Intelligence.” In this sense, LinkedIn offers an unconven-
 After these rules are imposed, the remaining sources of bias
tional source of labor market data in that it describes the
 and limitations of LinkedIn data come from different LinkedIn
latest employment and skills trends as motivated by
 usage and uptake in different countries, industry bias, and
real-time observations of labor market outcomes and user
 occupation bias. The first bias—regarding differences in
behavior. More precisely, all data are provided voluntarily and
 LinkedIn usage—is generally addressed by normalizing
from the perspective of what the labor force views as most
 against total country LinkedIn membership or other totals or
relevant. As with all data collection methodologies, various
 averages. Nonetheless, varied usage patterns may take other
questions arise. Can user-generated inputs be trusted? Can
 forms, such as differences in propensity to include skills or
they be aggregated in a meaningful way? Can a relevant and
 share work experience between cultures and regions6 see
applicable economic message be derived from the noise?
 section II-C. Finally, the third bias regarding occupations adds
Although unique, are LinkedIn insights in line with trusted
 an additional layer to the two previously discussed. Given a
measures of the labor market? These are important ques-
 defined industry bias, the type of occupation most represent-
tions, vital for identifying where LinkedIn data can be most
 ed on LinkedIn in each industry in a country may be biased
valuable and how they should be positioned to have the
 itself. Occupational bias on LinkedIn drives some industry
greatest effect on policy decisions. It is the purpose of this
 bias, when, for example, an industry such as financial services
report to address these unknowns and to better understand
 is composed mostly of white collar managers and analysts—
the data strengths and limitations, hence informing interpre-
 occupations that are well represented on LinkedIn—whereas
tation of results.
 in the agriculture sector, managers, analysts, and economists
 make up a smaller portion of the occupational pool, resulting

5 Individuals who had logged in within the past 12 months and had the basic section filled out, such as skills, work history, and education.
6 To decrease bias due to different usage patterns in different countries, especially if certain cultures, race, or sexes tend to over- or underreport their job
 duties and experience, we include standardized taxonomy on job titles and skills, school and degree names, and company-reported industries for this
 dataset instead of trying to infer members’ work and education experience from their profiles’ detailed descriptions.

16
in low LinkedIn representation of this sector (on average) and In sum, LinkedIn is self-reported and subject to typical
capturing only a segment of the workforce in the sector. A challenges with this type of data: it is a nonrandom sample of
strength emerges in that LinkedIn offers strong representa- LinkedIn members (people familiar with the Internet who
tion in various industries for given occupations, for example, have basic digital literacy will be more likely to use LinkedIn);
ICT workers working in various industries, not just in the people who want to network and promote themselves
information and technology industry.7 professionally are more likely to have a LinkedIn profile and
 keep the profile updated; those who have just lost their jobs
An additional dimension of bias regards skills and how are unlikely to update their LinkedIn profile saying they are
information on them is extracted from member profiles on unemployed; and members might inflate their skills or
LinkedIn. This analysis uses only self-reported skills data, and present them differently in different cultures and sexes (e.g.,
these skills listed in profiles are included because the women tend to have shorter job descriptions). We deployed
member wants to be considered for a certain position. This different strategies to address these problems when deriving
raises a question of when skills are added, because members the methodology for metrics from LinkedIn’s raw data, and
may include skills during initial completion of their profile and we show the advantages and disadvantages of each
fail to update them as they move to different locations and methodology and explain why we chose one over another. It
positions. Finally, a user may have multiple skills, so mea- is important that researchers keep in mind these limitations
sures must be given as relative values, and the number of when they interpret results using LinkedIn data.
total skills (including skills in a given skill category) may not be
representative of a given number of individuals, because
individuals can list multiple skills.

7 These relationships should be regarded as hypothetical until a systematic validation of occupations is conducted in future research.

 17
You can also read