World Transport Policy and Practice Volume 19.1 February 2013 - ECO-LOGICA LA1 LTD ISSN 1352-7614
←
→
Page content transcription
If your browser does not render page correctly, please read the page content below
World Transport Policy
    and Practice
    Volume 19.1
   February 2013

         ECO-LOGICA LA1 LTD ISSN 1352-7614
© 2012 ECO-LOGICA LA1 LTD              FRANCIS ERIC KNIGHT BRITTON
                                       MANAGING DIRECTOR/EDITOR
PROFESSOR JOHN WHITELEGG               ECOPLAN. INTERNATIONAL/WORLD STREETS
STOCKHOLM ENVIRONMENT INSTITUTE AT     69003 LYON FRANCE
YORK,                                  T. +336 5088 0787 / S. NEWMOBILITY
UNIVERSITY OF YORK,                    E. eric.britton@ecoplan.org
YORK,
YO10 5DD, U.K                          PAUL TRANTER
                                       SCHOOL OF PHYSICAL ENVIRONMENTAL &
EDITORIAL BOARD                        MATHEMATICAL SCIENCES,
                                       UNIVERSITY OF NEW SOUTH WALES,
PROFESSOR HELMUT HOLZAPFEL             AUSTRALIAN DEFENCE FORCE ACADEMY
UNIVERSITÄT KASSEL,                    CANBERRA ACT 2600, AUSTRALIA
FACHBEREICH 06 - ARCHITEKTUR, STADT-
UND LANDSCHAFTSPLANUNG                 PUBLISHER
AG INTEGRIERTE VERKEHRSPLANUN-         ECO-LOGICA LA1 LTD., 53 DERWENT ROAD,
GOTTSCHALKSTRAßE 28,                   LANCASTER,LA1 3ES, U.K.
D-34127 KASSEL GERMANY                 TELEPHONE +44 (0)1524 63175
                                       E-MAIL: johnwhitelegg@phonecoop.coop
                                       HTTP://WWW.ECO-LOGICA.CO.UK

CONTENTS

											                                                         Page

Front Cover Picture: We are grateful to Stan Parrot who took        1
the photographs and to “Transport Solutions for Lancaster
and Morecambe” (TSLM) for permission to use the photos
of the otters threatened by the route of the Heysham M6
Link Road in Lancaster, UK.

Editorial										                                                 3

Abstracts and Keywords							                                       6

Road congestion, vehicles emissions and the intention to
use public bus services in Malaysia – A flexible bus
utility model
Serena A. G. Kang, K. Jayaraman, Keng Lin Soh			                    8

Governance and Ecological Sustainability: the case of
transport funding in New Zealand
Dr Stephen Knight-Lenihan							                                    25

Bürgerbus - German experiences in community transport
Martin Schiefelbusch							                                         35

A Swedish Bicycle Plan
Tomas Björnsson									                                            45

2                                            World Transport Policy and Practice
                                                         Volume 19.1 Feb 2013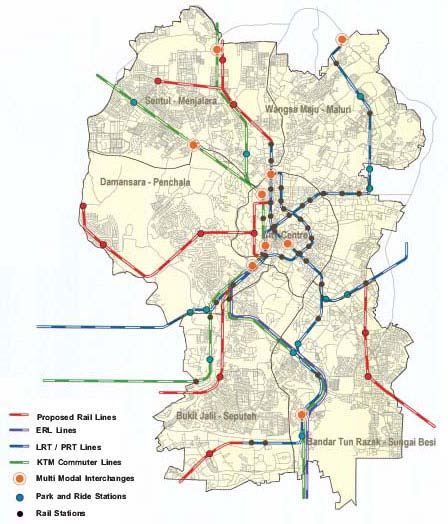
EDITORIAL
                                                      The inner (green) shaded nonagon repre-
Planetary Boundaries                                  sents the safe operating space with pro-
                                                      posed boundary levels at its outer contour.
This is an unusual editorial. It is entire-           The extent of the wedges for each bound-
ly concerned with one book published in               ary shows the estimate of current position
2012 called “The Human Quest” (Note 1).               of the control variable. Points show the
To say this book is important is an under-            estimated recent time trajectory (1950–
statement. It is hugely important because             present) of each control variable. For biodi-
it shows that the current trajectory of the           versity loss, the estimated current bound-
human species on this planet is on auto-              ary level of >100 extinctions per million
matic pilot with the self-destruct option             species-years exceeds the space available
initiated. This may sound rather dramatic             in the figure. Although climate change,
but the book is based on a very traditional           ocean acidification, stratospheric ozone
scientific analysis and a strong evidence             depletion, land-use change, freshwater
based logic rooted in the best scientific             use, and interference with the phosphorus
tradition and especially Swedish scientific           cycle are boundaries defined as the state
traditions. It is a solid, objective, scien-          of a variable (concentration of atmospheric
tific analysis. The book shows that there             CO2, aragonite saturation state, and strat-
are “planetary boundaries” that should not            ospheric ozone concentration, percentage
be crossed and we have now crossed 3 of               of land under crops, maximum amount
them and are in danger of crossing the re-            of global annual freshwater use, cumu-
mainder. The planetary boundaries are il-             lative P loading in oceans, respectively),
lustrated in Figure 1                                 the remaining boundary, biodiversity loss,

Figure 1: Planetary Boundaries
Source:http://www.ecologyandsociety.org/vol14/iss2/art32/figure6.html
3                                                             World Transport Policy and Practice
                                                                          Volume 19.1 Feb 2013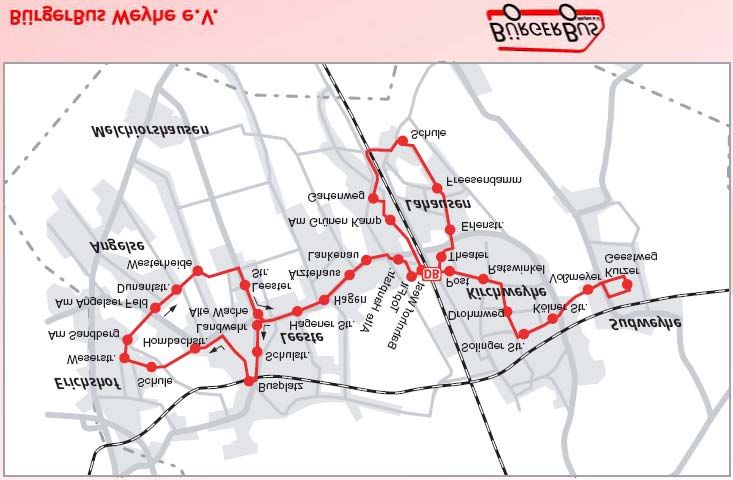
and the component of the biogeochemical        The key messages are:
boundary related to the human interfer-        •       We are the first generation to rec-
ence with the N cycle are defined by rates     ognize that humanity has become a force
of change for each respective control vari-    capable of undermining Earth’s capacity to
able (extinctions per million species per      support our prosperity.
year, rate of N2 removed from atmosphere       •       We live in a globalized phase of en-
for human use).                                vironmental change. Our economies and
                                               the world as we know it is at risk of under-
The planetary boundaries that we have al-      going major changes.
ready crossed are flagged in red and are       •       We live in an interconnected world.
climate change, biodiversity loss and ni-      The stability of the Earth system and its
trogen cycle excesses. We await further        long-term capacity to support our wellbe-
analysis and information on the other          ing has become every nation’s and citi-
boundaries and the rate at which we ap-        zen’s concern. We must all manage the
proach crossing the boundary and the ir-       biosphere as a world community.
reversible damage associated with this         •       If we keep Earth within the safe op-
crossing.                                      erating space of these planetary bounda-
                                               ries, we can all thrive. But if we push these
The publicity accompanying the book em-        scientifically drawn boundaries, we will
phasises the science and the need for ur-      trigger catastrophic events.
gent action:                                   •       Our Human Quest is to change the
                                               trajectory of negative global environmen-
    The Human Quest combines evidence          tal change to support development, as hu-
    from the many scientific disciplines       manity moves toward a population of nine
    that reveal how planet Earth operates      billion people.
    and the tenuous relations between the
    Earth system and humans. Rockström         What has this got to do with
    and Klum not only diagnose the prob-       transport?
    lems, but also look at the opportunities
    and evidence supporting the transition     We are now approaching the 20th anniver-
    to a sustainable future.                   sary of the journal “World Transport Policy
                                               and Practice”. In these 20 years we have
    “We need to find ways to ‘turn’ these      tracked the enormous damage on people,
    curves away from such global risks,”       communities, ecology and the planet that
    says Rockström, “and we need to do it      are directly related to increasing levels of
    now, in what may be the most decisive      automobile dependency, distances trav-
    decade in human history. This book is      elled, aviation and road freight. We have
    about deepening the insights of our so-    published approximately 300 articles and
    cial-ecological predicament as a source    the majority of these articles have mapped
    of hope and innovation. We need noth-      out practical, implementable strategies
    ing less than a great transformation of    and proposals to deliver a sustainable
    societies in the world, and I believe it   future and to make sure that we do not
    is possible.”                              (in this one sector) transgress planetary
                                               boundaries. Transport is a core problem
    The book highlights that action needs      in any discussion of planetary boundaries
    to be taken now.. in what may be the       because the global trajectory is entirely
    most crucial decade in human history.      in the wrong direction and every coun-
    With a fundamental shift in mindset,       try on the planet (including Sweden) has
    humanity can succeed in a transition to    strongly embedded cultural, professional
    global sustainability. The Human Quest     and fiscal biases towards year on year
    can help turn the page to that new par-    increases in vehicle kilometres travelled,
    adigm.”                                    air miles used and billions of dollars and
                                               Euros spent on investments in new infra-
                                               structure. We have made it clear in almost
                                               every issue of the journal that transport
                                               policy everywhere has a deeply embedded
                                               strand of DNA that delivers more travel,
4                                                      World Transport Policy and Practice
                                                                    Volume 19.1 Feb 2013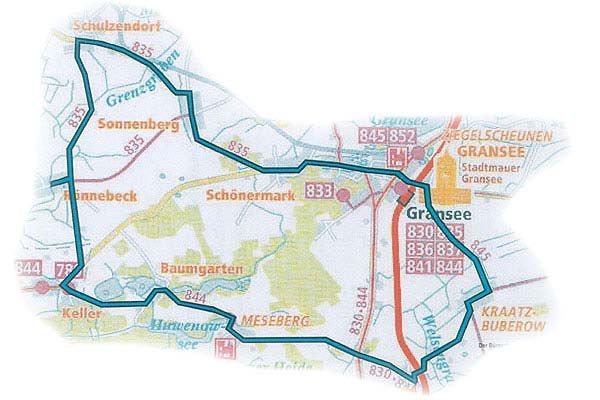
more roads, more airports and more high         it is sometimes difficult to grasp what is
speed rail and is motivated by a strong         going on beyond stories of pandas, polar
sense that more is better than less, faster     bears and rare orchids but in Lancaster
is better than slower and human progress        all levels of government have conspired
depends absolutely on higher levels of mo-      to reduce biodiversity by ignoring the ot-
bility. We think that this is a fundamental     ters and contributing to habitat loss and
error. More importantly still we provide a      their demise. If we scale this up to all the
different perspective and solutions that are    highway plans and high speed rail plans in
ready to go on a Monday morning when            China, India and Africa we can see where
politicians and decision makers turn up at      the big red transgressing wedge labelled
work and ask “what shall we do today”.          “biodiversity” comes from.

We do not say that transport issues are the     In this issue of WTPP we once again fo-
biggest issues that have to be addressed        cus on intelligent solutions to future trans-
on the planet (hunger, poverty, war, dis-       port that have the potential to shift us into
ease, torture, violence and rape are also       a way of thinking and doing that avoids
abominations). However if we really want        transgressing planetary boundaries. To-
to advance towards a sustainable future         mas Björnsson draws attention to the ur-
we do say that the transport debate is still    gent need for improved cycling facilities in
in very poor shape with little understand-      southern Sweden that cost a small frac-
ing of the need to sort out our relationship    tion of what is spent on highways. Martin
with mobility, speed and distance if we are     Schiefelbusch shows how rural transport
to achieve other declared policy objec-         problems can be solved by community
tives. Put very crudely we have no chance       transport initiatives.     Stephen Knight-
whatsoever of altering paradigms or de-         Lenihan reveals the extent to which de-
velopment trajectories related to planetary     sirable sustainability objectives can be
boundaries if we do not sort out transport.     undermined by a lack of will at national
Even more worryingly those who alert us         level. His account of the situation in New
to planetary boundary trajectories and          Zealand will resonate strongly with the
consequences do not have a lot to offer         situation in many other countries. The ar-
on the Monday morning question. How do          ticle by Serena Kang describes a “flexible
we deliver a new transport future, how do       bus utility model” that has the potential
we restructure space and time to reduce         to more closely match the supply of bus
vehicle numbers and distances travelled         services with the demand for those serv-
by vehicles by at least 50%? How do we          ices and thereby increase levels of use of
reallocate transport spending to produce        public transport.
a better quality of life for everyone and
thereby terminate the building of expen-        As always we welcome feedback on these
sive new transport infrastructure and cre-      articles and on our editorial comment.
ate a socially and ecologically just society?
This is a problem for planetary bounda-         Professor John Whitelegg
ries especially the climate change and          Editor
biodiversity boundaries. We are drown-
ing in high quality analyses of the impact      Note 1:
of transport on greenhouse gas emissions        The book can be accessed from this site:
and the impact of transport infrastructure      http://thehumanquest.org/
and fossil fuel exploitation on biodiver-       There is also an article describing the
sity. Even in the small city of Lancaster       planetary boundaries research and this is
in NW England a totally useless road, un-       available here:
der 5kms in length, costing £120 million is     http://www.ecologyandsociety.org/vol14/iss2/art32/
making its way through funding and deci-
sion making procedures towards delivery.        Note 2:
Amongst many large, negative impacts            http://www.lancasterguardian.co.uk/news/lancas-
                                                ter-and-district-news/tv-star-backs-m6-link-ot-
of this road scheme is the damage it will
                                                ters-1-5133129
do to an otter colony on the River Lune
(Note 2 and the cover picture on this is-       http://www.lancasterguardian.co.uk/news/business/
sue). Biodiversity is such a big issue that     m6-link-otters-hitch-1-5063345
5                                                       World Transport Policy and Practice
                                                                    Volume 19.1 Feb 2013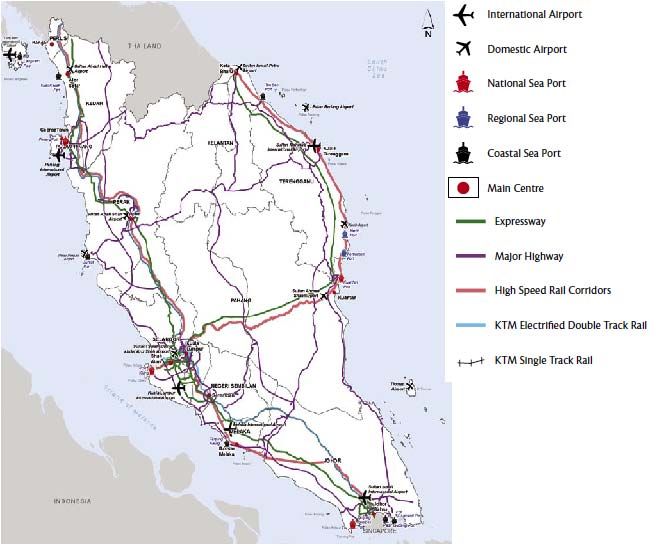
ABSTRACTS AND KEYWORDS
Road congestion, vehicles emissions             to ensuring environmental sustainability
and the intention to use public bus             have been compromised by central gov-
services in Malaysia – A flexible bus           ernment’s narrowing interpretation of the
utility model                                   law. This paper explores the difficulty of
                                                embedding sound sustainability principles
Serena A. G. Kang, K. Jayaraman, Keng           in a democracy lacking strong mechanisms
Lin Soh                                         for holding the executive to account, and
                                                suggestions are made as to how to over-
Abstract:                                       come this.
The unreliable public transport services        Keywords: ecological assessment, sus-
of the world have caused dissatisfaction        tainability, legislation, transport
among its commuters. In Malaysia, despite
the hefty government subsidy, only 16%          Bürgerbus - German experiences in
of all commuters use the public transport       community transport
(Government’s Performance Management
and Delivery Unit, 2011). The increase in       Martin Schiefelbusch
the use of private vehicles has caused road
congestion and air pollution. The harmful       Abstract:
pollutants from vehicular emission signifi-     The paper presents the concept of “Bürger-
cantly impact human health and chronic          bus”, the main form of voluntary-based
diseases. This conceptual paper draws           community transport in Germany. It sums
upon literature in service marketing, con-      up the history of the concept, but is mainly
sumer behaviour and social cognitive the-       based on experiences made by the author
ories, and the input from the experts of a      during a three-year consultancy project in
public bus company. The paper suggests a        the German state of Rhineland-Palatinate.
flexible bus utility model that will be able    Core elements of a Bürgerbus are a mini-
to meet the variation of demand - in order      bus, which can be driven with a car li-
to fill the gaps between service expecta-       cence, the volunteer drivers, and the local
tions, perception and satisfaction of bus       knowledge and contacts they bring into
commuters - to sustain and promote rid-         the development of the service. However,
ership. The bus utility model offers a likely   the process relies also on cooperation with
solution to enhance bus ridership and re-       the local authorities, public transport pro-
duce environmental emissions caused by          viders, local businesses and other stake-
the heavy reliance on private vehicles.         holders. Various models exist to organise
The bus utility model may be customized         this “teamwork”. For a successful imple-
to benefit other developing countries with      mentation, it is essential to know and re-
similar low ridership.                          spond to the motivations and interests of
                                                the volunteers and to allow space for flex-
Key words: Car Dependence; Demand               ible solutions.
Responsive Services; Bus Utilization; Rid-      There are currently about 170 Bürgerbus
ership.                                         services in Germany. Experience shows
                                                that the development process often re-
Governance and Ecological Sustain-              quires patience and commitment from all
ability: the case of transport funding          parties involved, as the formal framework
in New Zealand                                  for public transport is not well suited to
                                                small-scale, volunteer-based concepts
Dr Stephen Knight-Lenihan                       like this. However, once started, very few
                                                schemes have closed for lack of drivers
Abstract                                        or demand. A Bürgerbus cannot replace
Since 2003 New Zealand’s transport sec-         mainline public transport, but it provides
tor has been legally required to contrib-       a low-cost way of filling gaps and catering
ute to sustainable development outcomes,        for specific needs that are otherwise dif-
including environmental sustainability. At-     ficult to capture.
tempts by the state’s funding agency to         Keywords: community transport, volint-
identify how transport could contribute         eers, public transport
6                                                      World Transport Policy and Practice
                                                                   Volume 19.1 Feb 2013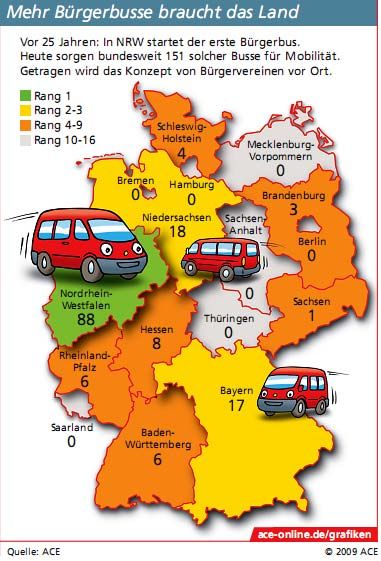
A Swedish Bicycle Plan

Tomas Björnsson

Abstract
The Swedish Society for Nature Conser-
vation has compiled a bicycle plan for the
southernmost region of Sweden. The plan
elaborates the need to build or improve
bicycle tracks between the built-up areas
in the region to facilitate commuting and
to create a complete bicycle network in
the region. A comparison with the budg-
et spent on new road construction shows
that a mere ten per cent of the current
road budget will have to be redirected to
new bicycle tracks in order to complete
this plan in ten years.
Keywords: Cycling, bicycle tracks, cli-
mate change, Sweden, mitigation, peak
car

7                                            World Transport Policy and Practice
                                                         Volume 19.1 Feb 2013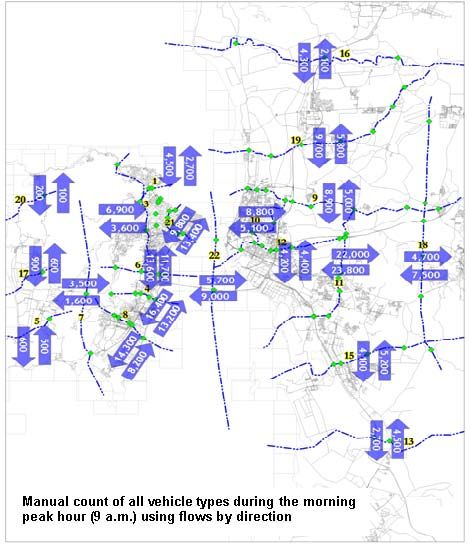
Road congestion, vehicles emissions it is aggravated by the relatively low fuel
and the intention to use public bus charges even though it has been slightly
services in Malaysia – A flexible bus revised upward lately. While restriction
utility model of car ownership is seen in its neighbour
country, Singapore, there is no such policy
Serena A. G. Kang, K. Jayaraman, Keng to dissuade car ownership in Malaysia. The
Lin Soh alarming statistics produced and published
by the Malaysian Road Transport Depart-
1. Introduction ment (RTD) shows a rise of 11% in the
The Malaysian government introduced registration of new cars and 28% of motor-
seven National Key Result Areas (NKRAs) cycles in the last six years (2005 – 2010).
for improvement between the duration of There was also a 26% increase in licenses
2009 to 2011 in an attempt to transform issued to drivers. The increase of private
the country to become a developed nation. vehicles on roads amplifies road conges-
One of the NKRAs addresses the need to tion which is already rampant in urban ar-
improve public transport infrastructure eas has created severe parking problems
and its current low ridership. While the and fatal accidents (Table 1 & Figure 1).
NKRAs introduced in the Malaysian Gov- The Road Safety Department (MIROS)
ernment Transformation Program (GTP) reported an increase of more than 50%
set the need to improve public transport of total casualties and fatality rates from
infrastructures and ridership, the latest road accidents involving private vehicles.
annual report (2011) of the Government’s A case study in the district of Klang was
Performance Management and Delivery conducted to assess the usage of private
Unit (PEMANDU) showed a modal split of vehicles and occurrence of accidents.
16:84 ratio between the ridership of public The assessment focused on motorcyclists
transport and private vehicles. The gov- killed and seriously injured (MKI) showing
ernment has committed USD11.6 billion the percentage of MKI and areas involving
to build infrastructures to fulfil the need high MKI. These areas are the residential,
for better public transport services (Min- industrial, businesses and residential ad-
istry of Finance Malaysia, 2009). In spite jacent to school or industrial places.
of the effort, the unfilled service capacity
in public transport has left a cumulative In 2006, the National Cancer Registry Ma-
loss of USD118 million after tax in the laysia registered 2.05 million cases of lung
book of ‘Prasarana’, the wholly owned and cancer, and it ranked as the second most
government linked public transport com- common cancer among the population in
pany (Syarikat Prasarana Negara Berhad, the country (Zainal et al., 2006). Lung
2009). The conjoint management between cancer has been linked to motor vehicle
Economic Planning Unit (EPU), Ministry of exhaust emissions (WHO, 2012). There-
Transport (MOT), Road Transport Depart- fore, the commonly believed negative im-
ment (RTD), Commercial Vehicles Licens- pact of vehicular emissions on health costs
ing Board (CVLB) and Prasarana in the past and potential risk leading to mortality and
contributed to multiple jurisdictions in the chronic diseases should not be ignored.
public transport industry and has led to in- The rationale of this conceptual paper to
effective coordination of public transport examine the current policy on freedom of
system in the country until the establish- vehicle ownership is therefore legitimised.
ment of Land Public Transport Commission The poor utilization of public transport has
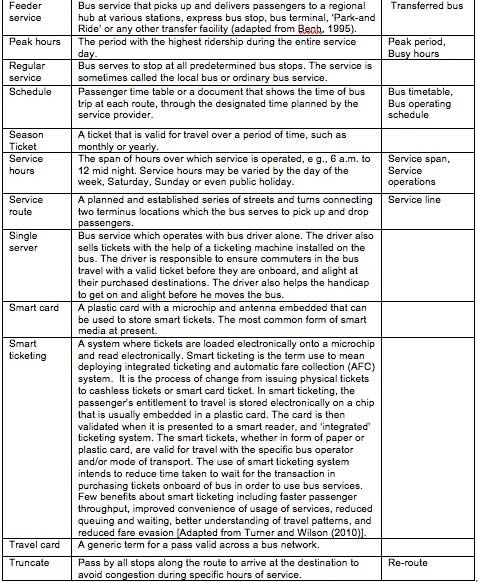
(SPAD) in 2010. Table 1: Klang District MKI, Source: MIROS, Malaysia (2009)
Area % of MKI
Besides, car own- Residential 32
ership is affordable Industrial 19
and encouraged Business and service 12
Residential adjacent to school or industrial 11
by the economic
Institutional 9
growth. The habit of
Vacant lands 9
travelling in private Agriculture 5
vehicles has been Others 3
embedded strongly
in society. This hab- Table 1: Klang District MKI, Source: MIROS, Malaysia (2009)
8 World Transport Policy and Practice
Volume 19.1 Feb 2013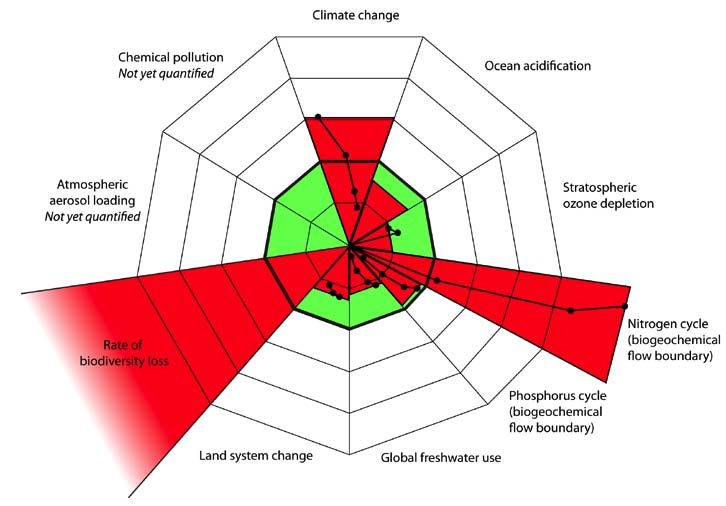
to the nearest stops/
                                                                                  stations of the public
                                                                                  transport in the ab-
                                                                                  sence of park and ride
                                                                                  facilities. The distance
                                                                                  of walking is partly
                                                                                  caused by poor town-
                                                                                  ship planning which
                                                                                  focused on buildings
                                                                                  as landscape (Sulaim-
                                                                                  an, 2010) instead of
                                                                                  transportation and its
                                                                                  connectivity with the
                                                                                  stops/stations.
Figure 1: Nationwide accidents rate involving private
vehicles
Source: MIROS, Malaysia (1995 -2010)
been speculated to be associated with neg-  2. Urban centres and the sub-sets of
ative public perception of the services and urban centres
poor cognition of clean air in the environ- The integrated national transportation
ment among citizens. Although research      network has been proposed for four con-
revealed that people desire to be driven    urbations to be developed as integrated
(Diana and Mokhtarian, 2009) when en-       regions, with emphasis on levels of impor-
countering a worsening traffic condition,   tance which take priority as growth zone
the continuous use of private vehicles as   in the country (Table 2 & Figure 2).
Table 2: Levels of conurbation, Source: Adapted from National Physical Plan of Malaysia (2010)
 Level 1    National growth conurbation       Kuala Lumpur, Putrajaya, Shah Alam, Klang, Nilai and
                                              Seremban
 Level 2  Regional growth conurbation         George Town, Johor Bahru and Kuantan
 Level 3  Intermediate (connective)           Ipoh and Melaka
          growth conurbation
 Level 4 Urban growth centres         Kota Bahru, Alor Star, Kuala Terengganu and Kangar
Table 2: Levels of conurbation, Source: Adapted from National Physical Plan of
Malaysia (2010)

                                                                               This study takes a snap-
                                                                               shot of level 1 conur-
                                                                               bation (Kuala Lumpur)
                                                                               and level 2 conurbation
                                                                               (George Town) to dis-
                                                                               cuss and understand the
                                                                               diminishing modal share
                                                                               of public transport. Al-
                                                                               though there is an in-
                                                                               crease in population in
                                                                               the regions, the decline
                                                                               in public transport rider-
Figure 2: Integrated national transportation network,                          ship (Table 3) is appar-
Source: The Federal Department of Town and Country                             ent. The declining modal
Planning, National                                                             share may be related to
Physical Plan (2010), Ministry of Housing and Local
                                                                               the increase in highway
Government, Malaysia.
a daily transport mode remains a trend.      network supply, changes in household
While people are also being driven in pub-   sizes, a rise in household incomes, afford-
lic buses, public transport companies have   ability of cars, and poor quality and unre-
not succeeded in persuading higher rider-    liability of services offered by the public
ship because of a lack of flexibility in its transport.
services. In addition, there is a need to
walk more than 400 meters from home
9                                                     World Transport Policy and Practice
                                                                  Volume 19.1 Feb 2013
transport system in urban centre of KL,
                         % of modal
           Year
                           share                     particularly
                                         Table 3: Modal             in transport
                                                        share of public providing the high capacity
           1995              34          Source: Japanlinkages     between
                                                         International        the sub
                                                                       Co-operation       sets
                                                                                     Agency     to the
                                                                                             (JICA)      ur-
                                                                                                    – Study
           1999              20          on integratedban   centre
                                                        urban        of strategies
                                                              transport  KL (Figure     3 & Figure 4). In
                                                                                   for environmental
           2008              12          improvementplaces not served by rail, public bus serv-
           2010              13                      ices will provide support as feeders to the
                                                     rail network, specifically on the routes to
Table 3: Modal share of public trans-                the centre of KL. The forming of orbital de-
port                                                 mands in the sub sets of the urban area
Source: Japan International Co-oper-                 within KL, especially to areas such as to
ation Agency (JICA) – Study on inte-                 Petaling Jaya (PJ), Damansara, Serdang,
grated urban transport strategies for
                                                     Cheras Gombak or Selayang (Figure 4),
environmental improvement
                                                     are still unexplored and these routes need
3. Travel pattern and demand                         the services of public buses. In relation
The most common transport vehicles used              to travelling within the sub sets of the ur-
for regular and short distance trips in ur-          ban area, for instance, from Shah Alam to
ban transport are motorcycles, cars and              Klang, the destinations are visibly scat-
monorails. In contrast, modes of transport           tered. Although it is lower than the radial
that cater for longer distance trips in inter-       demands compared to the centre of KL,
city transports are usually by way of cars,          this travelling requires better accessibility
taxis, chartered buses and trains. Visibly,          and good quality of public bus services.
there are rarely walking and cycling in
the country as there are no proper infra-
structures such as walkways, cycle lanes
and parking built to encourage these
activities. Similarly, pedestrian routes,
signage, crossing facilities and bridges
or subways are minimal. The dual car-
riageways were generally constructed
without off-street parking, pedestrians
are not protected from humid weather
and subject to risk of massive traffic of
the streets. The alternative modes of
transportation such as car pooling and
sharing are also not popular among the               Figure 4: Travel demand in KL,
                                                     Malaysia.
urban commuters. For instance, among
                                                     Source: adapted from SPAD (2011).
the 3 million vehicles in urban centre of
                                                     In the George Town (GT) urban centre, car-
Kuala Lumpur (KL), over 65% of these
                                                     riageways had originally been constructed
vehicles are travelling as single occupan-
                                                     along the east coast of the Penang Island
cy vehicles (Rosly, 2010). The urban rail
                                                     (Figure 5) to be linked to the north of Pe-
has been recognised as the spine of the
                                                     ninsular Malaysia. While the market and
                                                     industrial forces have further induced new
                                                     development along the east coast of the
                                                     island, there are more commuters travel-
                                                     ling to work by private vehicles (as indicat-
                                                     ed in numeric figures in Figure 6) caused
                                                     by higher employment opportunities com-
                                                     ing from the development. As a result, the
                                                     GT urban centre has a much higher traf-
                                                     fic volume. However, the improvement of
                                                     carriageways is not keeping abreast with
                                                     this development, mainly because these
                                                     dual carriageways cannot be widened de-
                                                     spite the increasing traffic volume. There-
Figure 3: Future structural plan of KL               fore public buses have to make their ways
urban centre.                                        within the narrow and congested streets in
Source: adapted from SPAD (2011).                    order to serve the riders.
10                                                           World Transport Policy and Practice
                                                                          Volume 19.1 Feb 2013
4. Government subsidies in public
transport
By the beginning of April 2010, the Malay-
sian government has expended USD550
million in infrastructures of public trans-
port, and provided the highest direct
subsidy of USD443 million to the public
transport company (Table 4). Rapid Kuala
Lumpur and Rapid Penang, being public
bus companies and also as subsidiaries
of Prasarana, each received 100% capital
subsidy and 50% operational subsidy from
the Ministry of Finance (Table 4 & Table
Figure 5: Future structural plan of 5). That funding was used to subsidise
George Town urban centre. 31% petroleum and 32% diesel fuel of
Source: adapted from SPAD (2011). Rapid bus in KL and in George Town urban
centres respectively (Table 5). While PE-
MANDU was praised highly on its achieve-
ment, the overall performance of the pub-
lic transport company left a huge loss in
the book of Prasarana (Table 6).
Type (year) of allocation Amount
Infrastructure (2010) USD0.55 billion
Expenditure (2011) USD443 million
Additional Budget (2012) USD40 million
Table 4: Government subsidies in
Figure 6: Travel demand in George public transport
Town, Malaysia. Source: adapted Source: Budgets Malaysia (2009 –
from Rapid Penang (2011). 2012)
Total Type per litre Amount (%) of subsidies
Urban centre riders (price versus cost to a rider)
Petroleum/litre
Government subsidises RM0.85
George Town 80,000 (Actual price - RM2.75,
rider pays - RM1.90) (31%)
Diesel/litre
Government subsidises RM0.86
Kuala Lumpur 380,000 (Actual price - RM2.66,
(32%)
rider pays - RM1.80)
Table 5: Daily ridership of public bus/ Government subsidies in fuel
consumption (2010 – 2012)
Source: RAPID Kuala Lumpur, RAPID Penang (2011) and Budgets Malaysia
(2009 – 2012)
Table 6: Financial Statements (Syarikat Prasarana Berhad)
Source: Companies Commission Malaysia (2010)
11 World Transport Policy and Practice
Volume 19.1 Feb 20135. Intention to use public bus and serve as independent variables are service
pro-environment cognition reliability, service quality, service informa-
In social cognitive research, intention is tion, demand responsive services, pricing
assumed to be the immediate antecedent of ticket, smart ticketing, bus right-of-way
of behaviour (Bamberg et al., 2003). The and bus image. These variables are used
need to identify the primary cause of not collectively to test the intention to use bus
using public bus service and work towards services, the dependent variable, through
removing the barrier to enhance usage is confirmation of service delivery and sat-
fundamentally crucial. People may have isfaction. The socio economic factor is in-
different needs and expectations which corporated to moderate the relationship of
serve to motivate usage of public bus serv- the variables. The detailed descriptions of
ices. At the same time, strategies to attract these variables are listed below.
commuters and provide more information
about an improved bus service system 6.1. Service reliability
may produce higher switching opportunity. Commuters may experience longer wait at
While recognizing that there is no ‘one size bus stops if bus bunching occurs due to
fits all’ bus utility model, the overall sus- unreliable service schedules. This causes
tainability of bus services (Kennedy, 2002) anxiety during waiting time and probably
in the long run need to be considered. uncertainty during trips. Bus service reli-
Mesa et al. (2009) had studied robustness ability is critical in influencing travel de-
on “system that maintains its functionality cision and researches have been studied
under perturbations”. It was also said that on punctuality, time deviation at stops,
a good bus utility model must be able to unevenness on stops as a dimension of
absorb unplanned demand and minimize service reliability (Chen et al., 2009),
operating costs in lost ridership. In addi- route length, service frequency and pro-
tion, environmentally sustainable buses vision of bus lanes to identify causes of
compared to overcrowded private vehicles unreliable bus services. Marketing litera-
need to be encouraged. An effort to in- tures claimed that punctuality or delay
vestigate health risk awareness caused by of buses impacted overall service quality
transportation related environmental pol- evaluation (Taylor, 1994), while Transpor-
lution was conducted by Morris and Smart tation research reported that punctuality
(2012), but showed no significant result. increases reliability of bus services (Oort
An environmental awareness survey con- and Nes, 2008). Previous researches
ducted among the four largest cities in the have recognized service reliability as the
East Asia, namely Beijing, Seoul, Taipei key factor which measures performance
and Tokyo, reported that “riding a pub- of bus operations (Benh, 1995). Several
lic transportation” is believed by most to methods have been advanced to minimize
be environmental friendly (Zheng, 2009). waiting time, such as offering various
The major findings recently indicated that types of bus ticket, provide better service
involvement of the public in direct experi- information at bus stops, selling advance
ences of pro-environmental activities will bus ticket and rounding up fare price to
catalyse environmental knowledge into avoid keeping of small change (Dorbritz et
a stronger motivating force compared to al., 2009). Bus punctuality ensures con-
indirect experiences (Duerden and Witt, sistency of bus services and is expected
2010). The contribution from research of to build confidence among commuters
pro-environmental cognition in promoting towards bus services. Later research us-
decision to take public bus, change in life- ing Direct Ridership Model (Cervero et al.,
style and to be less dependent on conven- 2010), identified bus service frequency as
tional vehicles need to be stressed by the the key service variable to estimate rider-
policy makers. ship and found that patronage of bus serv-
ices increases when the frequency of bus
6. Literature review services increases. Hensher et al. (2003)
This study includes eight domains of through their quality service index, de-
service expectations and perceptions of duced that service frequency is an impor-
service which are pertinent to bus rider- tant attribute in public transport ridership.
ship and will be used to test relationships The same was also stated by Friman and
among the variables. The variables that Garling (2001) that absolute frequency is
12 World Transport Policy and Practice
Volume 19.1 Feb 2013important in public transport services. In sengers’ demands subject to various con-
an attempt to grow the bus market, im- straints, including time taken for transfers
provement of bus reliability could increase of buses, frequency headways and work
patronage of up to 20% and improvement rules (Kimpel et al., 2008). Information
on smooth riding has the highest impact displayed is found to have impact on bus
compared to other improvement. patronage (Currie and Wallis, 2008). This
includes displaying a large route number
6.2. Service quality and destination signage in front, at the
The level of comfort projected by bus var- side and rear of the bus vehicle. This elec-
ies widely from its seating arrangement to tronic signage must be easily readable and
cleanliness, design, video, audio systems come also with audio announcement upon
and air conditioning facilities. With a good arrival at stops, especially to prepare the
public transport system and a very low elderly alight from a bus. Most commut-
car use in Hong Kong, people still travel in ers generally appreciate service informa-
cars citing primarily car usage as “helpful tion which is accurate and timely in order
for carry things” (Cullinane and Cullinane, to travel with a peace of mind, minimum
2003). Fujii and Van (2009) discovered stress and tension, while trying to cope
the relationship between perceived quality with the competing white collar work and
and intention to use bus services is found city lives. Molin and Timmermans (2006)
to be significant. The thermal comfort and showed service information plays a major
air quality offered by bus is found to in- role in increasing the accessibility of the
crease satisfaction of commuters (Shek bus services and commuters are willing
and Chan, 2008). An approach used by to pay more for service information pro-
Singapore government to promote public vided if it is useful to them. Khattak et al.
transport as a more competitive trans- (2003) showed similar findings. Dziekan
port mode has ascertained improved com- and Kottenhoff (2007) developed a com-
muter travel times, greater comfort and prehensive framework of the possible ef-
convenience in bus service network helps fects of “dynamic at-stop real-time infor-
create positive public perception on public mation displays” for public transportation
transport and less dependency on private and such displays yield better service qual-
cars. Chen and Chao (2011) revealed that ity. Bus companies in Japan, the UK and
drivers perceive greater inconvenience or Singapore provide real time information
difficulty to use public transport compared on the expected time of arrival and routing
to private car use. Friman (2004) claimed via mobile phones. In the United States,
that the interior design and seat availabil- the training given to the elderly to access
ity in a bus should be given attention com- public transit information has increased
pared to other attributes. Travel time and their confidence and comfort in using pub-
travel cost are also the factors triggering lic transport. This confirms the postulation
people’s intention to shift modes of trans- service information could result in a likely
portation (Nor et al., 2006). Kato and Fu- change of longer-term travel behaviour.
jiu (2007) has also derived the theoretical
analysis of the value of travel time savings 6.4. Demand Responsive Services
(VTTSs) observing increases as income Base on the original idea of Demand Re-
increases; the variation of VTTS over in- sponsive Transport (DRT) (Bakker, 1999),
come depends on whether the marginal this conceptual paper incorporates flexibil-
utility is increasing or decreasing with re- ity feature as a service design to suit com-
spect to work time. muters living more than 400 meters away
from the bus stops. The demand respon-
6.3. Service information sive service is to serve journeys that are
Commuters need information of service currently not well served by the traditional
hours to decide on regular transport ac- services. The flexible bus utility model will
tivities such as shopping, travel to work or subsequently provide Rapid with insights
basic social interaction. A good and timely to improve or reinforce service expecta-
service information of routes and schedules tion to align with the perception of people
helps to meet the demand of such activi- who intend to use the bus services. It is
ties. Scheduling is a complex process and recognised that service routes are to ac-
it consists of matching bus services to pas- commodate needs, if not the demands
13 World Transport Policy and Practice
Volume 19.1 Feb 2013of commuters, but well planned service ular stops. Therefore it would continue
routes and feeder services enhance utili- to service the rest of the regular stops to
zation of the services. There are many in- allow commuters to board or alight. The
teresting researches in the field of trans- cut service is notably essential during the
portation, but a conceptual utility model of morning peak (5.30 am to 8.10 am) and
bus services remains unprecedented. No the evening peak (4.30 pm to 7.30 pm) of
significant research on bus routing strate- local time. This would save travel time for
gies has been attempted using the flexible commuters. During those peak hours, cut
service routes and schedules, along vari- services can be introduced to complement
ous directional approaches to increase rid- or substitute the normal fixed route for
ership. There are so far, Palma and Lindsey selected routes. Therefore identification of
(2001) who adopted an optimal timetable stops along those selected routes with low
which minimizes the delay of service and population density providing strategic op-
cost, while Kageson (2009) debated on the portunity for cut service is crucial.
use of preferred travel time of commuters.
There is also the stated preference ap- 6.4(b) Selected stop service
proach (Hensher et al., 2003) which devel- Selected stop service targets specific mar-
oped a service index based on passengers’ kets and delivers commuters directly to
perspectives. This is later identified as a specific destinations such as a high sat-
strong influence of passenger satisfaction urated employment hub, popular tourist
and ridership of bus services. It is reported spots, an airport during peak hour, leisure
that a large market exists for flexible bus and festival trips. The bus serves the com-
services both for the seniors and juniors muters of specific segments. Timetables
(Alsnih and Hensher, 2003). The different may be geared specifically for target mar-
purposes of trips made by active commut- kets to meet particular needs. The bus op-
ers will entail demand on flexible bus serv- erators plan the stops with the coopera-
ices and create challenges to bus opera- tion of the “destined” segments.
tors in meeting the various needs of the
commuting population. The experiences 6.4(c) Feeder service
gained in India has shown bus operators The bus serves as a feeder link to tradi-
introduced cut services during office peak tional bus services. It pools commuters
hours by truncating the regular distances from residential areas, brings them to the
to reduce commuters waiting time. In Ma- main bus hub or station and then takes the
laysia, commuters expect a larger fleet commuters by the regular services accord-
of buses to serve demand during peak ing to scheduled timetables and service
hours and to combat congestion caused routes. The feeder service may overcome
by car dependence. The revived initiative the congestion caused by the over use of
on DRT in the UK which enhances tradi- private vehicles. It serves the majority of
tional bus services is an innovative serv- the residential areas leading to the com-
ice designed to address wider transport mon and frequently visited places such as
and environmental policy problem. DRT grocery markets, shopping malls, schools
is recognized as a flexible bus operations and recreational places (demonstrated in
tailored for travel from point to point with- Figure 7).
out fixed routes and timetables (Sihvola et
al., 2010), but it is based on commuters’ 6.5. Pricing of tickets
travel desires and trip requests to pick and Research has proven a higher acceptabil-
deliver (Cortes and Jayakrishnan, 2002). ity and more positive personal outcome
The different and spatial demand level of expectation in relation to transport pricing
bus services could be met by the various policy when it is intended to reduce con-
improved DRTs which fit well into the re- gestion (Schuitema et al., 2010). Empiri-
sponsiveness of bus utility model. This bus cal findings also showed that personal out-
utility model has incorporated three forms come expectation is proven to be a good
of DRTs reported by Enoch et al. (2004): predictor on acceptability of road pricing
(Schade and Schlag, 2003). Another find-
6.4(a) Cut service ing reported “one-way bus fare” gives rise
A cut service is similar to the normal fixed to a strong negative impact on satisfaction
route service but would skip selected reg- (Hensher et al., 2003). The preliminary
14 World Transport Policy and Practice
Volume 19.1 Feb 2013Figure 7: Diagram shows imposed linkages from suburban to city centre using
the feeder bus services network. Source: adapting from SPAD, Malaysia (2011).
survey conducted by the Rapid expert and 6.6. Smart ticketing
sponsored by the Malaysian Government, The smart ticketing system deploys inte-
confirmed that the price of ticket is a sen- grated ticketing and automatic fare collec-
sitive factor to the Malaysian commuters tion system (Government Transformation
and it is one of the major factors affect- Program, 2010). The process involves stor-
ing the demand of bus ridership. Litman ing the entitlement of passenger to travel
(2004) concluded similar findings on fare electronically on a chip that is usually em-
reduction and service improvements as ef- bedded in a plastic card. The card serves
fective ways to increase bus ridership. The as a smart ticket which is then validated
study in four major Swiss cities of Basel, when it is presented to a smart reader and
Bern, Geneva and Zurich which introduced an ‘integrated’ ticketing system. The valid
cheap season tickets to increase the de- travel card becomes a legitimate ticket to
mand of bus services claimed to have zero travel with the bus. Bus service reliabil-
marginal trip cost, and another study con- ity is often affected by variability in time
ducted in the German city of Freiburg was spent due to onboard ticketing and sale
found to have similar outcomes (FitzRoy (Dorbritz et al., 2009). The proposal to
and Smith, 1999), but added that cheap use the smart ticketing system is intended
and attractive bus season tickets must to reduce the time taken to wait for the
be offered with dense, frequent and fast transaction of purchasing tickets on board
bus services in order to offset the inher- and the subsequent journey time of com-
ent disadvantages of time and cost factors muters. Henceforth, smart ticketing hopes
in public transport. Chen and Chao (2011) to stimulate demand and draw more peo-
suggested to reduce bus fare and to offer ple to use bus services. Empirical research
free service for a period of time to break in smart ticketing is lacking to address
the habit of car use. Hensher et al. (2003) the concerns of waiting time spent on the
identified fares of bus services impacts ticketing process. A comparison between
on user choice of travelling mode. The smart ticketing and onboard ticketing as
change in fare levels and change in fare single server will be undertaken in this
types are both found significant in the study.
study by Gkritza et al. (2011). With these
indications, the Penang state government 6.7. Bus right -of-way
has initiated the free travel incentive pass It is evident that drivers are likely to
for six months in 2011 and that incentive change routes when they receive real-time
has also proven it was effective in attract- information relating to traffic congestion
ing a fraction of habitual car drivers to use and make decision to divert from conges-
public transport, especially the workers tion (Feng and Kuo, 2007). Traffic conges-
working in Penang industrial park. tion caused by overwhelming private ve-
hicles on roads contributes to unhealthy
stress for drivers. Cullinane and Cullinane
15 World Transport Policy and Practice
Volume 19.1 Feb 2013(2003) recommended to increase bus-on- significantly their future satisfaction. Perez
ly-lanes to resolve the congestion. There et al. (2007) found that there is a limit in
are many practical ways to implement spe- increasing service quality to bring about
cific bus lanes. In a similar direction, Nor improvement in intention to use but sug-
et al. (2006) also recommended the use gested a proactive enhancement of per-
of bus lanes, bus gates and information ception of services in order to improve
technology system (ITS) to improve the intention to use bus services. Joewono
efficiency of bus services, while Cervero et and Kubota (2007) showed public per-
al. (2010) found exclusive lane increases ception is useful to bridge the differences
bus ridership. Lastly, it was observed the of perceptions among service users. This
same provision of an exclusive bus-lane is agreed in Ajzen (1991) who concluded
was also recommended other major cities that social norm influences on behavioural
in the world (Table 7). intention and is also favoured by Schade
and Schlag (2003).
6.8. Bus image
Waiting has been the symbolic image of 6.10. Service delivery
public bus transport. The readily available The distance from home to bus stops and
access to a car conveys a higher status of the distance from home to work are the
a person who needs transportation. In the factors influencing the usage of bus serv-
Malaysian society, waiting is perceived as ices and private cars (Nor et al., 2006).
a measurement of status. An observation Perez et al. (2007) concluded that em-
has superiors wait less and in better sur- ployee training programs are essential
roundings than their subordinates. On the to enhance service quality and delivery.
other hand, subordinates wait more and Thorsten (2004) studied customer orien-
sometimes even unnecessarily. Therefore tation of service employees and found that
a projection of superior bus image is im- employing customer-oriented service per-
sonnel is a crucial step
towards the economic
success of service firm.
This is also supported
later by Patterson and
Mattila’s (2008) proposi-
tion in service encounter
evaluations which stated
recruitment and training
should be based on “hire
for attitude and train for
Table 7: Bus lane provision of major cities skill”. Various researches
Source: PEMANDU (2011) have acknowledged the
portant, and images relating to the follow- evidence of customers’
ing may be effective in promoting rider- satisfaction when behaviours of employ-
ship: ees were given emphasis in the process
• Bus status – “taking a bus” is no of service design and delivery (Friman,
longer meant for only lower income group. 2004, Friman et al., 2001, Friman and
• Bus saves time – commuters wait Garling, 2001). Among the specific at-
less because of more punctual bus. tributes which give satisfaction (Friman
• Bus and efficient workers - travel- and Garling, 2001) there is an indication
ling as passengers and less as drivers give of strong influence on overall satisfaction
less tension to commuters and they will by employees’ reliability and interaction in
be able to multitask while on board of bus delivering public transport services. In the
such as planning. quest of creating an overall service qual-
ity index (SQI) on commercial bus service
6.9. Perception of service attributes, Hensher et al. (2003) identified
In a study of users satisfaction with public several bus service attribute levels which
transport, Pedersen et al. (2010) reported contributes substantially towards passen-
that the past biasness derived from nega- ger satisfaction and service effectiveness.
tive incidents with public transport affect Domains included in this study of service
16 World Transport Policy and Practice
Volume 19.1 Feb 2013delivery are bus stop facilities and drivers’ 8. Development of conceptual frame-
attitude. Construction of bus stop is based work
on the number of considerations such as For the purposes of replication, these con-
the number of loading areas, design of cerns are taken into the conceptual devel-
loading areas, one way or two way traffic, opment of a bus utility model (Figure 8).
and traffic signals along the road. It is also The conceptual model reveals the follow-
dependent on whether the bus stop is an ing:
off line bus stop or on-the-street bus stop. • The degree of satisfaction of the
Zaworski (2003) gave an explanation on traditional users of bus services
design and types of bus stops. The choice • Factors influencing the non users of
of bus stop locations could potentially in- the bus services
fluence bus utilization. However, the pre- • To make policy recommendations
requisite to bus capacity planning is to in- to improve overall utilization of the bus
fluence the desire to utilize services. Other services
factors considered in design and choice The bus transport networks and services
of bus stop locations will include: shelter differ from country to country. The vari-
for the bus stop, walking distances to bus ables proposed in the framework may be
stop, locations of passenger, driveway lo- customized to suit generic needs. This
cations, physical obstructions, transfer op- conceptual model is related to two well
portunities and dwell time. Since bus stops established theories, namely Expectation
are the first point of contact between the Confirmation Theory (ECT) (Oliver, 1980)
passenger and the bus service provider and Theory of Planned Behaviour (TPB)
(Yang et al., 2009), its service impression (Ajzen, 1991). TPB supports behaviour
on commuters’ satisfaction should not be that is determined by an intention to pro-
overlooked. There was a suggestion to duce behaviour, and such intention and
assess the overall attributes of bus stop actual behaviour have been found to be
design in the satisfaction of commuters highly correlated. TPB explained in liter-
(Friman and Garling, 2001). ature is the perception of service as a
form of attitude and overall evaluation of
7. Users perception of traditional bus services (Bolton and Drew, 1991). The dif-
services ference between service expectation and
This article reports on an original empiri- perception of service is of interest in the
cal study conducted by ‘Urusbudi Transp- present article. If this difference is negli-
lan’ in 2010 drawing feedback from pub- gible, the confirmation of bus services is
lic bus transport users (n = 10,000) in ensured, and in turn it leads to the ex-
Klang. Only 38% of bus users found the tent of satisfaction. Based on the extent of
service provided satisfactory, and 46% satisfaction, the frequent commuters will
of them found it acceptable (PEMANDU, continue to use the bus services while the
2010). As at 2011, another feedback sur- intention of the occasional commuters of
vey on users perception of public trans- bus services may improve.
port was again conducted (n = 20,000) Churchill and Surprenant (1982) elucidat-
and revealed a rating of 50% on level of ed expectation as an anticipated behav-
satisfaction, a bus loading factor of 56% iour which is characterized as predictive,
in the peak of capacity filling, and a mar- and satisfaction is an attitude towards the
ginal improvement of ridership from 12% total sum of various attributes of a par-
to 16% in public transport modal share ticular service. Commuters as users of
as compared to private vehicles. In these bus services derive satisfaction in using
empirical studies, the key issues identified bus services. Satisfaction creates positive
by the public as hindrance to utilise the effect on commuter’s intention to use or
public bus services are the overall punc- continuance intention to use bus services.
tuality, long waiting and travel time, re- The satisfaction construct was prominent
stricted accessibility, poor bus condition, in marketing researches as the main rea-
the need of interchange service between son for users to patronize services (Oliver,
stops, poor bus drivers’ attitude, and lack 2010), which could be equated to a simi-
of availability of information on service op- lar context of patronizing bus services. Ex-
eration (PEMANDU, 2011). periencing the bus services leads to confir-
mation of service delivery and brings users
17 World Transport Policy and Practice
Volume 19.1 Feb 2013Figure 8: Conceptual framework
to either feel good or otherwise about such 9. Implications for managerial prac-
services, and further derives positive or tice
negative impact on users’ satisfaction. In In view of the discussion appended above,
addition, in the TPB (Ajzen, 1991), it was it is recognized that effort in reducing
revealed that attitude is the predictor of emissions, congestion and air pollution
the intention to use certain travel mode, requires serious attention to manage the
and descriptive norm as an added variable number of vehicles on roads as well as
is a significant predictor to use bus serv- providing an alternative modes of trans-
ices (Eriksson and Forward, 2011). Infor- portation. The introduction of environmen-
mation availability on bus schedules and tal friendly cars may help in resolving the
routes are crucial to intended users irre- problem but it comes with high research
spective of the diverse objectives of trips. costs. It makes the development of a bus
Punctuality of bus arrival and departure utility model timely and warranted. Both
at bus stops are hinged to the arrival and carrots and sticks must be carried out as
departure of its destination and vice ver- means for more effective city environmen-
sa. Service information made available to tal management. The effective and flex-
users facilitates intention to use and con- ible bus utility model may serve as one
tinuance intention to use services. Once of the carrots, while higher taxes to limit
users are onboard the bus, other services car ownership and traffic management be-
will become apparent and their impact on ing the sticks are expected concurrently
usage continues. The intended use and to reduce the current heavy dependence
continuance intention to use bus services on car use. Although Demand Responsive
depend heavily on the inherent character- Transport (DRT) provides the benefit as a
istics of services and cost of services as an flexible transport service when encounter-
alternative mode of transportation. These ing changes in travel demand (Jokinen et
characteristics pose a degree of ease or al., 2011), its implementation requires a
difficulty to use bus services. Moreover, thorough understanding of its market seg-
drivers’ ethics and location of bus stops mentation and prudent cost management.
are instrumental to the level of satisfac- The introduction of Feeder Service (FS) is
tion of bus users. The better the experi- intended to overcome issues on accessibil-
ence of service delivery will give rise to ity and connectivity encountered by 63%
confirmation of both the tangible and in- (Government Transformation Program,
tangible performances of bus services. Us- 2010) of the Malaysian population who live
ers of services compare the service deliv- within the inner city at 400 meters radius
ery and their expectations of bus services. from the main bus routes or transfer hubs.
The more satisfied the users, the higher In addition, the Cut Service (CS) combats
the intention and/or continuance intention the commuters’ cars loading on the road
to use bus services. during the peak hours. When the demand
warrants additional bus services, Selected
18 World Transport Policy and Practice
Volume 19.1 Feb 2013Stop Service (SS) may rightfully serves adapted bus utility model.
this purpose. Pricing strategy is crucial
in the successful implementation of DRT
services. It should be monitored and pe- Author Details;
riodically checked against the costs of car Serena A. G. Kang
use in order to persuade the needy com- Wawasan Open University,
muters to use bus services, and eventually School of Business and Administration,
embrace the bus as their daily transporta- 54 Jalan Sultan Ahmad Shah,
tion tools. In addition, DRT could be de- 10050 Penang, Malaysia.
signed with commuters pooling strategy to Email: serenakang@wou.edu.my
complement the existing regular service.
The selected forms of DRTs introduced K. Jayaraman,
in the bus utility model are to tackle the Universiti Sains Malaysia,
specific and identified issues of bus serv- Graduate School of Business,
ice utilization in the country. It is worth 11800 Penang, Malaysia.
to mention that whether it is the demand Email: dr_kjraman@usm.my
that fluctuates during the service hours or
issues about service delivery, it remains Keng Lin Soh
contextual. Transport practitioners may Universiti Sains Malaysia,
consider and require adaptation of the bus School of Management,
utility model to address respective local is- 11800 Penang, Malaysia.
sues and needs. Email: klsoh@usm.my
10. Conclusions Acknowledgements:
The global economy is going through dif- The conceptual paper represents the cul-
ficult times and pinching on the country’s mination of two years of collaboration be-
competitiveness. The conceptualization of tween the first author and Rapid, the larg-
bus utility model is timely to enable the est bus company in Malaysia and a wholly
optimal use of bus services, reduce traf- owned subsidiary of the government-
fic congestion and boosts productivity of linked public transport company. Special
workers. The government aims to achieve thanks are due to Osman Amir, Yaw Aun
25% of public transport ridership by the Lee, and Mohd. Tajudin from Rapid Pen-
year 2013, mainly by integrating all rail ang, they have each given generous sup-
lines in the Klang Valley into one anoth- port and information about Rapid’s op-
er to create a seamless travelling experi- erations. Anonymous reviewers offered
ence for commuters. A provisional sum of useful criticisms in the 9th International
USD11.2 billion is expended for five years Conference of the Asian Academy of Man-
to purchase more buses of different sizes, agement where a conference paper was
and create better infrastructure and facili- presented. The authors have also drawn
ties for bus operations. It is vital to consid- on the research of many others, cited in
er four strategic aspects of management the text, to conceptualize the model. We
of bus services, namely 1) the accessibil- thank John D. Nelson and Steve Wright
ity and connectivity, 2) the availability and (Centre for Transport Research, UK), and
capacity, 3) the reliability and quality of John Whitelegg (Stockholm Environment
journey time, and 4) the efficiency and Institute, UK), who have read an earlier
status of bus as a transport tool. These draft of this article and provided many in-
aspects have been built in as service de- sightful comments.
signs of the bus utility model. Scholarly,
this conceptual model has initiated a wide
spectrum of future research in a variety of
disciplines. For instance, research in rela-
tion to sustainability of flexible transport,
service integration of DRT with traditional
bus, and specific and effective funding of
future projects on public transport. It will
be also interesting to predict behaviours
across diverse cultural context using the
19 World Transport Policy and Practice
Volume 19.1 Feb 2013You can also read