European Green City Index - Assessing the environmental impact of Europe's major cities A research project conducted by the Economist Intelligence ...
←
→
Page content transcription
If your browser does not render page correctly, please read the page content below

European Green City Index
Assessing the environmental impact of Europe’s major cities

A research project conducted by the Economist Intelligence Unit, sponsored by Siemens

European Green City Index | Contents

     Contents

                                           06 Executive summary                                               City portraits 40 Amsterdam, Netherlands   70 London, United Kingdom

                                           10 The results                                                                   42 Athens, Greece            72 Madrid, Spain
                                                                                                                            44 Belgrade, Serbia          74 Oslo, Norway
                                           12 Analysis of city trends
                                               Wealth matters                                                               46 Berlin, Germany           76 Paris, France
                                               History matters: infrastructure and attitudes                                48 Bratislava, Slovakia      78 Prague, Czech Republic
                                               People matter
                                               Size matters — at first                                                      50 Brussels, Belgium         80 Riga, Latvia
                                               Europe matters: money and culture
                                                                                                                            52 Bucharest, Romania        82 Rome, Italy
                                               Location matters
                                               Looking ahead: implementing sustainable cities                               54 Budapest, Hungary         84 Sofia, Bulgaria

                                           22 Lessons from the leaders                                                      56 Copenhagen, Denmark       86 Stockholm, Sweden
                                               CO2 emissions                                                                58 Dublin, Ireland           88 Tallinn, Estonia
                                               Buildings
                                               Transport                                                                    60 Helsinki, Finland         90 Vienna, Austria
                                               Waste                                                                        62 Istanbul, Turkey          92 Vilnius, Lithuania
                                               Water
                                               An interview with Ritt Bjerregaard, Lord Mayor of Copenhagen                 64 Kiev, Ukraine             94 Warsaw, Poland
                                               An interview with Vilius Navickas, Mayor of Vilnius
                                                                                                                            66 Lisbon, Portugal          96 Zagreb, Croatia
                                           36 Methodology                                                                   68 Ljubljana, Slovenia       98 Zurich, Switzerland

2                                                                                                                                                                                    3
European Green City Index | The cities

     The cities
                                                                                                                                                                                   Helsinki, Finland
                                                                                                                                  Oslo, Norway
                                                                                                                                                           Stockholm, Sweden            Tallinn, Estonia

                                                                                                                                                                                      Riga, Latvia

                                                                                                                                   Copenhagen, Denmark
                                                                                                                                                                                            Vilnius, Lithuania
                                                                         Dublin, Ireland
The European Green City Index measures
and rates the environmental performance
of 30 leading European cities from                                                                   Amsterdam, Netherlands
                                                                                                                                         Berlin, Germany                   Warsaw, Poland
                                                                    London, United Kingdom
30 European countries. It takes into account
                                                                                                                                                                                                                      Kiev, Ukraine
30 individual indicators per city, touching                                                        Brussels, Belgium

on a wide range of environmental areas,                                                                                                          Prague, Czech Republic

from environmental governance and water                                            Paris, France
                                                                                                                                                            Bratislava, Slovakia
consumption to waste management and                                                                                                                    Vienna, Austria
                                                                                                                                                                          Budapest, Hungary
greenhouse gas emissions.                                                                                   Zurich, Switzerland

                                                                                                                                                 Ljubljana, Slovenia
                                                                                                                                                         Zagreb, Croatia
                                                                                                                                                                                                            Bucharest, Romania
                                                                                                                                                                              Belgrade, Serbia

                                                                                                                                                                                               Sofia, Bulgaria
                                                                                                                                  Rome, Italy
                                                                  Madrid, Spain
                                                                                                                                                                                                                           Istanbul, Turkey
                                               Lisbon, Portugal

                                                                                                                                                                                                     Athens, Greece

4                                                                                                                                                                                                                                      5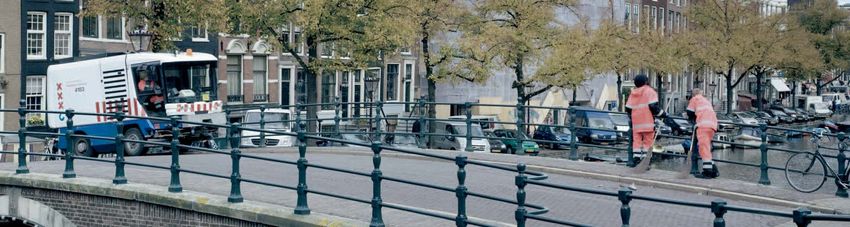
European Green City Index | Executive summary

     Executive summary

                                   Why cities matter: More than one-half of the              ways, from increased use of public transport due                              stability, with only the Balkan wars breaking the    ernment to modify their actions or policies. In      back on the methodology. This study is not the
                                   world’s population now lives in urban areas, but          to greater population density to smaller city                                 general peace of recent decades. Moreover, citi-     particular, increased costs or taxes are usually     first comparison of the environmental impact of
                                   they are blamed for producing as much as 80%              dwellings that require less heating and lighting.                             zen awareness of the importance of protecting        met with scepticism, if not hostility. In the cur-   European cities, nor does it seek to supplant
                                   of humanity’s greenhouse gas emissions. Fur-              Many European cities have demonstrated their                                  the environment and of green objectives has          rent financial situation, this difficulty may well   other worthwhile initiatives, such as the Euro-
                                   thermore, increasing urbanisation can negative-           commitment to reducing their environmental                                    markedly increased in recent years. This is boost-   grow. Although many green technologies help          pean Urban Ecosystem Survey or the European
                                   ly impact everything from the availability of             impact by joining the Covenant of Mayors, a                                   ed in part by a growing body of environmentally      to reduce costs in the long run, immediate finan-    Green Capital Award. Instead, its value lies in the
                                   arable land and vital green spaces to potable             European Commission initiative launched in                                    focussed EU legislation.                             cial concerns may impede the greater upfront         breadth of information provided and in the form
                                   water and sanitary waste disposal facilities. Liv-        January 2008 that asks mayors to commit to cut-                                   But even in environmentally conscious            investment which they also frequently require.       in which it is presented. The index takes into
                                   ing in such close proximity tends to intensify            ting carbon emissions by at least 20% by 2020.                                Europe, problems abound. Across the cities                                                                account 30 individual indicators per city that
                                   thedemands that urban settlements impose on               This is encouraging the creation — often for the                              profiled in this report, an average of one in        How the study was conducted: To aid efforts          touch on a wide range of environmental areas
                                   their surrounding environments.                           very first time — of a formal plan for how cities                             three residents drive to work, contributing to       and understanding in this field, the European        — from environmental governance and water
                                      It is clear, then, that cities must be part of the     can go about reducing their carbon impact,                                    increased CO2 emissions and general air pollu-       Green City Index seeks to measure and rate the       consumption to waste management and green-
                                   solution if an urbanising world is to grapple suc-        which bodes well for the future.                                              tion. The average proportion of renewable ener-      environmental performance of 30 leading Euro-        house gas emissions — and ranks cities using a
                                   cessfully with ecological challenges such as cli-            Of course, environmental performance                                       gy consumed is just 7.3%, a long way short of        pean cities both overall and across a range of       transparent, consistent and replicable scoring
                                   mate change. In concentrated urban areas, it is           inevitably varies from city to city, but some                                 the EU’s stated goal of increasing the share of      specific areas. In so doing, it offers a tool to     process. The relative scores assigned to individ-
                                   possible for environmental economies of scale             encouraging trends are emerging. Of the 30                                    renewable energy usage to 20% by 2020. Nearly        enhance the understanding and decision-mak-          ual cities (for performance in specific categories,
                                   to reduce the impact of human beings on the               diverse European cities covered by this study,                                one in four litres of water consumed by cities is    ing abilities of all those interested in environ-    as well as overall) is also unique to the index and
                                   earth. This has already started to happen in              nearly all had lower carbon dioxide (CO2) emis-                               lost through leakage. And less than one fifth of     mental performance, from individual citizens         allows for direct comparison between cities.
                                   Europe. According to the UN Population Divi-              sions per head than the overall EU27 average of                               overall waste is currently recycled. Moreover,       through to leading urban policymakers. The               Of course, numbers alone only give part of
                                   sion, 72% of the continent’s population is urban          8.46 tonnes1. Part of this success comes from                                 encouraging environmentally helpful behav-           methodology was developed by the Economist           the picture. To complement the core data within
                                   but the European Environment Agency (EEA)                 several advantages which European urban areas                                 ioural change is not a straightforward matter:       Intelligence Unit in co-operation with Siemens.      the index, this study also seeks to provide con-
                                   says that its cities and towns account for just           share. Compared to other regions of the world,                                cities often have little leverage to induce citi-    An independent panel of urban sustainability         text, with in-depth city portraits that not only
                                   69% of energy use. This is achieved in a range of         the continent has enjoyed remarkable political                                zens, companies, or even other levels of gov-        experts provided important insights and feed-        explain the challenges, strengths and weakness-

6                                                                                   1) Based on the most recently available data, the majority of which was for 2006-07.                                                                                                                                                              7
European Green City Index | Executive summary

                                                      Key findings
es of each city, but also highlight emerging best                                                                                                               also face the legacy of history, dealing with            scale, such as district heating or large public trans-   Copenhagen, Stockholm and Amsterdam fea-
practice and innovative ideas that others might                                                                                                                 decades of environmental neglect during the              port networks, come into their own. According-           tured in the top places in both lists, whereas
wish to emulate.                                                                                                                                                communist period. This is most visible in the            ly, the index’s larger cities, with populations of 3     Bucharest and Sofia fared poorly in both.
    The index also differs from other studies in                                                                                                                poorly insulated concrete-slab mass housing that         million or more, perform relatively well, general-
the fact that it is independently researched,                                                                                                                   was widely used, as well as the remains of highly        ly occupying the top half of the rankings. Berlin            The complete results from the index, includ-
rather than being reliant on voluntary submis-                                                                                                                  polluting heavy industry. Although many have             does best overall (8th), followed closely by Paris       ing both overall rankings and individual rank-
sions from city governments. This has enabled         Highlights of the 2009 European Green              unsurprising: wealthier cities can invest more         innovative ideas regarding specific environmen-          (10th), London (11th) and Madrid (12th). This            ings within the eight sub-categories, follows
us to cover 30 main cities — either political or      City Index include the following:                  heavily in energy-efficient infrastructure and         tal initiatives, such as a “lottery” in Ljubljana that   isn’t universal, though: Athens (22nd) and Istan-        next. For insights into what some of the leading
business capitals — from 30 European countries.                                                          afford specialist environmental managers, for          promotes the sorting of waste for recycling,             bul (25th) both perform relatively poorly.               cities have done to top the rankings within indi-
    The goal of the index is to allow key stake-       Nordic cities dominate the index top tier.       example. Wealth isn’t everything, however: some        these cities must also balance with other press-                                                                  vidual categories, specific case studies are avail-
holder groups — such as city administrators,          Copenhagen leads the index overall, coming         individual cities punch above their weight within      ing issues, ranging from unemployment and                 Cities with an active civil society perform well       able from page 22. Finally, detailed insights into
policymakers, infrastructure providers, environ-      marginally ahead of Stockholm, while third-        individual sub-categories: low-income Vilnius, for     economic growth to informal settlements.                 in the index. Although it was beyond the scope           the individual performances of all 30 cities
mental non-governmental organisations (NGOs),         place Oslo rounds out a trio of Scandinavian       example, leads the air quality category; while                                                                  of this study to measure specific citizen engage-        included in the European Green City Index are
urban sustainability experts, and citizens — to       cities on the medal podium. Fellow Nordic capi-    Berlin, with a relatively low GDP per head, tops        The index shows little overall correlation             ment in environmental issues, a strong correla-          available within the city portraits section of this
compare their city’s performance against others       tal Helsinki follows in seventh place. Vienna,     the buildings category and is ranked eighth overall.   between city size and performance. However,              tion exists between high-performing cities in            report, starting on page 40. These explore both
overall, and within each category. The index also     Amsterdam and Zurich occupy fourth, fifth and                                                             the leading cities in both the East and the West         this index and other independent studies that            the current status within each city on all eight
allows for comparisons across cities clustered by     sixth places, respectively.                         Among east European cities (which also rep-          do tend to be smaller, with populations of less than     explore the strength of civil society in European        categories, while also highlighting past, current
a certain criteria, such as geographic region or                                                         resent the low-income cities of the index, with        1 million. To some degree, this makes sense: physi-      countries. The rank of a country in the voluntary        and planned future initiatives to improve their
income group. In short, this tool is provided in       There is a strong correlation between wealth     GDP per head below €21,000), Vilnius performs          cally smaller cities make it easier for people to        participation of citizens in organisations—from          relative performance. The wealth and diversity
the hope that it will help European cities move       and a high overall ranking on the index. Nine of   best of all, ranked in 13th place. It is followed      cycle or walk to work, for example. However,             religious groups to professional and charitable          of initiatives detailed here provide encouraging
towards being a bigger part of the solution to cli-   the top 10 cities in the index have a GDP per      most closely by Riga, in 15th place. The rest of       wealth, and more importantly experience, can             bodies — was a strong predictor of the perfor-           insights into the current directions that Europe’s
mate change and other environmental chal-             head (measured at purchasing power parity,         the east European cities rank at the bottom of         overcome the difficulties of size as policies that       mance of that country’s main city in the Euro-           main cities are taking and their varying paths
lenges.                                               PPP) of more than €31,000. In many ways, this is   the index. The wealth divide aside, these cities       take advantage of environmental economies of             pean Green City Index. Of the applicable cities,         towards a more sustainable future.

8                                                                                                                                                                                                                                                                                 More detailed city portraits can be found at www.siemens.com/greencityindex   9
European Green City Index | The results

     The results

                      Overall                    CO2                       Energy                    Buildings                  Transport                  Water                     Waste and                 Air quality                Environmental
                                                                                                                                                                                     land use                                             governance
                          City         Score         City         Score        City         Score        City         Score         City         Score         City         Score        City         Score        City         Score         City         Score
                      1   Copenhagen   87,31    1    Oslo          9,58   1    Oslo          8,71   =1   Berlin        9,44    1    Stockholm     8,81    1    Amsterdam     9,21   1    Amsterdam     8,98   1    Vilnius       9,37   =1    Brussels     10,00
                      2   Stockholm    86,65    2    Stockholm     8,99   2    Copenhagen    8,69   =1   Stockholm     9,44    2    Amsterdam     8,44    2    Vienna        9,13   2    Zurich        8,82   2    Stockholm     9,35   =1    Copenhagen   10,00
                      3   Oslo         83,98    3    Zurich        8,48   3    Vienna        7,76   3    Oslo          9,22    3    Copenhagen    8,29    3    Berlin        9,12   3    Helsinki      8,69   3    Helsinki      8,84   =1    Helsinki     10,00
                      4   Vienna       83,34    4    Copenhagen    8,35   4    Stockholm     7,61   4    Copenhagen    9,17    4    Vienna        8,00    4    Brussels      9,05   4    Berlin        8,63   4    Dublin        8,62   =1    Stockholm    10,00
                      5   Amsterdam    83,03    5    Brussels      8,32   5    Amsterdam     7,08   5    Helsinki      9,11    5    Oslo          7,92   =5    Copenhagen    8,88   5    Vienna        8,60   5    Copenhagen    8,43   =5    Oslo          9,67
                      6   Zurich       82,31    6    Paris         7,81   6    Zurich        6,92   6    Amsterdam     9,01    6    Zurich        7,83   =5    Zurich        8,88   6    Oslo          8,23   6    Tallinn       8,30   =5    Warsaw        9,67
The complete          7   Helsinki     79,29    7    Rome          7,57   7    Rome          6,40   7    Paris         8,96    7    Brussels      7,49    7    Madrid        8,59   7    Copenhagen    8,05   7    Riga          8,28   =7    Paris         9,44
                      8   Berlin       79,01    8    Vienna        7,53   8    Brussels      6,19   8    Vienna        8,62    8    Bratislava    7,16    8    London        8,58   8    Stockholm     7,99   8    Berlin        7,86   =7    Vienna        9,44
results from the      9   Brussels     78,01    9    Madrid        7,51   9    Lisbon        5,77   9    Zurich        8,43    9    Helsinki      7,08    9    Paris         8,55   9    Vilnius       7,31   9    Zurich        7,70    9    Berlin        9,33
                     10   Paris        73,21   10    London        7,34   10   London        5,64   10   London        7,96   =10   Budapest      6,64   10    Prague        8,39   10   Brussels      7,26   10   Vienna        7,59   10    Amsterdam     9,11
index, including     11   London       71,56   11    Helsinki      7,30   11   Istanbul      5,55   11   Lisbon        7,34   =10   Tallinn       6,64   11    Helsinki      7,92   11   London        7,16   11   Amsterdam     7,48   11    Zurich        8,78
                     12   Madrid       67,08   12    Amsterdam     7,10   12   Madrid        5,52   12   Brussels      7,14   12    Berlin        6,60   12    Tallinn       7,90   12   Paris         6,72   12   London        7,34   12    Lisbon        8,22
the overall result   13   Vilnius      62,77   13    Berlin        6,75   13   Berlin        5,48   13   Vilnius       6,91   13    Ljubljana     6,17   13    Vilnius       7,71   13   Dublin        6,38   13   Paris         7,14   =13   Budapest      8,00
                     14   Rome         62,58   14    Ljubljana     6,67   14   Warsaw        5,29   14   Sofia         6,25   14    Riga          6,16   14    Bratislava    7,65   14   Prague        6,30   14   Ljubljana     7,03   =13   Madrid        8,00
of each city as      15   Riga         59,57   15    Riga          5,55   15   Athens        4,94   15   Rome          6,16   15    Madrid        6,01   15    Athens        7,26   15   Budapest      6,27   15   Oslo          7,00   =15   Ljubljana     7,67
                     16   Warsaw       59,04   16    Istanbul      4,86   16   Paris         4,66   16   Warsaw        5,99   16    London        5,55   =16   Dublin        7,14   16   Tallinn       6,15   16   Brussels      6,95   =15   London        7,67
well as the indi-    17   Budapest     57,55   =17   Athens        4,85   17   Belgrade      4,65   17   Madrid        5,68   17    Athens        5,48   =16   Stockholm     7,14   17   Rome          5,96   17   Rome          6,56   17    Vilnius       7,33
                     18   Lisbon       57,25   =17   Budapest      4,85   18   Dublin        4,55   18   Riga          5,43   18    Rome          5,31   18    Budapest      6,97   18   Ljubljana     5,95   18   Madrid        6,52   18    Tallinn       7,22
vidual rankings      19   Ljubljana    56,39   19    Dublin        4,77   19   Helsinki      4,49   19   Ljubljana     5,20   =19   Kiev          5,29   19    Rome          6,88   19   Madrid        5,85   19   Warsaw        6,45   19    Riga          6,56
                     20   Bratislava   56,09   20    Warsaw        4,65   20   Zagreb        4,34   20   Budapest      5,01   =19   Paris         5,29   20    Oslo          6,85   20   Riga          5,72   20   Prague        6,37   20    Bratislava    6,22
within the eight     21   Dublin       53,98   21    Bratislava    4,54   21   Bratislava    4,19   21   Bucharest     4,79   =19   Vilnius       5,29   21    Riga          6,43   21   Bratislava    5,60   21   Bratislava    5,96   =21   Athens        5,44
                     22   Athens       53,09   22    Lisbon        4,05   22   Riga          3,53   22   Athens        4,36   =19   Zagreb        5,29   22    Kiev          5,96   22   Lisbon        5,34   22   Budapest      5,85   =21   Dublin        5,44
categories.          23   Tallinn      52,98   23    Vilnius       3,91   23   Bucharest     3,42   23   Bratislava    3,54   23    Istanbul      5,12   23    Istanbul      5,59   23   Athens        5,33   23   Istanbul      5,56   =23   Kiev          5,22
                     24   Prague       49,78   24    Bucharest     3,65   24   Prague        3,26   24   Dublin        3,39   24    Warsaw        5,11   24    Lisbon        5,42   24   Warsaw        5,17   24   Lisbon        4,93   =23   Rome          5,22
                     25   Istanbul     45,20   25    Prague        3,44   25   Budapest      2,43   25   Zagreb        3,29   25    Lisbon        4,73   25    Warsaw        4,90   25   Istanbul      4,86   25   Athens        4,82   25    Belgrade      4,67
                     26   Zagreb       42,36   26    Tallinn       3,40   26   Vilnius       2,39   26   Prague        3,14   26    Prague        4,71   26    Zagreb        4,43   26   Belgrade      4,30   26   Zagreb        4,74   26    Zagreb        4,56
                     27   Belgrade     40,03   27    Zagreb        3,20   27   Ljubljana     2,23   27   Belgrade      2,89   27    Sofia         4,62   27    Ljubljana     4,19   27   Zagreb        4,04   27   Bucharest     4,54   27    Prague        4,22
                     28   Bucharest    39,14   28    Belgrade      3,15   28   Sofia         2,16   28   Istanbul      1,51   28    Bucharest     4,55   28    Bucharest     4,07   28   Bucharest     3,62   28   Belgrade      4,48   28    Sofia         3,89
                     29   Sofia        36,85   29    Sofia         2,95   29   Tallinn       1,70   29   Tallinn       1,06   29    Belgrade      3,98   29    Belgrade      3,90   29   Sofia         3,32   29   Sofia         4,45   29    Istanbul      3,11
                     30   Kiev         32,33   30    Kiev          2,49   30   Kiev          1,50   30   Kiev          0,00   30    Dublin        2,89   30    Sofia         1,83   30   Kiev          1,43   30   Kiev          3,97   30    Bucharest     2,67

10                                                                                                                                                                                                                                                            11
European Green City Index | Analysis of city trends
Analysis of city trends
T he European Green City Index makes an
effort to quantify and compare environmen-
urban Europe where most economic growth is
oriented towards services-led industries. Here,
their less wealthy peers. To give but one exam-
ple, two of the three cities that lack even a basic
Helsinki’s Air Protection Group, “but it is possible
to do quite a lot without having to pay more.” The link between wealth
tal performance. Analysing the results more an increase in average output per person of environmental plan are also two of the three She notes that energy efficiency, for example, and environmental performance
deeply reveals relationships and factors which €1,000 seems to yield a gain of two-thirds of a poorest. can save money and cut emissions. Similarly,
help to explain why some cities are more suc- point in a city’s overall index score — a relation- “Money is extremely important,” says Pedro Guttorm Grundt, Environment Coordinator in
cessful in a range of environmental areas than ship that on its own explains up to two-thirds of Ballesteros Torres, principal administrator at the Oslo’s Department of Transport, Environment 100 European Green City Index Score
others. In particular, the data strongly suggest the variance between cities. European Commission’s Directorate-General for and Business, agrees that Oslo’s relative wealth
the following key correlations: At an infrastructure level, the link is obvious. Energy and Transport and in charge of the helps, but notes that measures such as eco-certi- 90 actual
fitted Stockholm Copenhagen
High-quality green infrastructure typically Covenant of Mayors. “Normally, the most fication are not expensive, and that the city’s Vienna Oslo
Amsterdam
Wealth matters: The European Green City involves up-front costs that wealthier govern- advanced cities in environmental terms in own efforts to lead by example in increasing the 80 Berlin Zurich Helsinki
Brussels
Index shows a close correlation between wealth ments can better afford. Conversely, poorer Europe are also the richest. When you have a efficiency of buildings and vehicles “is saving us Paris
London
and overall performance. cities must simultaneously grapple with a wider good infrastructure, it is easier to implement money, together with reducing consumption 70
Madrid
This link is not only evident in infrastructure, range of development issues, from unemploy- things.” and waste.” Mr Grundt adds that the link may be Vilnius Riga Rome
but also in policy: richer cities appear more ment levels to growing informal settlements, It need not be this way. As the city portraits indirect. A relatively wealthy place like Oslo does 60
Budapest
Warsaw
Lisbon
Bratislava
ambitious with their goals. which can easily distract from a green agenda. later in this report show, Berlin, with only a mid- not have certain policy concerns – there are no Tallinn Ljubljana Athens Dublin
One of the closest correlations in the data But a further finding is that the link between level GDP per capita, has a score that benefits slums for example – which poorer cities need to 50 Prague
Istanbul
collected for the index is that between the GDP GDP and the policy indicators within the index from advanced policy in various areas, and War- address, drawing on time and resources which Belgrade Zagreb
40
per head of cities and their overall score — an (which track environmental action plans and saw, while in the bottom half of the wealth richer peers might use elsewhere. Bucharest
Sofia
aggregate figure between 0 and 100 reflecting public participation in green policy, among table, is ranked in joint-fifth place in the environ- The tie between money and environmental Kiev
30
performance across all the environmental indi- other things) is statistically even stronger. In mental governance category. Moreover, while performance, however, looks set to grow GDP
per person
cators measured. Although greater pollution is other words, wealthier cities are not only able to costs may constrain certain policy options, they stronger as a result of the current economic (Euros)
20
often associated with economic development, afford more sustainable infrastructure, they are do not do so in general. “Money is in some ways downturn. Ms Väkevä notes that even relatively 10,000 20,000 30,000 40,000 50,000 60,000 70,000 80,000
at least in early stages, the reverse holds true in also setting more ambitious policy goals than very difficult,” admits Outi Väkevä, part of well-off Helsinki has little money to devote to
12 13
European Green City Index | Analysis of city trends

the expansion of current environmental efforts.        ronmental effect from the former divide               that is the mirror image of the east. As the city     in the index’s building category — has had            tively on the environment choices. For example,                              citizen engagement and environmental perfor-
The city portraits for this report note specifically   between East and West. Thirteen of the top 15         portraits note, Copenhagen has been taking            tremendous success in retrofitting housing            many eastern urban areas — including the top                                 mance.
that cities as far apart as Dublin, Budapest and       index performers are in western Europe; 11 of         environmental issues and sustainable energy           stock, including nearly halving the energy use of     five performers in this metric — score highly in                                 Good environmental results generally do not
Belgrade are likely to scale back because of cur-      the bottom 15 were part of the old eastern bloc.      seriously since the oil shock of the 1970s; Stock-    273,000 concrete-slab buildings in the eastern        the index on the number of people taking public                              happen by chance. European governments, for
rent economic troubles, and others will doubt-             Aside from the wealth divide, this also has to    holm also has a long tradition, and is now on its     part of the city. Looking forward, Oslo’s efforts     transport to work while Copenhagen, Stock-                                   example, have had to regulate private carbon
less be doing so as well. It remains to be seen        do with legacy. As the city portraits show,           sixth consecutive environmental plan.                 to provide charging points for electric cars and      holm and Oslo are amongst the lowest scorers.                                use through carbon trading because existing
how cities will balance maximising the benefits        various eastern cities are still dealing with the         As with wealth, history has a variety of          Vienna’s to promote vehicles that run on natural          This superior eastern performance, however,                              economic markets did not price the negative
of enhanced environmental performance while            fallout from decades of environmental neglect         impacts, some less obvious than others. Infra-        gas are both creative ways to use existing infra-     seems less a result of enlightened environmen-                               externalities of carbon emission. Even with such
minimising the financial costs in the near term.       during the communist period: for example, even        structure — whether building stock, transport         structure — in this case roads — in a more envi-      tal choice than a lack of alternatives, and there                            efforts, green choices sometimes still have a
                                                       though polluting industries have mostly disap-        facilities, or water pipes — develops over the        ronmentally friendly way.                             are signs that the balance may be shifting.                                  higher price tag than other options, especially in
History matters: infrastructure and attitudes:         peared in the face of market competition, poorly      long term, and is hard to change quickly.                 More difficult to change than the physical        Bratislava is a case in point. The city has the                              the short term. Moreover, city administrations,
 Cities in eastern Europe have a tougher chal-        insulated, concrete-slab, mass housing remains.       Longevity of systems does not seem to matter so       environment are the attitudes and aspirations of      highest share of people taking public transport                              on their own, have relatively limited power. The
lenge to overcome, in terms of their relatively        In Belgrade’s case, its relatively recent interna-    much as upkeep.                                       individual citizens. With so much of a city’s envi-   to work but has also seen a surge in newly regis-                            sum of the individual decisions of their residents
aged and inefficient infrastructure.                   tional isolation — it was embargoed for years             For example, Vienna’s and Ljubljana’s water       ronmental performance reliant on how its resi-        tered cars in the last decade. Tallinn, Zagreb,                              — from actions such as choosing to insulate
 Historical attitudes and aspirations are also        and eventually bombed in 1999 — only adds to          systems both date back to the late 1800s, but         dents act individually, in groups and as a whole,     Ljubljana, and Prague all have similar news, and                             their homes, to opting to commute to work via
difficult to overcome. For example, the adop-          the difficulty. Similarly, certain bureaucratic       the former city comes in second in the water cat-     winning hearts and minds is crucial (see next         the Mayor of Vilnius cites this increased car                                public transport — have a deeper impact on the
tion of consumer culture in the East has led,          habits can also outlive the transition to democ-      egory, and the latter 27th. Whatever the diffi-       section). Accordingly, one area of concern is         usage as his city's leading environmental chal-                              environment than an army of policies. Accord-
understandably, to greater demand for vehicles.        racy. “People (in the east) are ready to learn and    culties — practical and financial — of upgrading      how the legacy of suppressed demand in the            lenge.                                                                       ing to a 2008 report produced by Siemens in
    Twenty years ago, the Berlin wall fell and         change things quickly, but the inertia is quite       physical assets, however, infrastructure age is       countries of eastern Europe, after decades of                                                                                      conjunction with McKinsey & Company and the
Europe moved toward binding the wounds                 heavy,” argues Mr Ballesteros Torres.                 certainly not decisive. Copenhagen’s buildings,       being economically less well off than their west-     People matter:  The individual decisions of                                 Economist Intelligence Unit2, about three-quar-
inflicted from a turbulent century. While there            On the other hand, if three Nordic cities are     for example, are among the most energy-effi-          ern neighbours, may play out. As these commu-         cities’ inhabitants are, collectively, more power-                           ters of the existing technological changes that
has been much progress on the political and            jostling each other for the overall leading posi-     cient anywhere, even though only 7% were built        nities get wealthier, some citizens may use new-      ful than their governments’ ability to intervene.                            would help London to meet its long-term carbon
economic levels, there remains a marked envi-          tion in the index, it is because they have a legacy   in the last 20 years, and Berlin — the joint leader   found wealth to make choices that impact nega-         Accordingly, there is a correlation between                                reduction targets depended on the decisions of

14                                                                                                                                                                                                                       2) Sustainable Urban Infrastructure: London Edition – a view to 2025, Siemens AG, 2008.                                     15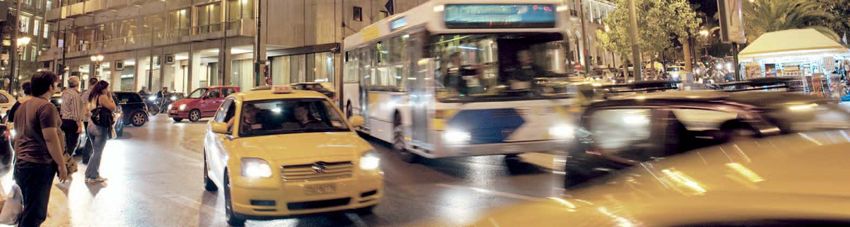
European Green City Index | Analysis of city trends
citizens or companies, not of governments. As a meetings or contacting officials). Twenty-three poorer performance. Each additional 120,000 slightly more likely to have people walk or cycle
result, the engagement of individuals with soci- Comparison of rankings: EFILWC Voluntary of the countries in these indices contain cities inhabitants correlates, approximately, with a to work — the average distance obviously being
eties around them — or the strength of civil soci- Participation Index and European Green City Index that are included in the European Green City score that is one point lower less in a physically smaller place. Even here,
ety in a city — has a strong link to environmental Index. A comparison between these indices Greater city size could be either a drawback however, the correlation is weak.
performance. yields two interesting findings. The first is a rela- or an advantage in this index. All things being Looking at eastern and western cities sepa-
This link is underscored by comparing the tively low correlation between the level of politi- equal, a given environment should be able to rately, however, it becomes clearer that small
results of the European Green City Index with an Best Rank (European Green City Index) Copenhagen cal participation and a city’s environmental per- handle the emissions and activities of a million urban areas have some advantage. The highest
independent report from the European Founda- Vienna
Stockholm formance. The second is a high correlation people more easily than those of ten million — scores in the survey overall, belong to smaller
tion for the Improvement of Living and Working actual Amsterdam between voluntary participation and a city’s the wind could blow the resultant air pollutants western cities (Copenhagen, Stockholm and
fitted Helsinki
Conditions (EFILWC)3. The Foundation’s 2006 Berlin
environmental performance. In other words, away more quickly and waste would build up Oslo), and the top performers in the old east, Vil-
study looked specifically at participation in civil Brussels while political engagement is not closely linked more slowly. On the other hand, larger cities can nius and Riga, are also on the small side for that
Paris
society, based on a wide-ranging survey of Euro- London to environmental strength, an active civil society benefit from economies of scale, having greater grouping. All of these cities have populations of
Madrid
pean citizens. As part of this study, the Founda- Vilnius
is extremely important. City leaders hoping to collective resources to pursue policies or create less than one million people. For east European
tion created two indices. One was of voluntary Rome improve their city’s overall performance would greener infrastructure. cities, there is an identifiable correlation between
Riga
participation in organisations (based on the Warsaw
do well to explore ways of engaging more close- At first glance, there seems to be little link higher population and poorer index perfor-
average number of voluntary organisations, Budapest ly with their citizens. between the size and population of cities and mance. Onehundred and twenty thousand more
Lisbon
such as religious groups, trade unions and Ljubljana their index performance, with smaller ones scat- people leads to, roughly, one less point. In par-
sports, professional or charitable bodies that cit- Athens
Dublin
Size matters — at first: Although there is tered between Copenhagen at number one ticular, an increase in population has a notice-
izens belonged to), which is a useful proxy for Tallinn little correlation between city size and perfor- (with a population of about half a million) and able negative effect on scores for measures of
Prague
the strength of civil society. Bucharest Best Rank mance in the index overall, the leading cities do Zagreb at twenty-six (with a population of about air pollutants and carbon dioxide intensity.
Sofia (Index of Voluntary
The second was of political participation Participation) tend to be smaller in both the East and the West three-quarters of a million). Individual metrics Nature’s greater ability to cope with the environ-
(based on the proportion of citizens engaging in Among east European cities, however, there also demonstrate few links with size, except that mental demands of small cities than of large
political activities, such as voting, attending is a correlation between larger populations and those cities with lower populations may be ones remains relevant in these urban areas.
16 3) First European Quality of Life Survey: Participation in civil society, European Foundation for the Improvement of Living and Working Conditions, Dublin, 2006. 17
European Green City Index | Analysis of city trends

    In western cities the effect, if still present, is                                                                                                                   EU funding is a crucial factor in enabling low-      ing a huge portion of the continent. Broad Euro-        urban governments large and small. The EU is
residual. The statistical significance of the link is    The link between population and environmental                                                                  income cities to improve their environmental           pean goals, such as the EU’s 20-20-20 goal of           now tapping into the same sentiment. In early
very low, and it takes nearly a million extra peo-       performance in east European cities                                                                            performance.                                           cutting carbon emissions, increasing renew-             2008 it launched the Covenant of Mayors, which
ple before a city’s score goes down a point. The                                                                                                                            This study highlights ways in which Europe         ables and cutting energy consumption are also           focuses specifically on matters of climate
explanation for the strong correlation in east                                                                                                                          — both through its institutions and more amor-         driving change. The requirements of accession           change and sustainable energy. The covenant
European cities is likely — again — to be histori-                                                                                                                      phously as a community — is having an impor-           have led to the adoption of much more                   too has over 600 signatories and, as several of
                                                         65 European Green City Index Score
cal. Eastern cities have less experience with envi-                     Vilnius                                                                                         tant impact on urban environmental performance.        advanced environmental legislation and policy           the city portraits later in this report show, the
ronmental policy.                                        60
                                                                                   Riga
                                                                                                                                                  actual                The first, very practical contribution of European     in all of the newest eastern members of the             very fact of membership is committing a num-
                                                               Ljubljana                                                Warsaw
    The disadvantages of greater size, while pre-                                                                                                 fitted                institutions is cash. As noted above, there is an      Union in recent years, as they did for south Euro-      ber of cities to put forward sustainable energy
                                                                      Bratislava                                    Budapest
sent initially, may be possible to overcome as           55                                                                                                             important link between money, at the very least        pean entrants before them. It is having a similar       plans for the first time.
                                                                     Tallinn
larger cities gain more experience in environ-                                                                                                                          for investment, and environmental success. As          effect on candidate countries and it may be no              Ultimately, although money spent on physi-
                                                         50                                         Prague
mental management. “Some smaller cities are                                                                                                                             the city portraits show, inter alia, the EU is pro-    accident that the one eastern city whose coun-          cal infrastructure is important, it is this increas-
doing very well because at one moment or                 45                                                                                                             viding funding for water plants in Budapest and        try is not yet an EU accession candidate scores         ingly pervasive notion that responsible and
another there were leaders who decided policy                                        Zagreb                                                                             Vilnius, as well as for Prague’s ring road; the        worst in the survey.                                    effective environmental governance ought to be
                                                                                                             Belgrade
and there was a consensus among the popula-              40
                                                                                                                                 Bucharest                              European Investment Bank (EIB) is helping with             In addition to the force of law, voluntary insti-   the norm for all European countries that could
tion in order to make things exemplary,” says Mr                                                    Sofia                                                               Tallinn’s water supply and sewage systems; and         tutions have been developing that seek to har-          provide the long-term political foundation
                                                         35
Ballesteros Torres. “In absolute and statistical                                                                                                             Kiev
                                                                                                                                                                        the European Bank for Reconstruction and               ness and increase a growing sense that environ-         which green efforts need for success.
terms, large cities have more resources, and             30                                                                                                             Development is providing finance for the reha-         mental stewardship is part of what is expected
some are doing particularly well.”                                                                                                                                      bilitation of Zagreb’s largest landfill site. As the   from a modern European city. The European               Location matters:  Environmental sustain-
                                                         25                                                                                                             downturn hits city budgets more deeply, such           Sustainable Cities and Towns campaign, for              ability depends as much on the resources avail-
Europe matters: public funding and cul-                                                                                                      Population (in millions)
                                                                                                                                                                        assistance will be more important.                     example, dates back to 1994, and its 2004 Aal-          able as how they are used.
                                                         20
ture:  Accession to the EU has had a huge posi-                       0.5                    1.0            1.5                 2.0                  2.5                   The expansion of the EU is also having an          borg Commitments on a series of sustainability              A problem of any comparative environmen-
tive impact in energising environmental policy.                                                                                                                         impact, with EU environmental law now cover-           issues have been signed by over 600 European            tal index is that the natural resources available,

18                                                                                                                                                                                                                                                                                                                                      19
European Green City Index | Analysis of city trends
and the robustness of the local ecology, can dif- cern in Stockholm where fresh water is plentiful ing problem. But when we get better integrated their environmental impact. This encompasses Of course, not all technologies are cost-effec- This engagement isn’t necessarily a one-way
fer markedly from place to place. Sustainability and therefore even the high levels of current use into the European grid, it becomes important.” areas where a city administration can lead the tive. The study referenced above showed that in process: citizens often lead the way, encourag-
involves, to quote the Brundtland Report4, a are sustainable. way, as well as measures which the residents of the context of London hybrid cars and photo- ing city leaders and others to embrace change.
study from the UN’s World Commission on Envi- In the related fields of carbon emissions and Looking ahead: implementing sustainable a city will have to implement themselves. The voltaic panels on houses are expensive relative In Oslo, for example, early adopters of electric
ronment and Development on sustainable energy use, location might seem less important cities: Cities have an array of options or levers at aforementioned Sustainable Urban Infrastruc- to the impact they make on carbon reductions, cars banded together and lobbied the city
development, meeting “the needs of the present because released CO2 contributes to the global their disposal when it comes to the task of ture: London Edition study highlighted that sim- for example. Also, the economics of some tech- government to waive tolls and parking fees
without compromising the ability of future gen- problem of climate change. However, some improving their overall environmental perfor- ply by improving building insulation, using ener- nologies are often dependent on the policies that and allow access to the city’s dedicated public
erations to meet their own needs.” Behaviour issues remain. Oslo, for example, is ranked joint mance. First, policy and good environmental gy-efficient lighting and appliances, and installing accompany them, such as the subsidies required transport lanes. Whatever form it takes, this
that might exhaust resources rapidly in one place, 24th in the index for the amount of energy used governance clearly play an important role. These more advanced environmental controls in struc- to support the generation of solar energy in engagement is critical. Ritt Bjerregaard, Lord
then, may be perfectly sustainable in another, — one of several sub-indicators that go into help ensure that new buildings and infrastruc- tures, London could move over one-quarter of many countries. Mayor of Copenhagen, the top ranked city in
making comparative scores harder to interpret. scoring the energy category, where the city ture are developed (or retrofitted) with certain the way towards its overall aspiration of reduc- Third, as shown above, engaging and moti- the index, points out that for the city to reach
Two examples from high performers in the comes first overall. On the other hand, the over- minimum efficiency standards in mind, for ing carbon emissions by 60% by 2025. Over a vating communities within cities is also critical its climate change goals, citizens themselves
index illustrate the point. Stockholm, with the whelming majority of this power, including all example. They also encourage (either through 20-year lifecycle, the upfront investments required to delivering increased sustainability. Education have to change their habits. “Campaigns to
second-highest overall score, is ranked a surpris- the electricity and much of the district heating, incentives, or through penalties) citizens to change for these technologies would more than pay and public awareness are important here, giving motivate lifestyle change are an important
ing 16th place when it comes to water. The comes from renewable sources, in particular their behaviour, such as the establishment of a back in the form of reduced energy bills. people the necessary information to help them tool. We are also working hard to involve the
problem is not sewage, which it treats and even hydroelectricity and waste. The city does have congestion charge to reduce traffic or a sub- More advanced capabilities can go even fur- make greener choices. This can come in many citizens in developing solutions to the prob-
uses as a source of energy, nor leakages, which an energy efficiency fund, which seeks to sidised bicycle scheme to promote affordable ther: Amsterdam’s state of the art waste-to- forms and go well beyond the basics of publish- lems.”
are below average. Instead, residents simply use reduce power usage, but the question does arise alternative means of commuting. At a different energy plant achieves high levels of energy effi- ing advice. For example, a number of cities in The next section of this report, Lessons from
a lot of water, and the city makes little effort to of just how important it is to cut consumption of level, by ensuring that green spaces and other ciency that allow it to power more than the index have rolled out water meters and the leaders, highlights the work that Copen-
discourage them. While this behaviour might be entirely green energy rather than focussing on areas are off limits to further development, city three-quarters of the city’s households. It can smart electricity meters, thus giving consumers hagen and other leading cities in the index are
problematic in hot, dry cities, such as Madrid, or other areas. Mr Grundt agrees: “As long as Nor- leaders can ensure that the natural environment even profitably extract gold and other metals a means of quantifying their own consumption doing across a range of key categories to
even in London, which receives less rainfall per way cannot export much of its abundant hydro- remains preserved within the city’s boundaries. from the resultant ash, while sending just 1% of and choosing to be more careful about how improve their relative environmental perfor-
head than Addis Ababa, it poses less of a con- electricity, and we have enough, it is not a press- Second, technology can help cities to reduce the original waste to landfill. much they use. mance.
20 4) Brundtland Commission, Our Common Future, Oxford University Press, 1987. 21European Green City Index | Lessons from the leaders
CO2 emissions
Ideas from
other cities
Berlin’s renewable energy focus is on solar
power. Among the city’s many initiatives is
Europe’s largest photovoltaic system on a res-
I t would be easy to be complacent about
greenhouse gas emissions in Oslo. The city’s
carbon dioxide (CO2) emissions per head, at 2.2
cess. To begin with, Oslo has set itself one of the
most ambitious carbon reduction targets in the
index: aiming to reduce emissions by 50% from
monopoly to a district heating company, which
it largely owned, to provide all heat to any new
or thoroughly renovated buildings by refusing
another emission-reduction strategy is the
switching of fuels. The city is encouraging the
use of electric and hybrid cars through various
idential building, which produces 25,000
kwh annually.
Helsinki now has the world’s largest heat
tonnes, are less than one-half of the 30-city 1990 levels by 2030, or a further 37.5% from permits to any construction plan that had other inducements, including the waiving of city tolls pump, under centrally located Katri Vala Park.
average of about 5 tonnes — itself lower than today. Guttorm Grundt, the environmental sources of supply. At the same time, it required and parking charges, as well as the establish- It uses heat from wastewater and seawater to
the overall EU27 average of 8.46 tonnes. The affairs co-ordinator in Oslo’s Department of municipal buildings to convert to district heating ment of electric charging points. “It started with provide district heating and cooling.
city benefits from its local natural resources: Transport, Environment and Business, remarks and exerted strong moral pressure on other pub- the enthusiasts,” notes Mr Grundt. “They formed In January 2008, Madrid approved a €14
high levels of rainfall, along with a mountainous that such long-term goals are very helpful in lic institutions such as hospitals and universities. an association and put pressure on the politi- million Ecobarrio project to revitalise several
countryside, provide significant opportunity for keeping progress on track. Mr Grundt says that others are now seeking the cians to change the rules.” One key step was run-down neighbourhoods. These will in-
clean hydroelectric power. This is a boon in The city administration has also tried to put service for commercial reasons. “More and more allowing commuters with electric or hybrid vehi- clude a thermoelectric plant using biogas
Oslo’s efforts to reduce CO2 emissions. As a its own house in order. “To be credible we have private owners and developers are joining,” he cles to drive in the city's dedicated public trans- from urban waste treatment and buildings
result, Oslo’s emissions per unit of GDP, at 20.2 to act as a good example: 60 % of the city’s own notes. “The prices are not much cheaper, but dis- port lanes. As a result, the Oslo region now has that capture solar power.
tonnes per million euros, are paltry compared car fleet, for example, has no or very low (green- trict heating involves a lot less maintenance.” about 1,700 electric-only vehicles, excluding In Paris, Aéroports de Paris has launched an
with the average across the study of around 356 house gas) emissions,” says Mr Grundt. The city The city has also taken an active role in reduc- hybrid cars. intra-company car-sharing network. If just 5%
tonnes or the broader European figure of more is even planning to use of biofuels derived from ing transport-related CO2 emissions. Here, the Other strategies have also made judicious of airport employees use the network regu-
than 339 tonnes. Simply put, if Europe as a human waste in its buses in 2012. stick — in the form of Oslo’s congestion charge use of taxes and inducements. The city’s €100 larly, it will save around 4,000 tonnes of CO2
whole were to perform as well as Oslo, it would To spur residents to reduce their CO2 emis- — has had some effect, cutting existing traffic million Climate and Energy Fund, for example, emissions.
surpass its overall carbon reduction targets. sions, Oslo provides both penalties and incen- by between 4% and 7% since its introduction. was funded by a tax on local electricity. Among Copenhagen has set an ambitious goal of
Nevertheless, Oslo is at the top of the CO2 tives. It has promoted district heating, use of Moreover, the charge has stopped private vehi- other things, it now provides a 50% grant for the becoming carbon neutral by 2025, building
emissions category because it has not been sat- which expanded by 36% between 2000 and cle travel from increasing in line with the city’s conversion of oil heaters to ones powered by on its existing climate plan which targets 50
isfied with its natural advantages, but has 2006, and which relies largely on biofuels and fast growing population. biofuels. With similar national grants in place, specific initiatives in energy production,
instead drawn on leadership initiatives and a the city’s carbon-free electricity. Progress was For those residents who wish to continue dri- Mr Grundt argues that there is “no excuse left transport, buildings and consumption.
range of sticks and carrots to increase its suc- initially the result of regulatory fiat: Oslo gave a ving, despite Oslo’s good public transport, not to change.”
22 23European Green City Index | Lessons from the leaders
Buildings
This highlights one of the key difficulties in private companies improving the energy effi- city has found that the optimal, cost-effective Energy Efficiency Network for Building Stock
reducing the environmental impact of buildings. ciency of public buildings with both the contrac- measures for saving heat energy are insulation (BEEN), Berlin shared its knowledge with cities Ideas from
Take Berlin, the category co-leader: since 1990, tors and the city benefiting from the cost sav- of the outer walls and top floor ceiling; new air- in Poland and the Baltic states and worked with other cities
the reunified city has had to find ways to shift ings. So far, the scheme has led to €60 million in tight windows; and renovation of the building’s them on understanding how best to finance
the carbon requirements of a host of building private investment, saved the city €2.4 million in heating system. These three measures reduce such renovation. Now the EU is funding the Urb
types towards a more sustainable level. One costs, and brought carbon emissions down by annual carbon emissions by between 1 and 1.4 Energy project to take things further, looking not From April 2010, London will start a trial
obvious place to start is not with the buildings 600,000 tonnes. tonnes per flat. just at individual buildings but at urban infra- scheme for retrofitting homes to save energy,
themselves, but with the kind of energy power- An even bigger effect has come from the However, Mr Wollschläger points out that structure and holistic rehabilitation of whole providing some energy-efficiency equipment
ing them. city’s efforts to improve what local experts call even over the long term the energy savings do residential areas. for free, such as low-energy light bulbs and
The city’s heating modernisation pro- the once “ramshackle” flats built of prefabricated not pay the entire cost of the refurbishment of By contrast, Stockholm, the other joint leader standby switches, while charging for more
gramme, for example, encouraged a substantial concrete under the previous East German these flats. The benefits extend beyond energy in the buildings category, has been at the fore- advanced measures.
shift in fuel source through grants, advice and regime. Of the 273,000 apartments, the city has savings, however, such as lower maintenance front of energy-efficient building standards for Residents of Prague can benefit from a na-
tighter regulation on new buildings. In 1990, fully refurbished about two-thirds of them, and costs for these flats given that the improve- some time. The city benefits from its extensive tional Czech programme for retrofitting
over 400,000 apartments still had coal furnaces; partially upgraded the other 35%, at an average ments reduce mould and mildew, as well as use of heat pumps, which make more efficient buildings with a €1 billion budget, which is fi-
W hen it comes to buildings, no city can start
from scratch: each has to work with the
legacy of generations. An unattributed quote,
by 2005, the number had dropped to just
60,000. Most of the shift was towards cleaner,
although still carbon releasing, natural gas.
cost of €20,000.
Not all of this goes to better energy efficien-
cy. It is a broad-ranging programme to increase
keeping temperatures more even. Quite simply,
they are nicer places to live.
The lessons which the city has learned could
use of electricity for heating. Insulation stan-
dards are also high. All this pays off: Sweden has
years of experience building homes with a total
nanced from a sale of CO2 emission permits
to Japan.
In 2001, Vienna began permitting the con-
meant for humorous effect, captures the prob- While improving the energy mix, Berlin has the attractiveness of these properties: about 5% have a substantial impact worldwide. Across annual energy consumption of well below struction of multi-storey buildings made pri-
lem neatly: “Our problem is that the buildings also attempted to address the deficiencies of of spending, for example, goes on the surround- central and eastern Europe, the city estimates 2,000 kwh, despite its cold climate. By contrast, marily of timber. This has helped to bring
from 100 years ago were built to last 100 years; some of its buildings. It has not been so much a ings. Energy efficiency is, however, an impor- that there are nearly 50 million flats of similar new houses built in the UK that comply with the about the development of a new kind of en-
the buildings of 50 years ago were built to last case of making do with existing infrastructure, tant consideration. construction, and in China there are about 200 country’s latest energy-related building stan- vironmentally friendly passive housing.
50 years; and the buildings of 20 years ago were but rather improving to make it greener. An According to Peter Wollschläger of the Berlin million. dards will consume an average of about 3,600
built to last 20 years.” “Energy Saving Partnership”, for example, has Senate Department of Urban Development, the Between 2005 and 2007, through the Baltic kwh.
24 25European Green City Index | Lessons from the leaders
Transport
C ity transport is one of the key areas where
cities have a direct ability to influence the
choices that residents make in how they com-
size, allows an astonishing 68% of people to
cycle or walk to work, even though it has the sec-
ond-lowest average temperature of any city in
gestion tax on vehicles driving in the central part
of the city in August 2007, with the support of
residents there but over the objections of those
cial cycling zones where cars are banned, the city
also tries to make cycling easier. This includes
everything from giving cyclists information on
buses running on renewable fuel by 2011, and
all of them by 2025. Meanwhile, the city’s Trafik
Stockholm system constantly gathers data from
Ideas from
other cities
mute. This is most obviously done through the the index. Nor does a relatively small public living in outer areas. It has certainly had an traffic flows to free, secure parking to prevent a wide range of sources about the state of traf-
make-up and extensiveness of public transport, transport network unduly restrict use: intelli- effect on car use, reducing the number of cars bicycle theft — a serious problem in the city. fic. It then not only provides the analysed infor-
but consumers can also be directly encouraged gent city planning has created a network which entering or leaving the zone by about 20%. mation to drivers to help them choose their Budapest held a “Clever Commuting Race”
to do more walking and cycling (the greenest takes one-quarter of people to work each day, According to Mr Wallin, the tax also raised the Technology: Other cities are using congestion routes, it also adjusts traffic lights or uses vari- where local VIPs demonstrated the efficiency
possible options) through the provision of dedi- leaving only about 7% using private vehicles. number of daily travellers on SL by approximate- charges, and Mr Wallin notes that many of Stock- able road signs to reduce congestion. Advanced of travelling via public transport, by “racing”
cated cycle paths, pedestrianised areas and bicy- This is even more marked at peak times: Stock- ly 5%. Income from the tax is used to reduce holm’s strategies to make travel easier, while technology can be expensive. Mr Wallin notes that from a suburban district to the city centre.
cle subsidies. In Stockholm, the index’s leader in holm Public Transport (SL), the county council- congestion and improve the environment in the important, “are probably not very original.” pioneering is particularly costly. “You have to Brussels supports “Voiture avec Passagers”, a
environmentally friendly transport, three impor- owned transport company, reports that over city. Equally important, the city does not just for- What sets the city apart is its experimentation pay the prices for problems you could not fore- formalised hitch-hiking scheme.
tant building blocks come together: the ability of three-quarters of rush hour journeys into Stock- bid driving, there is universal political support for with new technology. One of SL’s environmental see when you start up.” Over time, the relative Dublin’s “Bike to Work” scheme allows em-
residents to easily access public or private alter- holm’s centre use its services. Looking forward, providing a green public alternative so that peo- principles is to “actively participate in, initiate cost premium of green technology has been ployers to divert up to €1,000 in wages on
natives that are green, safe and convenient; the €1.7 billion Citybanan project will double rail ple have a genuine choice. “Almost regardless of and push on the development of an eco-adapted coming down and will continue to do so as it behalf of employees for the purchase of a bi-
government policy that encourages use of such capacity. At the same time, Stefan Wallin, SL’s political colour,” Mr Wallin says, “politicians are transport system.” It is no accident that SL has matures, he adds, but in Stockholm’s case it has cycle. This money is subsequently not taxed,
alternatives; and the application of green tech- environmental manager, explains that it is try- quite keen to put their mark on sustainable devel- one of the largest fleets of ethanol buses in the still not completely disappeared. Even with 20 leading to up to a 47% savings on the price of
nology solutions to vehicles and infrastructure. ing to make travel easier for customers with opment. We are continuously pushed by politi- world: it has been using the technology since years' experience, for example, it remains more a bicycle for the employee.
efforts to provide real-time information on wait- cal pressure to come up with new solutions.” 1989. Mr Wallin explains: “I have a picture on my expensive to run ethanol than standard diesel Tallinn is fitting buses with electronic equip-
Opportunity: To begin with, in the promotion ing times for buses and trains and a commit- Amsterdam, which came second in the trans- office wall which shows ten different bus types buses. Being a public company, however, gives ment to alert traffic lights to their approach
of walking and cycling, Stockholm excels. For ment to make all of SL’s vehicles accessible for port category, also has a mix of restrictions and we have tested — battery buses, flywheel buses, SL the opportunity to pursue green solutions and give them speedier passage through in-
every square kilometre, it has over four kilome- the handicapped by next year. encouragements. There, geography and policy fuel cell buses, old versions of ethanol buses. SL because such spending is a political choice, and, tersections.
tres of cycle lanes, a figure second only to combine to make cycling one of the leading has been almost an engineer’s playground.” Its says Mr Wallin “so far the political view is that we
Helsinki. This, combined with Stockholm’s small Policy: Stockholm made permanent a trial con- ways to get around. In addition to creating spe- current targets include having one-half of its are ready to pay that premium.”
26 27You can also read