Improving the availability of data and information on species, habitats and sites
←
→
Page content transcription
If your browser does not render page correctly, please read the page content below
Improving the
availability of data and
information on species,
     habitats and sites
                Focus Area A         Handbook on the application of existing
                                     scientific approaches, methods, tools and
                                     knowledge for a better implementation of
                                     the Birds and Habitat Directives

                       Environment
F O C U S    A R E A    A
                                     I M P R O V I N G   T H E   A V A I L A B I L I T Y  O F    D A T A   A N D
   i                             I N F O R M A T I O N   O N    S P E C I E S ,  H A B I T A T S   A N D    S I T E S

Imprint                                                                                                                 Disclaimer
                                                                                                                        This document has been prepared for the European Commis-
                                                                                                                        sion. The information and views set out in the handbook are
Citation                                                                                                                those of the authors only and do not necessarily reflect the
Schmidt, A.M. & Van der Sluis, T. (2021). E-BIND Handbook (Part A): Improving the availability of data and              official opinion of the Commission. The Commission does not
information on species, habitats and sites. Wageningen Environmental Research/ Ecologic Institute /Milieu Ltd.          guarantee the accuracy of the data included. The Commission
Wageningen, The Netherlands.                                                                                            or any person acting on the Commission’s behalf cannot be held
                                                                                                                        responsible for any use which may be made of the information
Authors                                                                                                                 contained therein.
Lead authors:
                                                                                                                        This handbook has been prepared under a contract with the
Anne Schmidt, Chris van Swaay (Monitoring of species and habitats within and beyond Natura 2000 sites)
                                                                                                                        European Commission, in cooperation with relevant stakehold-
Sander Mücher, Gerard Hazeu (Remote sensing techniques for the monitoring of Natura 2000 sites)
                                                                                                                        ers. (EU Service contract Nr. 07.027740/2018/783031/ENV.D.3
Anne Schmidt, Chris van Swaay, Rene Henkens, Peter Verweij (Access to data and information)
                                                                                                                        for evidence-based improvements in the Birds and Habitat
Kris Decleer, Rienk-Jan Bijlsma (Approaches and tools for effective restoration measures for species and habitats)
                                                                                                                        directives (BHD) implementation: systematic review and meta-
Theo van der Sluis, Rob Jongman (Green Infrastructure and network coherence)
                                                                                                                        analysis).
Theo van der Sluis (Co-benefts (ecosystem services) of measures to consolidate the Natura 2000 network)

Acknowledgement is made to all people that have made contributions, that provided comments and remarks
during consultations or have contributed in other ways to this publication. The full list of organisations that have
provided input in any form is included at the end of the handbook, p.87.

Layout
Beáta Welk Vargová, Ecologic Institute

Copyright
European Commission, 2021
Reproduction is authorised provided the source is acknowledged

Copy deadline
31 March 2021

Image credits
Cover page: © Theo van der Sluis;
P. 4: © Hugh Jansman/Wageningen Environmental Research;
P. 32: © Sander Mucher;
P. 60: © Hellen Grig/Shutterstock.com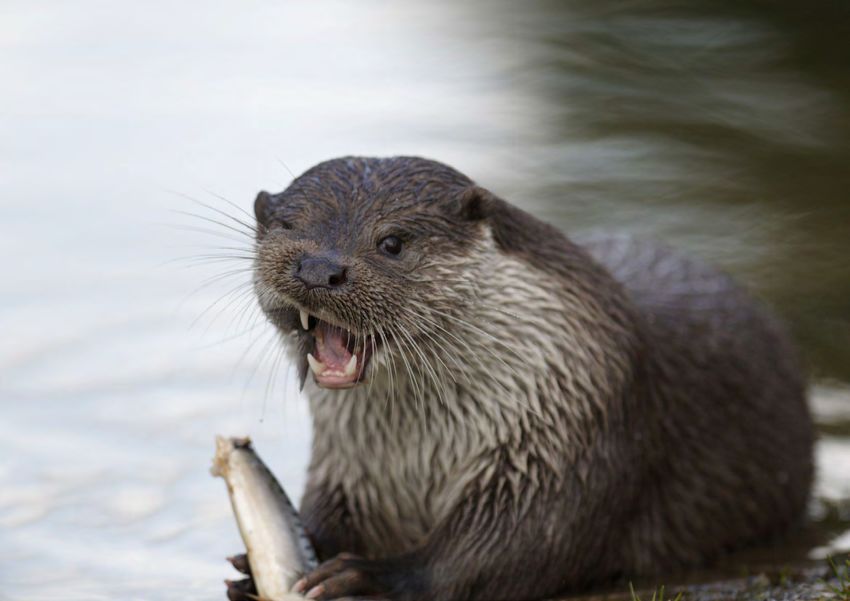
F O C U S    A R E A    A
                                       I M P R O V I N G   T H E   A V A I L A B I L I T Y  O F    D A T A   A N D
     1                             I N F O R M A T I O N   O N    S P E C I E S ,  H A B I T A T S   A N D    S I T E S

Table of Contents                                                                                                         Foreword
I.       Monitoring of species and habitats                                                                           4   By DG ENV

         I.1   Introduction                                                                                           5   With these handbooks, the European Commission intends to
         I.2   Smart sampling and data analysis                                                                       8   support Member State authorities and other stakeholders in
                                                                                                                          making better use of scientific knowledge in implementing
         I.3   Observation technologies                                                                              18   the EU Birds and Habitats Directive. Building on the evidence
         I.4   Modelling approaches                                                                                  19   gathered during the Fitness Check of the EU’s nature legislation,
                                                                                                                          this project made the effort to mobilise the scientific community
         I.5   Key findings                                                                                          22
                                                                                                                          in order to close knowledge gaps, to offer solutions to strategic
         I.6   References                                                                                            26   problems and to enhance the accessibility of scientific informa-
                                                                                                                          tion to policy makers and all players involved in implementation.
               Annex 1: Monitoring of natural habitats                                                               31
                                                                                                                          The handbooks cover the most important areas as identified
II. Contribution of Remote Sensing Techniques for monitoring                                                        40    in the Fitness Check. These comprise methods for monitoring,
    Natura 2000 sites                                                                                                     reporting and assessing conservation status as well as infor-
         II.1 Introduction                                                                                           41   mation and approaches required for effective site and network
         II.2 Current use of Remote Sensing for Natura 2000 monitoring                                               47   management, including setting conservation objectives, prepar-
                                                                                                                          ing management plans, implementing conservation measures
         II.3 Key findings and recommendations                                                                       59   and evaluating their impact.
         II.4 References                                                                                             63
                                                                                                                          By analysing relevant knowledge, evidence, tools, approaches
               Annex 1: Examples of useful satellite imagery                                                         67
                                                                                                                          and good practices and by bringing together scientists and
                                                                                                                          scientific networks of relevance, the handbooks try to bring the
III. Access to data and information                                                                                 68
                                                                                                                          scientific community closer to those that implement the nature
         III.1 Introduction                                                                                          69   directives on the ground.
         III.2 Strategies, approaches and practical examples to improve data and information                         71
               access
         III.3 Key findings and recommendations                                                                      83
         III.4 References                                                                                            85
F O C U S    A R E A    A
                                    I M P R O V I N G   T H E   A V A I L A B I L I T Y  O F    D A T A   A N D
   2                            I N F O R M A T I O N   O N    S P E C I E S ,  H A B I T A T S   A N D    S I T E S

Background
The Birds Directive established an EU-wide protection regime in 1979 for all bird species
naturally occurring in the EU, including a classification by Member States of Special Protection
Areas (SPA) for threatened and migratory birds. This approach was extended through the
Habitats Directive in 1992. The Habitats Directive also provided for the establishment of a
representative system of legally protected areas throughout the EU, known as Special Areas of
Conservation (SAC). Together, SPAs and SACs form the Natura 2000 network. The aim of both
Directives is to ensure the long-term sustainability of the habitats and species they have been
set up to protect. Together the Nature Directives provide a comprehensive protection regime for
certain particularly rare and threatened species and for typical and valuable habitats in the EU.

Between 2014 and 2016, the European Commission carried out a Fitness Check of both
Directives. Based on this comprehensive evaluation it was concluded that the Nature Directives
“remain highly relevant and are fit for purpose”, but also that achieving the objectives and
realizing their full potential will depend upon substantially improving their implementation. The
review proposed that improvements are needed both in their effectiveness and efficiency and in
working in partnership with different stakeholder communities in the Member States and across
the EU in order to deliver practical results on the ground.

The Fitness Check also recognised that the existence of remaining knowledge gaps may have
led to inefficiencies. Specifically important is access to adequate, reliable knowledge, which is
essential for many of the activities associated with the implementation of the directives. The EU
Biodiversity Strategy for 2030 formulates 17 commitments (targets) under two main headings:
Nature Protection and an EU Nature Restoration Plan. The targets and how to measure success
are yet to be defined. Legally binding EU nature restoration targets will be proposed in 2021.
By 2030, significant areas of degraded and carbon-rich ecosystems are restored; habitats
and species show no deterioration in conservation trends and status; and at least 30% reach
favourable conservation status or at least show a positive trend.

The Biodiversity Strategy 2030 highlights nature-based solutions (NBS) as a means to help
achieve a number of the restoration ambitions while linking to other policies (primarily climate
change mitigation and adaptation and urban biodiversity).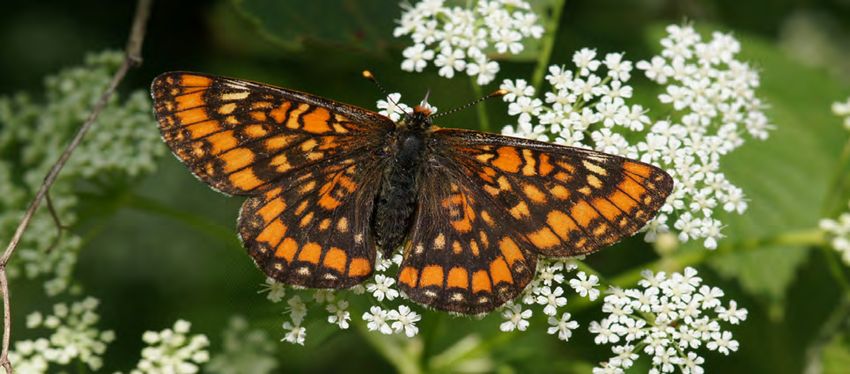
F O C U S    A R E A    A
                                       I M P R O V I N G   T H E   A V A I L A B I L I T Y  O F    D A T A   A N D
       3                           I N F O R M A T I O N   O N    S P E C I E S ,  H A B I T A T S   A N D    S I T E S

The E-BIND handbooks
The E-BIND handbook(s) are meant to assist decision makers, spatial planners, conservationists,
NGOs and other organisations involved in the implementation of the Birds and Habitat
Directives. The handbook(s) contains good practical examples, literature references and links to
relevant websites.

The two handbooks cover the focus areas:

A.         Improving the availability of data and information on species, habitats and sites
B.         Scientific support for successful implementation of the Natura 2000 network

Focus Area A, availability of data and information on habitats and species and sites (this
handbook) seeks to provide in the lack of data and access to data, including remotely sensed
information and monitoring data. The handbook consists of the following three sections:

I.         Monitoring of species and habitats
II.        Contribution of Remote Sensing Techniques for monitoring Natura 2000 sites
III.       Access to data and information

Focus Area B focuses on the effectiveness of the Natura 2000 network and conservation
successes, and therefore looks at habitat management and restoration, as well as the wider
landscape with Green Infrastructure and Ecosystem services. That handbook consists of the
following three sections:

I.         Approaches and tools for effective restoration measures for species and habitats
II.        Green infrastructure and network coherence
III.       Co-benefits (ecosystem services) of measures to consolidate
           the Natura 2000 network
M O N I T O R I N G   O F   S P E C I E S   A N D   H A B I T A T S
4

      CHAPTER A.I.

Monitoring of
species and habitats

      Anne Schmidt & Chris van Swaay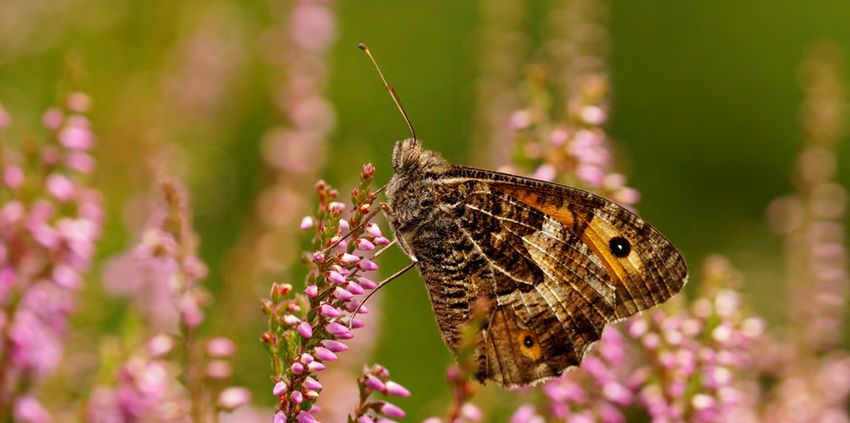
M O N I T O R I N G   O F   S P E C I E S   A N D   H A B I T A T S
   5

I.1 Introduction
This chapter of the handbook focuses on the monitoring of species and habitat types targeted
by the Birds Directive and Habitats Directive both inside and outside the Natura 2000 network.
It discusses both the current practices by e.g. the different Member States (as far as informa-
tion is available) and the opportunities for improvements in terms of approaches, methods and
techniques offered by the scientific community.

The monitoring of species and habitat types is needed for policy purposes, e.g. reporting by the
EU Member States (Birds Directive Article 12 and Habitats Directive Article 17) as well as site
management and protection. Information is needed on the different aspects of the conservation
status of species and habitat types in relation to environmental pressures (e.g. climate change),
human activities and conservation and restoration measures (for more details see DG environ-
ment, 2015).

I.1.1 Definition of monitoring
There is not a common definition for monitoring, but most definitions (see for example side box)              Definition of monitoring
refer to the detection of changes in an object by means of systematic observations.                           Gruijter et al. (2006) defines monitoring as “collect-
                                                                                                              ing information on an object through repeated or
I.1.2 Different perspectives and common ground                                                                continuous observation in order to determine possible
                                                                                                              changes in the object”. Juergens (2006) defines the
The context of the monitoring, the question that needs to be answered by e.g. a policy                        monitoring of biodiversity as “the systematic and
maker or site manager, is very important as it defines the way the data needs to                              focused observation and measurement of present
be collected and analysed. While policy makers are interested in more general figures such                    changes of biodiversity in its various forms (genes,
as national trends in the population size of species, site managers are more interested in the                taxa, structures, functions, ecosystems) usually within
specific characteristics of their site and in the effectiveness of conservation measures. Site                a defined context defined by e.g. a research question
managers often like to perform repeated surveys or surveillances with the purpose to keep track               or a management goal”.
of changes as a consequence of management practices. Regularly repeated surveys can be
considered as a form of monitoring.

The implementation of the Birds and Habitats Directives concerns different type of activities
performed by different type of organisations. The information needed for these type of activities
differs. For example the appropriate assessment (Habitats Directive Article 6.3) requires infor-
mation on the status of a species or habitat type on site level (high spatial resolution), whereas
the conservation status assessment (Habitats Directive Article 17) requires trends on a national
/ biogeographical level (high temporal resolution). There is a trade off in time and space. The
challenge is to harmonise the monitoring (e.g. by means of protocols) as much as
possible in order to be able to use the data and information for multiple purposes. The
ideal solution would be to design a multipurpose monitoring system, but due to the different
user requirements this is a challenging if not impossible task.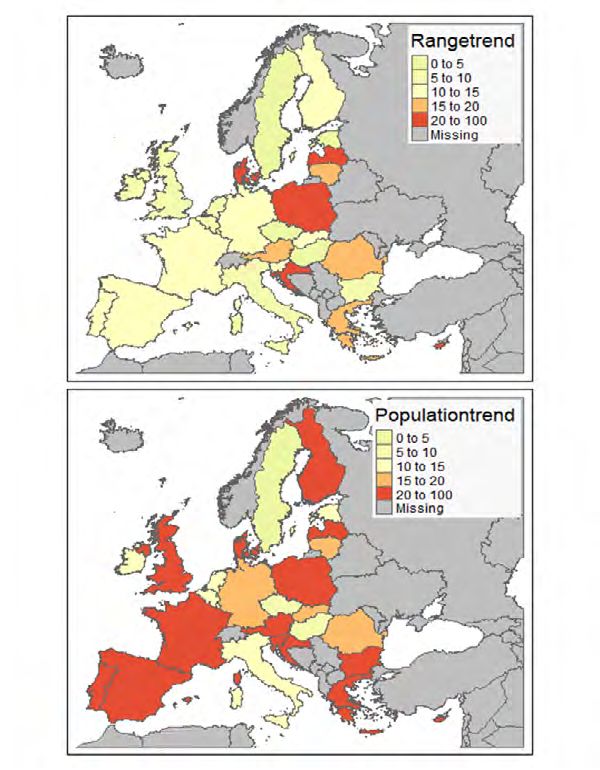
M O N I T O R I N G    O F   S P E C I E S   A N D   H A B I T A T S
   6

GEO-BON is developing the “Essential Biodiversity Variables” (EBVs) framework (Pereira et al.,
2013; Jetz et al., 2019) with the purpose of representing a minimal set of fundamental
observations needed to support multi-purpose, long term biodiversity information
needs at various scales (Walters and Scholes, 2017). The EBVs fall in six classes: genetic
composition, species populations and ranges, species traits, community composition, ecosys-
tem structure and ecosystem function. These EBVs overlap to a large extent with the different
aspects of the conservation status of species (species distribution/range and population, habitat
for species) and habitat types (distribution/range, area, structure and function) of the Birds and
Habitats Directive.

I.1.3 Smart sampling and data analysis methods
Both regularly repeated surveys and monitoring are based on sampling. Many sam-
pling-related methods and techniques are generally applicable: in space, in time and in time-
space (Gruijter et al., 2006).
                                                                                                               Status being the state or condition in a certain
Different monitoring objectives require different sampling designs. That makes it difficult to de-             moment at time (e.g. the total number of birds at a
sign a multipurpose monitoring system. Trend monitoring (e.g. the increase or decline in popula-               certain location at a certain moment in time).
tion size of species) requires other sampling strategies than status monitoring (e.g. the estimate
of the total number of individuals). If one wants to study causal relationships, e.g. the effects of           Trend being a change or direction (e.g. an increase
conservation measures on the status of a species, a specific sampling scheme is required such                  in the number of birds at a certain location during a
as a Before-After-Control-Impact (BACI) design.                                                                certain period).

The conservation status is a legal concept from the Habitats Directive. It describes the status of
a species or habitat type targeted by the Directive and is assessed based on several conserva-
tion status parameters, namely the distribution and range of the species/habitat type, the pop-
ulation size of the species/the habitat area and the area and quality of the habitat for species/
the structure and function of habitat type. In addition (mainly based on the trends) the future
prospects of all these parameters are estimated. The conservation status in fact is based on the
aggregation of the assessment of all these parameters.

In chapter I.2 existing sampling and data analysis methods are described to retrieve information
on the conservation parameters of the species and habitat types.

I.1.4 Observation technologies
There are different ways to collect data on species and habitat types. The most classical way
of data collection is a field survey (field observations and measurements). This is often labour
intensive. Nowadays there are different techniques available for collecting data such as DNA
sampling, camera traps, etc., that can be (partly) automated and might be less labour intensive.

In chapter I.3 a selection of observation technologies is described that are or might be applied
to collect data on species and habitat types.
M O N I T O R I N G   O F   S P E C I E S   A N D   H A B I T A T S
   7

I.1.5 Modelling techniques
Nowadays there are data modelling techniques available by means of which relevant informa-
tion is retrieved from non-structured opportunistic data. These techniques and methodologies
are very valuable to fill in the gaps in data and information needed for the implementation of
the Birds and Habitats Directives, amongst others concerning the distribution of species and
habitat types. These models can help as well to explain the occurrence and/or abundance of
species and habitat types in relation to the environmental conditions including certain pressures
and threats.

In chapter I.4 modelling techniques are described by means of information that can be retrieved
on different conservation parameters of species and habitat types, specifically species and
habitat type distribution.                                                                                   Expert volunteers as an example of
                                                                                                             citizen science
I.1.6 Monitoring approaches, constraints and priorities                                                      The best monitoring strategy depends on the avail-
                                                                                                             ability of resources, tools and people: even for profes-
Different monitoring approaches are followed by the Member States depending on the                           sional monitoring experts are needed and not always
availability of funding and the existence of volunteer networks.                                             available. In biodiversity monitoring and conservation
                                                                                                             volunteers are becoming more and more important.
There is a difference between the MS with regard to state funding and the involvement of
                                                                                                             In the EU there is a strong gradient in volunteer
skilled amateur volunteers. Where state agencies have small budgets, there are fewer skilled
                                                                                                             participation from Northwest to Southeast. E.g.
professionals or amateurs, and socioeconomic conditions prevent development of a culture of
                                                                                                             in the UK, the Netherlands and the Nordic countries
volunteerism (Danielsen et al., 2009). The resulting lack of knowledge about trends in species
                                                                                                             the number of volunteers as well as their knowledge
and habitats presents a serious challenge for detecting, understanding, and reversing declines in
                                                                                                             is high. As a consequence reports on the state of bio-
natural resource values (Danielsen et al., 2009).
                                                                                                             diversity (e.g. the Article 17 reporting) in these coun-
Some MS build on existing monitoring programmes by adapting or extending monitoring                          tries rely heavily on such volunteer expert data. The
schemes. Other MS start from scratch (based on best practices) and develop monitoring pro-                   most important driver for the expansion and sustain-
grams tailored to e.g. the reporting obligations.                                                            ability of volunteer participation is enthusiasm. Bell
                                                                                                             et al. (2008) conclude that “volunteer engagement
Priorities need to be set depending on the resources that are available (in terms of budget                  should be geared towards enlivening and motivating
as well experts and/or volunteers). In order to meet the objectives of the directives the most               participants, by providing an inspiring environment
logic choice is to focus on those species and habitat types that are most threatened and where               where trust, respect, recognition, value and enjoyment
knowledge is lacking.                                                                                        can flourish”.
M O N I T O R I N G   O F    S P E C I E S   A N D   H A B I T A T S
   8

I.2 Smart sampling and data analysis
This chapter focuses on sampling strategies for the collection of data and how to process the
resulting data to obtain reliable estimates (status and trends) on quantitative as well as qualita-
tive aspects of the conservation status of species and habitat types.

I.2.1 Species
The latest Article 17 reporting (2019) still shows large gaps
(Figure 1), especially for population trends. This paragraph will                                                   Rangetrend       Trends
discuss how to obtain both range- and population trends.                                                               0 to 5
                                                                                                                                     One of the major aspects in establishing the conserva-
                                                                                                                       5 to 10       tion status of a species is the trend.
                                                                                                                       10 to 15
With the exception of some large, striking and popular species,                                                        15 to 20
from whom we might know each individual, we have to rely                                                               20 to 100     The Population trend gives an indication of changes
                                                                                                                       Missing
on clever sampling combined with statistical techniques                                                                              in the number of individuals. This is a very sensitive
to obtain a reliable estimate of the status and trend of                                                                             measure, but for many species it requires strict proto-
species’ distribution, range and population.                                                                                         cols and a large effort. It is feasible for popular species
                                                                                                                                     groups, as birds and butterflies. In some cases (e.g. in
We distinguish population trends and distribution trends.                                                                            the Article 17 assessment) distribution on a 1x1km
Each needs a different sampling strategy, and the results don’t                                                                      grid is considered a substitute for population if no
have to be correlated. Dennis et al. (2019) show e.g. that for                                                                       other population unit such as individuals is available.
moths in Scotland, negative population trends showed varied
distribution trends, and an increasing distribution is likely to be                                                                  Distribution trends can be generated from oppor-
driven by a warming summer climate facilitating range expan-                                                                         tunistic records, e.g. as coming from citizen science
sion, whereas population declines may be driven by reductions                                                                        projects. Such trends tend to be less sensitive, and
in habitat quality, changes in land management practices and                                                                         negative trends can remain hidden for some years,
                                                                                                                Populationtrend
warmer and wetter winters. Furthermore population trends are                                                                         depending on the grid size used (e.g. 10x10km in
                                                                                                                  0 to 5
more sensitive to changes, especially declines, where distribution                                                5 to 10            Article 17 reporting, 2x2km in the Area of Occupancy
                                                                                                                  10 to 15
tends to react later and is more sensitive to expansions.                                                         15 to 20
                                                                                                                                     (AOO) of the Red List assessment).
                                                                                                                  20 to 100
                                                                                                                  Missing
Regardless of being used by either professionals or via
citizen science, it is important that methods have been
tested for observer variation. Actually most citizen science
projects have been tested for this (it is a typical question coming
up in reviews), where the relatively expensive monitoring by
professionals is not always evaluated on this point.

Until recently trend monitoring data was almost always                                                                             Figure I.1
collected via strict protocols, thus ensuring high quality                                                                         Percentage species range- or population trend marked as
time-series. Recently “big unstructured data”, which com-                                                                          unknown for all combinations of species and biogeographic
prises large amounts of data collected for loosely defined                                                                         region in the Article 17 report of 2019.
M O N I T O R I N G O F S P E C I E S A N D H A B I T A T S 9 “observatory purposes”, have become an important source of biodiversity data. So far such opportunistic citizen science data can only be used for distribution trends if rigorous models correct for observation, reporting and detection biases (Bayraktarov et al., 2019). Big unstructured data, although abundant, typically have a high level of noise to signal ratio which obscures the signal on real trends (Cunningham & Lindenmayer, 2017). Moreover, data collec- tion without specified (testable) objectives may not measure the “correct” variables to answer questions about biodiversity (Bayraktarov et al., 2019). Population a. Population size Establishing population size in exact numbers can be a challenge. Distance sampling and territory mapping are survey techniques for estimating bird abundance (Bibby et al., 2000; Buckland et al., 2001). But for other, often smaller, animals and plants, it can be Distance sampling = During a transect walk the difficult or even impossible to measure the exact population size, even if they occur in distance to the object is estimated. small and closed populations without contact to other populations. As a consequence in the latest version of the Article 17 reporting for the Habitats Directive, the reporting Territory mapping = Territories are distinguished unit for many species was changed to 1x1km (DG Environment, 2017). But even then this after multiple visits. can rely heavily on sampling intensity. Where relevant and possible detection probability should be taken into account, e.g. by occupancy modelling (see for more details the next paragraph). For pelagic birds, cetaceans and marine reptiles line transect surveys in a regular pattern (e.g. Panigada et al., 2011) in combination with distance sampling make it possible to get population estimates of some of the more common species. Aerial surveys proved to be more efficient than ship surveys, allowing more robust estimates (Panigada et al., 2011). When applying such tech- niques it is important to take detectability into account. For some cetacean species, mark-re- capture methods can be applied using photo-identification of recognizable individuals (Evans & Hammond, 2004). Anyway the power to detect trends in cetaceans is low. Tyne et al. (2016) showed in a test case with a Spinner dolphin that it would take nine years to detect a 5% annual change in abundance (with a power of 80%), so if the trend was a decline, the population would have decreased by 37% prior to detection of a significant decline. Most of the fish and lampreys listed in the Annexes of the Habitats Directive occurring in the sea are anadromous (or have anadromous populations), i.e. they migrate between rivers (where they spawn) and the sea. As there are many barriers in most rivers, migrant fish can be monitored at those sites. b. Population trend Although it can be a challenge to measure the exact population size, there are good techniques available to measure changes in population size: the population trend. For population trends regular counts (one way or the other) are the basis. Counts can be
M O N I T O R I N G   O F   S P E C I E S   A N D   H A B I T A T S
    10

performed by transects, plots, camera-traps etc. It is important that such methods are
harmonised, with each country delivering the same parameters (e.g. the population trend and
the confidence interval), not necessarily standardised: methods may differ in detail (the trend
                                                                                                              European bird monitoring data:
can e.g. be produced from transect counts in one country, and camera-traps in another country).
                                                                                                              harmonised, not standardised
The method should guarantee that the results (the trends and their statistical uncertainty) can
                                                                                                              For the PanEuropean Common Bird Monitoring Scheme
be combined for use at a higher (e.g. European or EU) level. In the calculation of European bird
                                                                                                              (PECBMS) coordinators of national bird monitoring
trends (PECBMS: pecbms.info) and butterfly trends (eBMS via ABLE: butterfly-monitoring.net) this
                                                                                                              schemes deliver their national results to the PECBMS
is already incorporated (see also the example in the side box).
                                                                                                              coordination unit annually. The data delivered are:
This can be achieved by:
                                                                                                              »   the national yearly indices per species,
»   Ensuring that the protocols are well described and maintained, and can deliver the data
                                                                                                              »   the all-sites yearly totals (= the sum of birds
    needed.
                                                                                                                  counted across all sites per year) and their stan-
»   Setting up a method to account for the differences in the results, and combining them at a                    dard errors,
    larger scale or further back in time (when e.g. new techniques were not yet available).
                                                                                                              »   the covariances between the yearly figures.
In this way new techniques and methods can be combined with older, long time-series, thus
                                                                                                              The method to come to the national data can differ
enabling a view back into time but still use new innovative techniques. However calibration is
                                                                                                              from country to country (the field methods do not
needed when detection probabilities change.
                                                                                                              have to be standardised, some countries apply e.g. the
Although statistical techniques offer the possibility to combine many short time-series to                    labour-intensive territory mapping, while others may
produce a long-term trend (see e.g. Hallmann et al., 2017), the power of monitoring is in long                use transect counts), but as the national output is har-
time-series with regular counts. Such counts are made on sample points, transects or plots (fur-              monised (all countries deliver the same set of data)
ther referred to as sample points). Sample points can be arranged in different ways:                          they can be used to calculate European trends.

»   Random: locations are chosen at random, e.g. in the Wider Countryside Butterfly Survey.                   For more details see pecbms.info/methods/
                                                                                                              pecbms-methods
»   Grid: locations are in a strict grid. A typical example is the Biodiversity Monitoring Swit-
    zerland, where species, habitats and water is monitored in a regular grid. In some areas
    (Kantons) the density is higher than in others, because of additional funding. At sea these
    can also be a regular pattern of transects (see e.g. Panigada et al., 2011).

»   Free choice: participants can choose their own favoured location. As good as always these
    will be volunteers, professionals can be directed to random, grid or targeted monitoring
    locations.

»   Targeted: monitoring focuses on specific sites, species or habitats, e.g. species mentioned in
    the annexes of the Habitats Directive or other (policy) relevant species (e.g. in Flanders).

Random and grid based approaches have the advantage of delivering reliable trends, where no
weighting of stratification is necessary. However rare species or habitats are easily missed and
as a result are underrepresented in the network, and often no trends can be calculated for such
rare species, which often are policy-relevant (e.g. because they are mentioned in the annexes of
the Habitats Directive). Furthermore random and grid-based networks are expensive if counts by
M O N I T O R I N G O F S P E C I E S A N D H A B I T A T S 11 people have to be made: volunteers tend to focus on attractive sites, as nature reserves, mean- ing many points have to be counted by professionals. However for automated methods (e.g. camera-traps) this is not an issue, even if a large number of potential volunteers is available (e.g. in the United Kingdom). Automated methods can also be a good alternative for the lack of volunteers or (funding for) professional experts for less known species groups (e.g. bees), but these techniques are new and will need some time to further develop. However the first steps on using camera-traps with image recognition through artificial intelligence (AI) have been made, and in the coming years these will become more generally available. Free-choice networks are mostly used in citizen-science based monitoring: volunteers can choose their own sites. This will lead to an overrepresentation of sites in nature reserves and urban areas. Such data can be corrected by stratified weighting for the more common and widespread species, as long as there is enough data from unattractive sites (usually large-scale agricultural areas). Advantage of this system is that rare and policy relevant species are favoured, and in general there will be enough sites for those species. Targeted monitoring, usually by professionals (but not always, see e.g. www.meetnetten. be), can be an effective way to get population trends of a chosen set of species. It can be costly (certainly if there are many species and many locations), and strict quality control is needed, as detection probabilities for many species are so low, that multiple visits during a year are needed, which is not always done. For species for which the detection probability is known (e.g. butterflies and dragonflies; Van Strien et al., 2013) we can calculate the minimal number of visits (in the case of butterflies and dragonflies: at least three per season), and this will be even more for shy or night-active species (for whom the detection probability will be even lower), for which often experience and a lot of expert knowledge is needed to find them. Another disadvan- tage is that only target-species are counted, and trends in other species will be missed. Also the results cannot be used for community indicators (e.g. Ellenberg indicators in plants). For the calculation of population trends several techniques are available, usually based on a Generalized Linear Models (GLM) or Generalised linear mixed models (GLMM) with poisson dis- tribution, such as TRIM (Pannekoek & Van Strien, 2001, now available as R-package rtrim) and the Generalized Abundance Index (Dennis et al., 2016). Joining efforts by creating a central data and information point can be an effective way to improve the consistency and harmonisation of monitoring methods across the EU. For birds this was created by the European Bird Census Council, who run the Pan-European Common Bird Monitoring Scheme (PECBMS) since 2002. Recently the ABLE-project (Assessing Butterflies in Europe) started, building on the European Butterfly Monitoring Scheme (eBMS) with the ambition to form a central database for all butterfly and moth monitoring counts in Europe. When this project is finished in December 2020, there should be butterfly-monitoring in most EU countries. It would be good to build on these examples and experiences and start up similar initiatives for other species groups.
M O N I T O R I N G   O F   S P E C I E S   A N D   H A B I T A T S
  12

Species distribution                                                                                           From observations to distribution map to
In general distribution maps (giving the distribution, often in units as 1x1km squares                         trends in distribution: the Netherlands as
or 10x10km squares) and distribution trends are not based on systematic counts, but                            an example
on opportunistic data. Long-term monitoring schemes provide high-quality data, often on                        Distribution data is collected in different ways. To
an annual basis, but are taxonomically and geographically restricted. By contrast, opportunistic               illustrate the magnitude, we will give an example using
biological records are relatively unstructured but vast in quantity (Isaac et al., 2014). With the             the information available on the Grayling (Hipparchia
growth of online portals, such as ebird.org, observation.org and iNaturalist.org, usually with as-             semele) in the Netherlands in 2017. Here this is a char-
sociated smartphone apps, next to local and national biodiversity databases (e.g. artportalen.se               acteristic butterfly of dry heathland and coastal dunes.
or ndff.nl), the number of records has grown almost exponentially in recent years. Some of these
online portals lend their data to gbif.org, the Global Biodiversity Information Facility, which held           Targeted data collection, following a protocol:
1.3 billion records in June 2019. GBIF data is freely available for download for research and
                                                                                                               Repeated surveys: every six years almost all nature
conservation. One of the main flaws is that validation and quality control depends on the da-
                                                                                                               reserves (including all Natura 2000 areas) are investi-
ta-source, and as such part of the data can be unreliable. In some countries sharing of distribu-
                                                                                                               gated by professionals on the distribution (at least on a
tion data is not encouraged by the Member States, and as a result the data which is available is
                                                                                                               100m scale) of a group of species (birds, plants, and a
limited and divided over several data sources. In other countries holiday records from natural-
                                                                                                               selection of butterflies, dragonflies and grasshoppers).
ists from other countries could make a considerable difference. Without the uploading of such
                                                                                                               1490 records of the Grayling were recorded in 2017
records to GBIF, or downloading them from GBIF, a lot of valuable distribution data might not be
                                                                                                               under the SNL-protocol.
used. The EU could play a role in encouraging all Member States to make distribution
data available via GBIF.                                                                                       Population monitoring: following a strict protocol for
                                                                                                               population monitoring by volunteers, this also gener-
Distribution data tends to be presence/absence (or better: detection/not detection). Although
                                                                                                               ates distribution data. 407 counts of the Grayling were
part of the data can be real counts, without a protocol or clear method description, such counts
                                                                                                               recorded in 2017 for population monitoring. Targeted
cannot be used easily for (range) trends. Isaac et al. (2014) compared a set of methods that
                                                                                                               distribution research, especially for rare and/or hard to
employ data filtering criteria and/or correction factors to deal with variation in recorder activity.
                                                                                                               detect species, often on the Habitats Directive. As the
They found that simple methods produce biased trend estimates, and/or had low power, and
                                                                                                               Grayling is not on the Habitats Directive, no records
should be avoided. No method was wholly unaffected by all forms of variation in recorder activ-
                                                                                                               were collected in the Netherlands under this project.
ity, although some performed well enough to be useful. Sophisticated methods that model the
data collection process offer the greatest potential to estimate timely trends, notably Frescalo               Opportunistic records: almost all occasional observa-
and occupancy–detection models (see Isaac et al., 2014 for more details).                                      tions in the Netherlands are entered via one of the on-
                                                                                                               line portals (waarneming.nl, telmee.nl), most of them via
It should be noted that especially the most sophisticated models for distribution trends
                                                                                                               a smartphone-app. In 2017 the Grayling was recorded
are also ‘data-hungry’ and require a lot of input. Next to that there is a minimum quality of
                                                                                                               on 2425 occasions as single opportunistic record.
visits required. Ideally participants record all species of a species group. This works well in some
species groups (e.g. butterflies), but fails in other species groups, most notably birds, where re-            After validation all observations are included in the
corders usually don’t have the habit of producing complete species lists. Future sampling therefore            National Database Flora and Fauna (NDFF). Validation
should concentrate on ways of enhancing the quality of species lists per visit.                                is based on the following principles:

In some countries bird atlases have been produced following strict protocols (e.g. Schekkerman                 Automatic validation: all records run through a script
et al., 2012), which allow estimates of the population size as well as for comparison between                  which checks for distribution (is the observation at or
periods and thus establishing species distribution trends. However such atlases are very la-                   near a known location), time of year (does this species
bour-intense and only possible in a limited number of counties and species-groups.                             occur in this stage in this time of the year) and ...
M O N I T O R I N G O F S P E C I E S A N D H A B I T A T S
13
Figure I.2
Grayling (Hipparchia semele). © Chris van Swaay, De
Vlinderstichting/Dutch Butterfly Conservation.
... numbers (are the numbers within the normal range
for the species). If one of the features has declined,
the observations go to an expert validator. All very rare
species are also validated by an expert.
For anadromous fish and lampreys, often recorded only in a few localities in the river systems,
e.g. the spawning grounds or at fish passes, the complete migration route in the rivers from If there is proof entered with the observation (e.g. a
the mouths in the sea to the highest know stretches should be included in the distribution (DG photo or sound recording), part of them go through
Environment, 2017). AI-based image-recognition. This does not work for
all groups yet, but the quality is improving. If there is
Range and range trend are special cases of distribution and distribution trend, as they are
no match between the identification entered by the
based on 10x10km grid cells. Range is defined as ‘the outer limits of the overall area in which
observer and the outcome of the image-recognition,
a habitat type or species is found at present’ and it can be considered as an envelope within
the observation goes to the expert validator. In case
which areas actually occupied occur. The range should be calculated based on the map of the
of any other doubt, the observation also goes to the
actual distribution using a standardised algorithm. A standardised process is needed to ensure
expert validator.
repeatability of the range calculation in different reporting rounds (DG Environment, 2017). The
method for compiling range and range trend is described in detail in DG Environment (2017). The expert validator checks the observations which
Advantages and disadvantages are comparable to other measures of distribution and distribu- were declined by the automatic validation or with pho-
tion trend. tos which were declined.
The expert validator contacts the observer in case of
disagreement or doubt. In most cases of wrong iden-
tification the observer follows the advice of the expert
validator and changes the identification.M O N I T O R I N G O F S P E C I E S A N D H A B I T A T S
14
Habitat for species
A species needs a sufficiently large area of habitat of suitable quality and spatial
distribution to survive and flourish. To measure it we should take into account (DG Environ-
ment, 2017):
» physical and biological requirements of the species; this includes prey, pollinators, etc.;
» all stages of its life cycle are covered and seasonal variation in the species’ requirements is
reflected.
Monitoring the size, quality and spatial arrangement of the Figure I.3
habitat of a species is not only difficult, but also subject Number of species-MS-BGR combinations Assessment of habitat quality and area for non-bird
to changes in the species’ preferences: as a result of 3500 species in the article 17 reporting of 2013–2018
climate change some species have changed their habitat (European Environmental Agency, 2020).
3000
preferences and widened or narrowed down their range of
preferred habitats. Although in some cases vegetation can 2500
be used as a proxy for habitat quality, this often neglects
2000
other requirements of species, i.e. food, shelter, interac-
tions with other species, etc. 1500
Ideally, the data would have been collected from robust 1000
and comprehensive surveys and using methods compa- 500
rable across all Member States. In many cases, however,
the reported information comes from partial surveys that 0
Insufficient or no Estimate based mainly Estimate based mainly Complete survey
were performed for different purposes. In other cases, data available on expert opinion with on extrapolation or a statistically
suitable data do not exist and expert opinion has been very limited data from a limited robust estimate
amount of data
sought. For Habitats Directive species, more than 40 % of
the reported information comes from partial surveys where
the estimates cannot be considered robust or representative of entire biogeographical regions.
In fact, more than 20 % of the information reported by Member States is based only on expert
judgement. The situation for bird data is similar, with more than 30 % of the information coming
from partial surveys and more than 15 % being based on expert judgement. Data quality issues
are further accentuated by numerous gaps in the information reported. Population trends over
the last 12 years, for example, are an essential part of assessing the status at EU level for both
Habitats Directive species and birds. However, trends were unknown or missing in 20 % of Mem-
ber States′ reports for breeding birds and 30 % or wintering birds as well as in 34 % of reports
for Habitats Directive species (European Environmental Agency, 2020) (Figure I.3).
A Species Distribution Model (SDM) can be a way to combine requirements. Such explanatory
modelling assess the availability of habitat for a species. This is discussed in more detail in
chapter 4 (Modelling approaches).M O N I T O R I N G O F S P E C I E S A N D H A B I T A T S 15 I.2.2 Habitat types This subchapter gives an overview of sampling strategies and data analysis methods that are/ can be used for the monitoring of the habitat types of Annex I of the Habitats Directive. Habitat typologies There is an interpretation manual of the European Union Habitats (EU, 2013). This manual forms the basis for all habitat classification and is regularly updated, e.g. with the expansion of the EU Member States. Although there is this common habitat typology, the interpretation of the habitat types of Annex I of the Habitats Directive differs per Member States and even within a MS (Evans, 2010). For the Habitat Directive Article 17 reporting information is needed on the area (status and trends), the distribution (status and trends) and the structure and function or ‘quality’ of the habitat types on national and biogeographical level. For site management and protection similar but more detailed information is needed on these parameters. Lengyel et al. (2008b) compared the different approaches and methods applied by MS to moni- tor habitat types, based on the descriptions (meta data) of habitat monitoring schemes collected within the EUMON-project and stored and maintained in the EUMON database. Lengyel (2008a) sees promising developments in habitat monitoring, amongst others that most schemes monitor distribution and species composition of habitats as well environmental parameters. The main weakness is that in more than half of the schemes it is not clear how the collected data are analysed as this is not described in the monitoring schemes. Advanced statistics may be used infrequently because in most schemes sampling sites are selected based on expert/person- al knowledge rather than predefined criteria derived from a sampling theory. Lengyel (2018) pleads for benchmarking of monitoring of species and habitat types. By means of sharing and comparing different data and sampling analysis techniques e.g. between the Mem- ber States or site managers one can learn from each other and step by step improve these methods and possibly qualify or certify methods. As explained in the former chapter on species, it is not necessary to use the same methodologies as long as the protocols are well described and lead to a similar outcome that can be compared. Since 2008 developments have been made by the MS in habitat monitoring, but an extensive review of the current state of the art is missing. Ellwanger (2018) made a more recent com- parison between the monitoring approaches of a selection of MS and concludes that there are considerable differences in terms of data sampling (e.g. sampling size) and data analysis (e.g. statistical robustness). Habitat area Habitat area is often monitored based on repeated/ sequential habitat mapping. Different approaches for habitat mapping are used, varying from field mapping to the
M O N I T O R I N G   O F   S P E C I E S   A N D   H A B I T A T S
  16

interpretation of aerial photographs and automated classification of remote sensing
imagery. Often a combination of different methods is applied depending on the habitat type
or group of habitat types. The Czech Republic for example have interpreted Habitats Directive
Annex I habitats by the national system of biotopes and carried out an extensive field mapping
of the entire Czech Republic in the fine-scale 1:10.000 (Guth & KuČera, 2005). A large amount
of field data was collected of all biotopes, mainly about their distribution, spatial dimensions,
and qualities.

Due to differences in the interpretations e.g. in the field or of the aerial photographs, trends
in habitat area are often difficult to assess or uncertain and inaccurate. As Lengyel (2008a)
concludes the information on how the data is analysed (meta data) to derive trends in
area of habitat types is often missing in the national report of the MS. Therefore the
uncertainty of the trends is unclear. A system with qualifiers as is being used by IPBES might
be applied, but it requires transparency in the methods being applied by the different member
states. It is up to the Member State to indicate the quality class without further information.

Remote sensing techniques might offer means to harmonise the data collection on the area and
as well the distribution of habitat types as these methods are (partly) automated and can be
standardised to a certain extent. Not all habitat types can be that easily detected by means of
remote sensing so field work is often necessary.

Habitat distribution
Habitat distribution is estimated based on mapping as well as modelling. The problem
is that habitat maps are often only available of a selection of sites and not on a national or bio-
geographical scale. Habitat distribution modelling can give a more complete estimate of habitat
distribution (see chapter I.4).

Habitat structure and function
Structure and function is the key aspect for the assessment of the conservation
status of habitat types as it provides information on the ‘quality’ of the habitats
(Ellwanger et al., 2018).

The assessment of habitat quality according to the requirements of the EC is based
on the criteria habitat structures, habitat functions and typical species. Structures
are considered to be the physical components of a habitat type. These will often be formed by
assemblages of species (both living and dead), but can also include abiotic features, such as
gravel used for spawning. Functions are the ecological processes occurring at a number of tem-
poral and spatial scales and they vary greatly between habitat types. Typical species are those
which mainly occur in a habitat type or at least in a subtype of a variant of a habitat type (DG
Environment, 2017). The species composition of a given habitat type may vary geographically.

Individual attributes or sub-criteria have to be selected for each habitat type to as-
sess habitat structure and function (habitat quality). The data collected on the different
M O N I T O R I N G   O F   S P E C I E S   A N D   H A B I T A T S
  17

criteria and/or subcriteria of the aspect structure and function needs to be aggregated and
weighted (similar to the final assessment of the conservation status of a habitat type).

Ellwanger (2018) concludes that most of the monitoring approaches (of the MS included in his
study) for assessing the structure and function of habitat types are based at least partially on
sampling. The number of sampling areas depends on the occurrence of the habitat type (rare vs
widespread) and other ecological and methodological factors, as well as efforts and costs. Each
MS selects the sample plots differently. Overall, most MS conduct at least a partly systematic
selection based on the distribution, the size (area) and characteristics of habitat types and/or
other factors. Most MS used permanent plots, include area within and outside the Natura 2000
network and have standard assessment schemes.

None of the MS included in the study of Ellwanger (2018) made a statement on theoretical
statistical strength of the samples for monitoring. This corresponds to what Lengyel (2008)
concluded ten years before. There is a lack of a proper description of the data collection and
analysis protocols that are used and on the certainty the information derived from these data.

a. Typical species

Concerning the typical species most MS investigate plant species only (Ellwanger,
2018), most probably because plants are quite easily linked to habitat types (the
habitat typology is heavily based on plant communities), whereas for fauna species
it is much more difficult. Some fauna species depend on more than one habitat type (e.g. for
breeding, foraging, resting etc.) which is much more difficult. In case animals species are in-
vestigated the most frequently, used animal groups are birds, butterflies and beetles.
This is probably due to the fact that these species groups are relatively easy to de-
tect and recognize and often observed by large volunteers networks. In The Netherlands
a method has been developed to assess structure and function of habitat types based on trends
in the distribution of typical plant species (Janssen et al., 2020).

b. Aggregation methods

There are different approaches for the aggregation of the data (assessment criteria)
for the purpose of structure and function assessments. For each habitat type an assess-
ment needs to be performed of the area (km2) in good condition. As the condition is defined by
different sub-parameters there should be a weighing between these sub-parameters as well
a threshold for good condition. Measurements are being made at single plot and at site level.
These measurements need to be aggregated on the level of a bio-geographical region. Different
approaches are being followed by the Member States.
M O N I T O R I N G   O F   S P E C I E S   A N D   H A B I T A T S
  18

                                                                                                               Monitoring the Eurasian otter by means of
                                                                                                               DNA analysis of faeces (spraints)
I.3 Observation technologies                                                                                   Population size of European otters (Lutra lutra) was
                                                                                                               estimated in Pollino National Park (southern Italy) by
This chapter focuses on innovative techniques for the observation of species and                               genetic typing of fresh feces collected in the field.
habitat types. It is not meant to be complete. A selection of techniques has been made                         Of 187 fecal samples gathered, 185 (98.9%) yielded
and examples are given for certain species and habitat types. There is no description on data                  otter DNA, 77 (41.2%) were successfully typed, and
collection and analysis techniques in this chapter as this has been described in chapter 2, but                23 different genotypes were identified. A nonlinear
different type of observations might require different sampling and data analysis methods. The                 regression between the number of typed spraints and
costs of the different techniques are missing in this chapter. A lot of these techniques are still             the cumulative number of identified genotypes was
being developed (e.g. the automated detection of species on images) and therefore more experi-                 repeated after randomization of the sample until it
mental, which makes it difficult to estimate the costs of an operational system.                               gave an estimated otter population of 34–37 animals
                                                                                                               (0.18–0.20 otters/km of watercourse). The applied
I.3.1 Species                                                                                                  method represents a valuable conservation tool, com-
                                                                                                               bining the advantages of an indirect survey with the
DNA sampling                                                                                                   accuracy of an exhaustive census (Prignioni, 2006).
DNA barcoding is a method of species identification using a short section of DNA from a specific
gene or genes. A distinction can be made between destructive DNA sampling, where the                           The last recorded presence of the Eurasian otter
species are sampled and identified in a destructive way (Yu et al., 2012; Ji et al., 2013)                     (Lutra lutra) in the Netherlands dates from 1989 and
and non-destructive sampling where samples are collected from the environment of                               concerned a dead individual. In 2002 a reintroduction
the species called environmental DNA (eDNA). eDNA – defined here as: genetic material                          programme was started, and between June 2002 and
obtained directly from environmental samples (soil, sediment, water, etc.) without any obvious                 April 2008 a total of 30 individuals (10 males and
signs of biological source material – is an efficient, non-invasive and easy-to-standardize sam-               20 females) were released into a lowland peat marsh
pling approach (Thomsen & Willerslev, 2015; Baird et al., 2012). Environmental DNA has been                    in the north of the Netherlands. Noninvasive genetic
obtained from ancient as well as modern samples and encompasses single species detection to                    monitoring based on the genetic profiles obtained
analyses of ecosystems. In the future, we expect the eDNA-based approaches to move from sin-                   from DNA extracted from otter faeces (spraints)
gle-marker analyses of species or communities to meta-ge-                                                      was chosen for the post-release monitoring of the
nomic surveys of entire ecosystems to predict spatial and                                                      population. To this end, the founding individuals were
temporal biodiversity patterns (Thomsen & Willversev, 2015).                                                   genotyped before release and spraints were collected
This technique is being used for different species groups                                                      in the release area each winter from 2002 to 2008.
(Bohman et al., 2014; Rees et al., 2014). In case the moni-                                                    During winter 2007/08 47 individuals were identified,
toring is focused on a single species e.g. rare withdrawn or                                                   41 of which originated from mating within the release
nocturnal species, information can be collected from faeces,                                                   area. This study demonstrates that noninvasive
feathers, eggs, hairs etc. An example of this is the Eurasian                                                  molecular methods can be used efficiently in post-re-
otter (see side box).                                                                                          lease monitoring studies of elusive species to reveal a
                                                                                                               comprehensive picture of the state of the population
Camera Trapping                                                                                                (Koelewijn et al., 2010).
A camera trap is a remotely activated camera that is equipped
with a motion sensor or an infrared sensor, or uses a light
beam as a trigger. Originally camera traps were mainly used                                                  Figure I.4
to study relatively large animals (e.g. birds and mammals)                                                   Otter (Lutra Lutra) © Hugh Jansman from Wageningen
for studies of nest ecology, detection of rare species, and                                                  Environmental Research (WENR)
M O N I T O R I N G O F S P E C I E S A N D H A B I T A T S
19
estimation of population size and species richness. Rovero & Figure I.5
Zimmermann (2016) provide a guide to the use of camera Example of a camera trapping set-up. (From www.marine-
trapping for the most common ecological applications and terrein.nl/insecten-tellen-met-een-slimme-camera).
research. At present cameras are being developed to moni-
tor small mammals and other species groups (Hobbs et al.,
2017). Monitoring invertebrate with camera
traps and automatic image
Acoustic monitoring Recent developments also include the use of camera
Passive acoustic monitoring, or just ‘acoustic monitoring’, traps to detect and count insects after identifying
involves surveying and monitoring wildlife and environments them via automatic image recognition. Although still
using sound recorders (acoustic sensors). These are deployed in a testing phase, this new development could make
in the field, often for hours, days or weeks, recording acoustic it possible in future to monitor flying insects outside
data on a specified schedule. After collection, these recordings the relatively well-studied groups as butterflies and
are processed to extract useful ecological data – such as de- dragonflies, for which sound methods and many
tecting the calls of animal species of interest – which is then volunteers are available. In the Netherlands Naturalis
analysed similarly to other types of survey data (Browning Biodiversity Centre, EIS and the Radboud University
et al., 2017). Acoustic sensors are small, increasingly afford- are developing together with COSMONiO Imaging
able and non-invasive, and can be deployed in the field for BV and with advise of Waarneming.nl (see www.
extended times to monitor wildlife and their acoustic surroundings. The data can then be used waarnemingen.nl) such a system. One of the goals is
for estimation of species occupancy, abundance, population density and community composition, to monitor the biomass of insects based on the counts
monitoring spatial and temporal trends in animal behaviour, and calculating acoustic proxies for of certain species.
metrics of biodiversity. Provided the challenges of data analysis are addressed carefully, this
can make acoustic sensors valuable tools for cost-effective monitoring of species and ecosys-
tems and their responses to human activities (Browning et al., 2017). Examples of acoustic
monitoring are the monitoring of bats and the monitoring of sea mammals.
I.3.2 Habitat types
Remote sensing
There are several scientific studies available that propose habitat monitoring methods based
on remote sensing (see chapter A.II on Remote Sensing Techniques) (Van den Borre et al., 2011;
Corbane et al., 2014; Nagendra, 2013; Lucas et al., 2015).
I.4 Modelling approaches
This chapter focuses on modelling approaches by means of which relevant information can be
extracted on several aspects of the conservation status of species and habitat types. This chap-
ter specifically focuses on species and habitat distribution modelling.You can also read