www.acbee.anu.edu.au Australian National University - Tom Kompas
←
→
Page content transcription
If your browser does not render page correctly, please read the page content below

.

                  Tom Kompas
        Australian Centre for Biosecurity and
              Environmental Economics
    Crawford School of Economics and Government
            Australian National University
            www.acbee.anu.edu.au
The Problem
Close proximity between countries and international
trade and tourism increases the probability of an
incursion and the spread of exotic diseases and pests;
ones that can do great harm, and in some cases can be
potentially devastating to local industry, animal and
human health, and the environment.

Traditional Measures
• Pre-border measures and border quarantine (i.e.,
  preventing a potential incursion at the border).
      • Limits on imports
      • Airport inspections, and inspections of shipping
        containers and contents
• Local surveillance programs (preventing spread in
  the local environment).
      • Screening and local awareness
      • Surveillance traps (e.g., insects)
      • Blood screening and visual inspection
• Containment and eradication programs.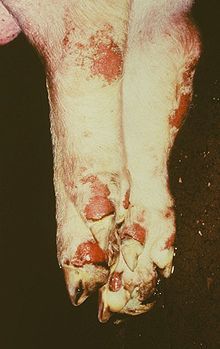
The Economic Puzzle
How much should be spent, or what costs should be
incurred, for pre-border measures and border quarantine,
surveillance and containment/eradication activities to
protect human, plant and animal health as well as the
environment? How to allocate resources across various
threats?
    •   Ban imports and close airports?
    •   Spend $0 on quarantine and surveillance?
    •   Spend all of GDP on quarantine and surveillance?
    •   Eradicate? Contain? Neither?
    •   How to allocate resources across various threats?
    •   Who Pays? Cost Sharing?
Rate of Discount?
Level of rate, time dependent, hyperbolic?
Non-Market Valuation?
Contingent value, stated preference?
Value of Information?
Model selection, parameter estimates, value to
precision?
Forward Projections?
Spatial and density spread? The economics of containment vs.
eradication
A Simple Spread Model for an Invasive
Infected (N)

       Q(N)

                                        Time
Containment and Eradication
The role of cost-benefit analysis (CBA) after an incursion,
or for a potential incursion
Infected (N)
A
Time
Note: The potential size of benefits depend on size of initial entry and the
choice of early detection, for a given eradication/containment exercise. FMD is endemic in Vietnam, recently as part of a pan-Asian
epidemic beginning in the 1990s.
Presumed vectors: border trade with China and Cambodia
(virus-strain specific).
Vietnam currently follows a containment campaign, with
vaccination to protect non-infected animals, along with control
on movements, surveillance and border quarantine. Many
areas are in the process of being declared FMD free, and
Vietnam cooperates with SEAFMD 2020 in an effort to
eliminate FMD from the region.
Vietnam has recently committed roughly $34 million USD for
the containment and eradication of FMD (from 2006 to 2010),
spearheaded by an extensive vaccination program.Newly Infected Cows and Buffaloes: The Effect of the
Vaccination Program (data from January 2006, by month, and
September 2006, by month) Key benefit (foregone loss) parameters
2006 2007 2008
Cattle unit price per kg (USD) 1.62 1.82 2.19
Milk price (farm gate) per litre
(USD) 0.31 0.38 0.44
Weight and value loss due to FMD 40% 40% 40%
infected animal (%) N(1,0.05) N(1,0.05) N(1,0.05)
Weight per cow/buffalo (kg) 250 250 250
Compulsory culled percentage (%) 2% 2% 2%
Ratio of dairy in the total herd (%) 0.63% 0.63% 0.70%
Milk produced per dairy cow (litre/
year) 3,816 3,816 4,027
Loss in milk production due to FMD 50% 50% 50%
infected animal (%) N(1,0.05) N(1,0.05) N(1,0.05)
Meat production (tonnes) 224,746 273,651 298,739 Key cost parameters
2006 2007 2008 2009 2010
Management expenses 16,313 40,625 55,625 55,625 55,625
Training 34,188 34,188 34,125
Awareness campaign 69,688 69,688 104,500 104,500 104,500
International conference 4,375 4,375 4,375
Domestic conference 1,250 1,250 1,313
Outbreak reporting 8,375 8,438 8,438
Sending sample abroad for virus type
separation 2,250 2,250 2,250
Research on causes of FMD 20,000
Development of epidemiology map 2,750 2,750 2,750
Blood test analysis and virus study 7,500 18,750 123,125 123,188 123,188
Sterilization chemical 15,000 15,000 118,125 118,125 118,125
Labour cost for vaccination 1,093,750 1,093,750 1,100,500 1,100,500 1,100,500
Control zone vaccine for buffaloes &
cows 1,789,992 2,563,130 2,416,376 2,668,688 2,668,688
Buffer zone vaccine for buffaloes &
cows 2,986,853 1,523,375 2,715,037 2,852,750 2,852,750
Contingency fund 1,158,323 1,193,384 4,041,523 4,041,523 4,041,523
Vaccine under Decision 738 for
buffalos & cows 190,646 504,225
Total Cost 7,328,064 7,021,926 10,747,998 11,118,148 11,118,148CBA for vaccination against FMD in Vietnam
Forward projections of new annual infections (based on
stratified Monte Carlo draws, conditioned by monthly
2006-2008 data on new infections, assuming ongoing and no
further gains from vaccination).
3000
2500
2000
1500
1000
500
0
2009
2010
2011
2012
2013
2014
2015
2016
2017
2018
2019
2020
2021
2022
2023
2024
2025
2026
2027
2028
2029
2030
2031
2032
2033
2034
Net Present Value   Net Present Benefit   Net Present Cost
Year                                                                 Benefit Cost Ratio
        (million USD)        (million USD)        (million USD)

               Standard             Standard              Standard            Standard
       Mean                 Mean                 Mean                 Mean
                 Error                error                 error               Error

2040 1,443       324       1,719       320       276         44        6.38     1.57

2027   1,290      263       1,463      260       173         19        8.56     1.81
0.3
5.0%
90.0%
5.0%
4.17
9.11
0.25
0.2
0.15
0.1
0.05
0
2
4
6
8
10
12
14
1610
12
0
2
4
6
7
8
9
1
3
5
2006 11
2007
2008
2009
2010
2011
2012
2013
2014
2015
2016
2017
2018
2019
2020
2021
2022
2023
2024
2025
2026
2027
2028
2029
2030
2031
2032
2033
2034
2035
2036
2037
Benefit-Cost Ratio (BCR), 2006-2040
2038
2039
2040Local Surveillance Measures
Infected
(N) Surveillance
S(N) Expenditures S(N)
A
Earliest Detection
S(N) Natural
Detection
Natural Detection
Point
Optimal ‘Early
Detection’ N
Earliest
Q(N) detection
TimeResearch Design: Optimal Surveillance
• Benefit: Surveillance ensures ‘early detection’, lowering economic and
environmental losses and pest/disease management costs.
• Tradeoff: The more early the detection the more expensive the
surveillance measure.
• Objective: Find optimal surveillance expenditures to minimize:
• Economic losses (e.g., plant and animal losses, damage to the
environment, biodiversity losses, trade bans, etc.)
• Eradication and management costs of any pest/disease
incursion
• Surveillance expenditures (e.g. monitoring, the cost of setting
and monitoring traps, etc.)
• Method: Stochastic (Optimal Control) Bioeconomic Model with a
Jump-Diffusion Process.Hawkweed Distribution Map Current infestation 500 ha - 1000 ha (Williams, Hans, Morgan and Holland, 2007)
Area in hectares   Hawkweed spread

                       Time
Model Parameters
Annual growth rate: 8% - 8.6% (Scott 1993; Johnstone, Wilson and
Bremner, 1999); discount rate 5%
Maximum Carrying Capacity: 26,996,700 ha (DAFF)
Production loss percentage: 15% on improved land and 5% on
unimproved land (Grundy 1989)
Production loss value: $60-$100 ha;$959 million for grazing; $289
million for perennial horticulture (1996 land use commodity) (Brinkley
and Bomford 2002)
Eradication cost: 65 – 83 AUD / ha with multiple treatments (Espie,
2001; Ministry of Agriculture, Food and Fisheries, British Columbia,
Canada)
Natural detection: 100 ha
Maximum annual surveillance cost to detect Hawkweed when the
spread is equal or greater than 1 ha: 200,000AUD per year, or approx 4
million NPV over time.Costs in million AUD
Costs of controlling Hawkweed
HectareCosts in million AUD
Sensitivity with the discount rate
HectareCosts in million AUD
Sensitivity with the damage per hectare
HectareCosts in million AUD
Sensitivity with the incursion probability
HectareBorder Quarantine Measures
Infected
(N) Quarantine
E(N) Expenditures E(N)
Zero entry
N
Q(N)
Time
Zero entry Optimal Border Quarantine
Benefit: Less initial entry gives smaller damages (or more benefits)
over time, prior to full saturation.
Trade-off: The smaller is initial entry the more expensive is the border
quarantine program
Objective: Minimize all expenditures: damages (e.g., losses in plant
and animal health, damage to the environment, trade restrictions,
containment and eradication costs) plus the cost of the quarantine
program itself.
(Equivalent to equating the marginal benefits of having less damages
to the marginal costs of quarantine expenditures.)
Conditional on:
Probability of entry
Spatial and density spread, and E(N) function
Prices and costs that may vary over time, discount rateTom Kompas
tom.kompas@anu.edu.au
http://www.crawford.anu.edu.au/staff/tkompas.php
www.acbee.anu.edu.auYou can also read