www.marine.unc.edu/Paerllab - NEIWPCC

Page created by Leon Cortez
 
CONTINUE READING
www.marine.unc.edu/Paerllab - NEIWPCC
www.marine.unc.edu/Paerllab
www.marine.unc.edu/Paerllab - NEIWPCC
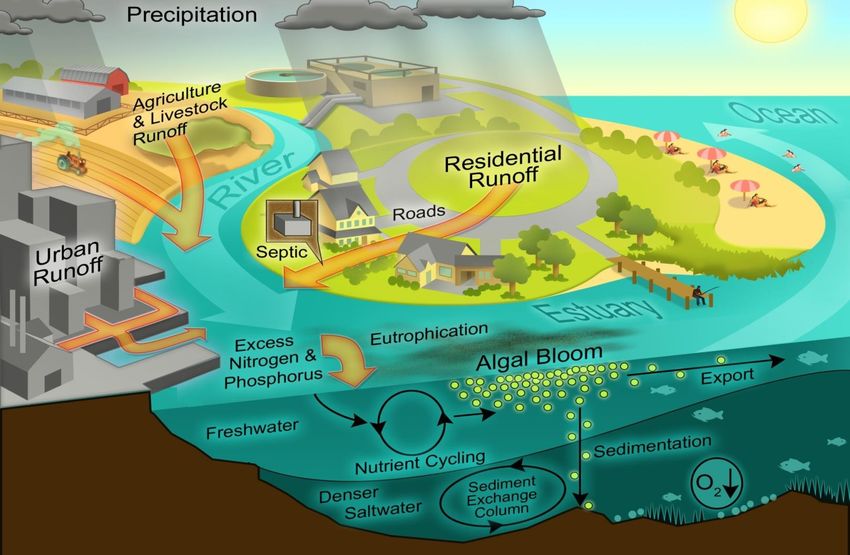
Nutrient over-enrichment: “The most rapidly-expanding
  threat to water quality and ecological condition”. “Scales of sources and impacts
are increasing“ (UNESCO-IHP 2014; US National Academy of Sciences 2010, 2016)
www.marine.unc.edu/Paerllab - NEIWPCC
Choptank R,
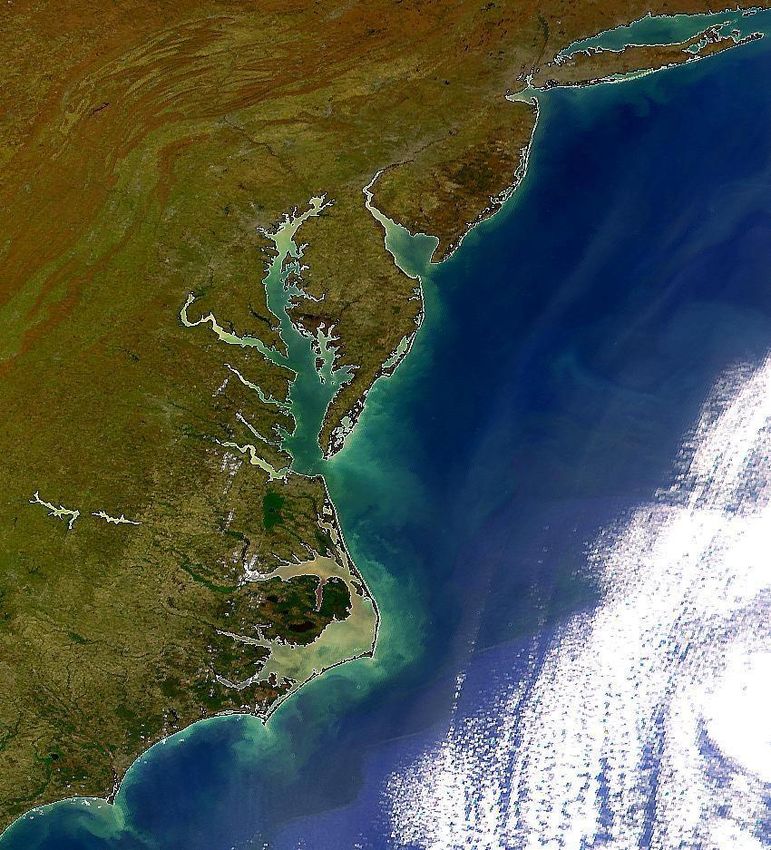
                   Mississippi R.                                          Chesapeake Bay
                   Basin

                 Neuse R. Estuary, NC

Flow corrected N concentrations, Trent R. at Trenton, NC: From Lebo 2016

                        Trends in watershed/airshed nutrient inputs
www.marine.unc.edu/Paerllab - NEIWPCC
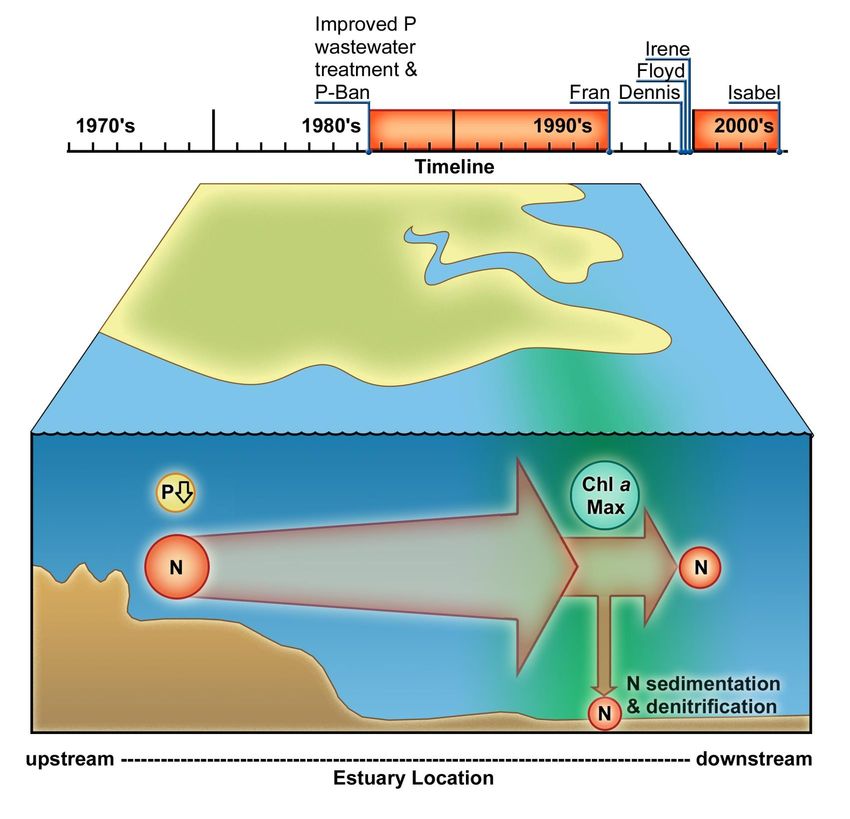
Nutrient-eutrophication dynamics along the freshwater-
                    marine continuum

 Dogma: Primary production controlled by P availability in freshwater,
                      N in marine ecosystems.

    However: Accelerating anthropogenic N & P loading has altered
           nutrient limitation and eutrophication dynamics

 Results: Human-impacted systems reveal a complex picture and hence
                 a challenge to nutrient management
www.marine.unc.edu/Paerllab - NEIWPCC
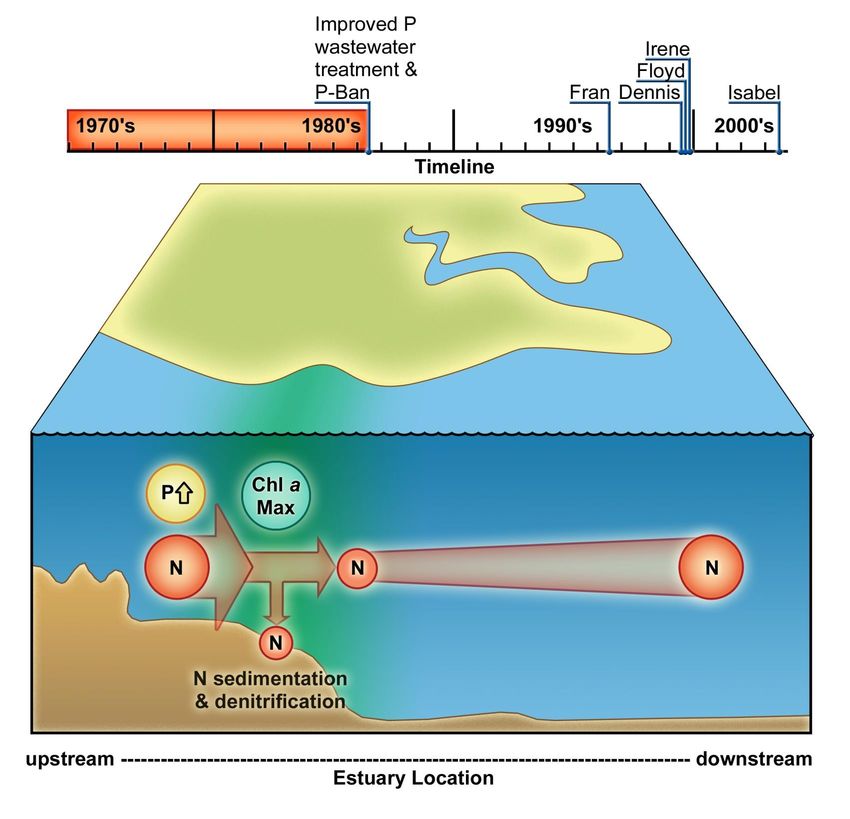
Estuarine and coastal systems: What do the data tell us?
   DIN Loading vs. primary production in a range of N. American
                       and European estuaries

                                                    Nixon 1996
www.marine.unc.edu/Paerllab - NEIWPCC
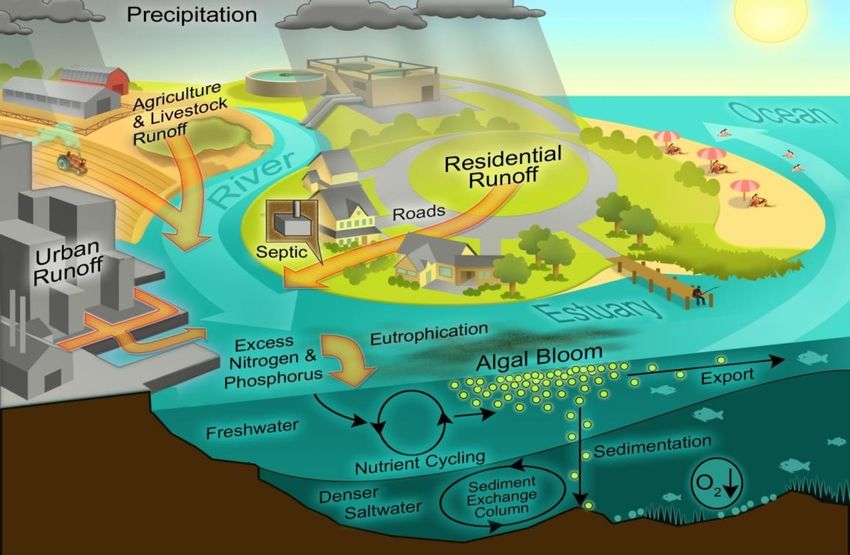
However: N +P enrichment is
    often most stimulatory: Nutrient
         stimulation of primary production in the
                    brackish Baltic Sea

                Baltic Sea 2000, Bioassay A                                                         Baltic Sea 2000, Bioassay A
                Primary Productiv ity                                                               Chlorophyll
     700                                                                            0.13
               Legend
                  Day 1                                                             0.12
     600          Day 2
                  Day 3                                                             0.11

                                                            Chlorophyll a ( g/l)
     500                                                                             0.1

                                                                                    0.09
DPM/ml

     400                                                                            0.08

                                                                                    0.07
     300
                                                                                    0.06

                                                                                    0.05
     200
                                                                                    0.04
     100                                                                            0.03
               l    l             Fe          e   e                                             l           ol
            tro nito      N   P           A
                                        DT N+F P+F    N+
                                                        P
                                                                                          t   ro       it        N   P   Fe DTA +Fe +Fe   N+
                                                                                                                                             P
           n                           E                                               on           nn                          N   P
         Co Ma   n                   +                                                                                      +E
                                  Fe                                                  C       Ma                         Fe

                                                                                                                 Moisander et al. 1994; 2003
www.marine.unc.edu/Paerllab - NEIWPCC
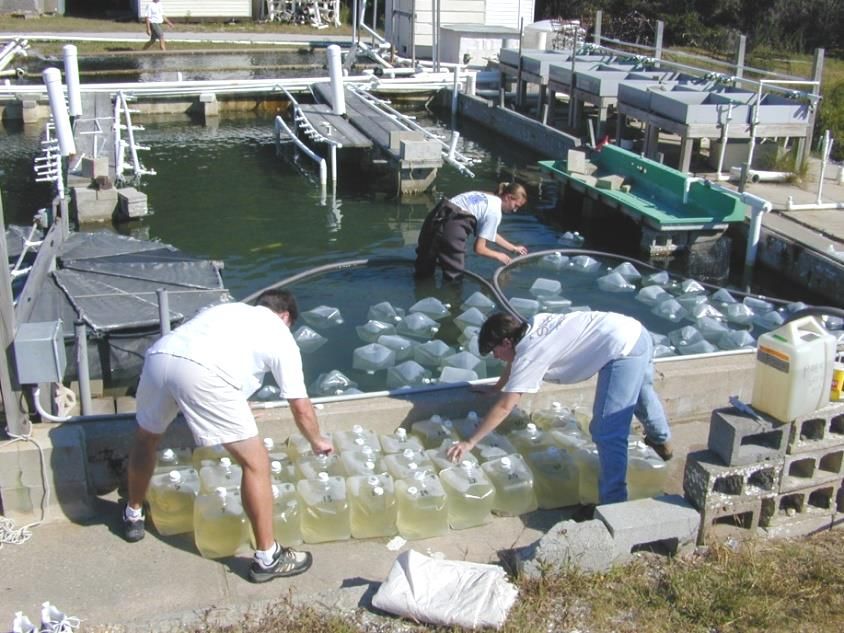
Nutrient limitation dynamics in the Chesapeake Bay, USA

         Chesapeake                  Fisher et al. 1998
                                                           (Fisher et al. 1998)
www.marine.unc.edu/Paerllab - NEIWPCC
Chlorophyll (μg / L)

   Neuse R. Estuary

                                      Paerl et al., 1995; Gallo 2006
www.marine.unc.edu/Paerllab - NEIWPCC
Clarifying impacts of nutrient loading on
eutrophication of the Neuse R. Estuary

        1. How did we get there?

    2. Evaluating management actions

3. The rationale for N and P input controls
www.marine.unc.edu/Paerllab - NEIWPCC
Some history
Effects of Upstream P reduction
but no parallel N reduction
on the Neuse River Estuary, NC
phytoplankton biomass (Chl a)

                                  P detergent ban,
                                  WWT improvements


        
Chlorophyll a
                                                                            Neuse River Estuary
Distance Downstream (km)

                           70                                                                              70
                           60                                                                              60
                                                                                                                                                                                        60
                           50                                                                              50
                           40                                                                              40                                                                           45
                           30                                                                              30
                           20                                                                              20                                                                           30
                           10                                                                              10
                                                                                 1986                                                                                                   15
                            0                                                                              0
                           -10                                                                            -10
                                                                                                                                                                                        0

                                                                                                                                              Apr
                                                                                                                      Apr

                                                                                                                                                                            Jul
                                                               Apr

                                                                                                                Jan

                                                                                                                                  Oct

                                                                                                                                                          Oct

                                                                                                                                                                                  Oct
                                                                                                                                                                      Apr
                                                                                                                            Jul

                                                                                                                                                    Jul
                                       Apr

                                                                                              Jul
                                 Jan

                                                   Oct

                                                                           Oct

                                                                                                    Oct
                                                                                        Apr

                                                                                                                                        Jan

                                                                                                                                                                Jan
                                             Jul

                                                                     Jul
                                                         Jan

                                                                                  Jan

                                       1986                    1987                     1988                           1994                    1995                   1996
                                                                                                          P detergent ban,
                                                                                                          WWT improvements
Freshwater P Reduction w/o Parallel N Reduction
     Exacerbated Estuarine Eutrophication

           What’s the mechanism?
Need: Reduce Estuarine Primary Production (Chl a) by
          Establishing an N Input Threshold
      Recommendation: 30% N Input Reduction
         Proof: Using dilution bioassays to evaluate
         mandated 30% N input reduction = TMDL)

                                       Seasonal Effect of 30% Reduction in N Concentration
                                                        84 Hour Incubation
                                                        1.4

                              (proportion of control)
                                                                                                                                Legend

                               Assimilation Number
                                                        1.3                                                                        M15
                                                                                                                                   SFB
                                                        1.2

                                                        1.1

                                                          1

                                                        0.9

                                                        0.8

                                                        0.7

                                                        0.6

                                                        0.5
                                                              st         er        ry     ri l        y     ne       st        er        ry
                                                           ugu       t ob      nua      Ap       Ma       Ju      ugu      t ob     r ua
                                                          A        c        Ja                                   A       c         b
                                                                 O
                                                              1997                               1998
                                                                                                                        O       Fe     1999

Assimilation No. is an indicator of growth potential = Productivity / Chl a
Nutrient load and
    phytoplankton growth
 response in Himmerfjärden,
           Sweden

Courtesy: Ulf Larsson & Ragnar Elmgren
         Stockholm University
The Himmerfjärden case:
Coastal area with large Sewage
treatment plant,
P removal since 1976, N removal started in 1993
(50%) & 2000 (80%). No N removal 2004-2008
RESULTS ON PHYTOPLANKTON (Chl a)?

           Plant loads , tonnes/ year              H4

                                                  B1

       H4 =Eutrophicated station
       B1= Reference station
The results: Reducing DIN inputs reduced Chl a and controlled CyanoHABs

                                              Inorganic Nitrogen (DIN), annual mean
                                           180
                                           160                                 B1
                                           140                                 H4

                        DIN µgL-1
                                           120
                                           100
                                            80
                                            60
                                            40
                                            20
                                             0
                                             1975 1980 1985 1990 1995 2000 2005 2010

                                                      Surface Chlorophyll, annual mean
                                       8
                                                                                                B1
                                       7
                                                                                                H4
                                       6
                  Klorofyll a µgL -1

                                       5
                                       4
                                       3
                                       2
                                       1
                                       0
                                       1975    1980      1985    1990     1995    2000   2005        2010

                                           Larsson and Elmgren, In Prep.
Developing a N loading-bloom threshold

                              Himmerfjärden Chlorophyll a                 Lowering nitrogen
                               vs tot-N from sewage plant                 discharge below 400
                          9                                               tonnes/yr clearly
                                                                          reduced local
                          8
                                                                          phytoplankton biomass.
Chlorophyll mg/m3 0-14m

                          7
                          6
                          5
                          4
                          3
                          2       y = 0.0068x + 2.44
                          1            r2 = 0.71
                          0
                              0        200     400     600   800   1000
                                   Total nitrogen, tonnes/yr                    Source:
                                                                                Ulf Larsson, pers.comm.
Florida FW-marine continua : Cylindrospermopsis raciborskii,
       rapidly-proliferating, toxic N2 fixing cyanoHAB
     High      P uptake and storage capacity

     High      NH4+ uptake affinity (competes well for N)
          N additions (NO3- + NH4+) often significantly increase growth (chl a
           and cell counts) and productivity

     N2    fixer (can supply its own N needs)

     Tolerates        low light intensities
          Eutrophication/decreased transparency favors Cylindro
          Often in water column with other cyanoHABs
St. Johns R. System, FLorida: Nitrogen and Phosphorus
    Effects on CyanoHAB Growth and Bloom Potential
            (Cylindrospermopsis raciborskii)

              mg C m -3 h-1
                              300
                              250    1 day
                                     4 days
                              200
                              150
                              100
                               50
                                0
                                    control           +N   +P          +N&P
                         14000
                                     C. raciborskii
                         12000
              units/ml

                         10000
                          8000
                          6000
                          4000
                          2000
                             0
                                    control           +N   +P           +N&P

Take home message: Cylindrospermopsis raciborskii is opportunistic
   Dual N & P input constraints will likely be needed to control it
                                                                Piehler et al, 2009
Eutrophication dynamics in lakes in coastal watersheds: Lake Taihu, China.
Nutrients (Lots!) associated with unprecedented human development in the Taihu Basin (Jiangsu
Province). Results: Cyano blooms have increased to “pea soup” conditions within few decades
Qin et al., 2010
Xu et al., 2015
The “nutrient problem” in Taihu in a nutshell
               N & P inputs exceed what’s needed for balanced algal growth.
                    Result: “Runaway” eutrophication
                                       A
                                                     & toxic CyanoHABs                                                         B
        90                   station-1       station-2                       350                  station-1        station-2
        80                                                                   300
        70
        60                                                                   250

                                                                   DTN/DTP
TN/TP

        50                                                                   200
        40                                                                   150
        30                                                                   100
        20
        10                                                                    50
         0                                                                     0
             J F MAMJ J AS ONDJ F MAMJ J AS ONDJ F MAMJ J ASOND                    J F MAMJ J AS ONDJ F MAMJ J ASONDJ FMAMJ J AS OND
             2006           2007           2008                                    2006           2007           2008
                                                                               Nutrient (N&P) ratios in Taihu
        25                     station-1          station-2 C
        20                                                                         Redfield (balanced growth)
                                                                                           15:1 (N:P)
        15
PN/PP

        10                                                                            HYPOTHESIS
         5                                                                   Dual (N & P) reductions will be
         0                                                                   needed to stem eutrophication
              J F MAMJ J AS ONDJ F MAMJ J AS ONDJ F MAMJ J ASOND                     and CyanoHABs
              2006            2007            2008                                                       Xu et al., 2010
Effects of nutrient (N & P) additions on phytoplankton production (Chl a)
            in Lake Taihu, China: Both N & P inputs matter!!

                                                
                      
                                    

                                         Xu et al. 2010; Paerl et al. 2011; 2016
What about large lakes (Erie)?

J. Chaffin et al., (2013) “Nitrogen Constrains the Growth of Late Summer
Cyanobacterial Blooms in Lake Erie” Advances in Microbiology 3, 16-26.
Lets ask the lakes? Whole-Lake Fertilization Experiments
             (ELA, Quebec, NWT, Sweden)

Co-Limitation Dominant     Wurtsbaugh et al., 2012; Paerl et al., 2016
Large lakes and reservoirs in which algal blooms (mostly cyanobacteria)
                have been shown to be N & P stimulated

                                                            Lake Erken    Lake Peipsi
                                             Lake District (UK)       Lakes (N. Germany)
                                Lake 227
  Klamath Lake                                                             Lake Balaton
   Great Salt Lake                  Lake Erie
     Rocky Mtn. Lakes           Midwest Lakes
                                                                                                     Lake Taihu
                                    Lake Okeechobee
                                                                                             Lake Dianchi
                 Lake Atitlán          Lake Valencia
                                          Orinoco Floodplain
                                                Lakes                            Lake Victoria

                       Lake Titicaca
                                                  Coastal Lagoons
                                                      (Brazil)                                                 Murray-Darling System
                                                                                                                           Lake Taupo/
                                                                                                                           Lake Okaro

 Sources:        Havens et al., 2003; Elser et al. 2007; North et al., 2007; Lewis & Wurtsbaugh 2008; Conley et al., 2009;
 Moisander et al., 2009; Lewis et al. 2011; Abell et al., 2011; Özkundakci et al., 2011; Paerl et al., 2014; and many others.
Why does N limitation persist in eutrophic systems? N2 losses from
 shallow eutrophic systems exceed “new” N inputs via N2 fixation

    Annual estimates of ecosystem N2 fixation, denitrification, and net ecosystem N2 flux
    in lakes.
    Location                  N2 Fixation          Denitrification          Net N2 Flux
                             (g N m-2 yr-1)         (g N m-2 yr-1)         (g N m-2 yr-1)1
    Lake 227 (ELA)2                0.5                    5-7                -6.5 – -4.5
    Lake Mendota2                  1.0                    1.2                    -0.2
    Lake Okeechobee2            0.8 – 3.5             0.3 – 3.0              -2.2 – 0.5
    Lake Erken2                    0.5                    1.2                    -0.7
    Lake Elmdale                  10.43                   184                    -7.6
    Lake Fayetteville             10.63                   234                   -12.4
    Lake Wedington                 7.03                   124                    -5.0
    1Net negative N flux represents reactive N loss, positive represents gain; 2Paerl and
                    2
    Scott (2010); J.T. Scott (unpublished data); 4Grantz et al. (2012)
                 3

      Conclusions: 1. N2 fixation does NOT meet ecosystem N
                              demands
           2. More N inputs will accelerate eutrophication
     3. We Gotta get serious about controlling N (as well as P) !!
Conclusion: N limitation persists in aquatic ecosystems,
            even ones receiving anthropogenic N enrichment

Bottom line: Need to reduce N along with P to control eutrophication and
                           bloom formation
Conclusions & Management Recommendations
•   Freshwaterestuarinecoastal continuum N & P co-limited. Strongly
    influenced by human activity.
•   In most ecosystems, N2 fixation does not meet ecosystem N
    demands, perpetuating N limitation (i.e. more N inputs lead to
    accelerated eutrophication).
•   Recommendation: Continue P reductions, but parallel N reductions
    are needed to control eutrophication along the continuum.
•   Continuous water quality monitoring critical for gauging long-term
    success and needs to adjust N&P loadings.
Thanks!!

                      www.unc.edu/ims/paerllab/research/
Thanks to:
A. Joyner
T. Otten
B. Peierls
B. Qin
M. Piehler
K. Rossignol
S. Wilhelm
H. Xu
G. Zhu
TLLER “crew”

           82667701

         Additional support: Nanjing Instit. of Geography and Limnology,
        Chinese Academy of Sciences & Ministry of Science & Technology
You can also read