19 Predictions for 2020 - Colliers International
←
→
Page content transcription
If your browser does not render page correctly, please read the page content below

1

                                                                                             December 2019

19 Predictions for 2020                                           6. There is little currently forecast that could interrupt
For the last monthly report of each year we provide                  the current positive path in rental growth and solid
                                                                     sales activity in the office sector in 2020. The
our top predictions for the following year.
                                                                     biggest hurdles the sector is likely to face in 2020
In no particular order:                                              are rising operating costs and suitable stock for
All sectors                                                          investors to purchase.
1. The Reserve Bank of New Zealand’s pursuit for                  Industrial
   financial stability and resilience has seen major              7. Industrial vacancy is at, near or approaching lows
   banks required to increase ‘tier-1’ capital within a              in Auckland, Wellington and Christchurch. Many
   seven-year timeframe from 1 July 2020. While we                   locations regionally also face similar constraints.
   may see a lower or stable OCR in 2020, interest                   This will likely result in an increase in the demand
   rate margins are likely to rise as well as term                   for land and the continuation of new-build
   deposit rates. This may see more properties                       construction. The markets that have delivery
   come to market as owners look to take advantage                   constraints and can’t cater to demand within a
   of the strong gains made in recent years.                         suitable timeframe is where the greatest level of
2. As is typical in an election year, there will be a                price growth will eventuate.
   period of disruption before and after the 2020                 8. The industrial sector’s resilience in the hard times
   election here and in the US as people absorb the                  and strong performance in the good times is why
   political promises and the eventual outcomes.                     it is a favoured asset class for many investors
   Those focussed on long-term performance will                      globally. Rental growth and firm yields for prime
   benefit the most.                                                 property are likely to continue in 2020. This will
3. The New Zealand Government’s announcement                         lead to a resurgence in investor appetite for
   to take advantage of low lending rates and                        secondary premises where greater financial
   increase infrastructure spending will likely boost                rewards could eventuate in 2020.
   economic activity in 2020 and provide further                  Retail
   support for high employment rates. This will
   enhance occupier fundamentals.                                 9. 2020 will likely see a growing divide between the
                                                                     ‘haves’ and the ‘have nots’ as customers become
4. The property industry will benefit from measuring                 increasingly selective in their spending. Flagship
   the sustainability and societal impacts of the                    shopping centres, large format retail, and easily
   sector through environmental, social and                          accessible, centralised destination strip retail will
   governance initiatives. As is apparent abroad,                    remain popular amongst consumers and continue
   investigation     and       implementation      of                to report positive metrics for owners. Others will
   recommendations from the Financial Stability                      find conditions testing.
   Board’s Task Force on Climate-Related Financial
   Disclosures could also feature.                                10. Data and technological advancements will play an
                                                                      important role in retail next year. There will be a
Office                                                                rise in capturing customer data to provide greater
5. The convergence in tenants nationally searching                    levels of personalisation and improving the
   for higher quality, more flexible, productive, well-               customer journey. Further, if a 5G network is
   priced and environmentally sustainable premises                    successfully implemented in 2020, it would lead to
   will grow. Many main cities will need more supply,                 a number of new initiatives to explore. These
   but construction sector complexities and                           include more immersive customer experiences,
   constraints highlight only a handful of companies                  stock and delivery efficiencies and a smoother
   with big balance sheets may be able to provide                     transition between online and offline purchasing.
   the right solutions.

 1       New Zealand Research Report | December 2019 | Colliers International Research
Residential
11. Residential price growth outside of Auckland will               moderate improvement anticipated in 2020. However, a
    remain positive in 2020 but will most likely start to slow      resurgence in 2021 is expected due to an array of events
    from significant highs. It is also likely that 2020 will        including the 36th Americas Cup, APEC and many World
    mark the start of the next growth phase in Auckland.            Cup sporting fixtures.
    Annual price rises in Auckland are likely to remain 16. Momentum in sales activity is anticipated to improve in
    modest to start with, but it sets the scene for higher          2020, as a number of hotel owners look to divest assets
    rates of growth in 2021.                                        to take advantage of buoyant trading conditions and a
12. Developers will continue to focus on delivering higher          strong appetite from investors to place capital into this
    density, more affordable homes, catering to the                 asset class. Low interest rates and strong returns are
    ongoing demand from first home buyers and the re-               likely to sharpen yields in 2020.
    emergence of investors who are being driven by
                                                                Rural & Agribusiness
    historically low interest rates. Those providing the right
    product in the right place at the right price will 17. Pastoral: Bank lending criteria will remain tighter
    outperform in 2020.                                             continuing to have an impact on sales volumes in all
                                                                    sectors, but predominantly in the $5m pastoral sector.
13. There is likely to be more announcements of build to
                                                                    However, more buyers will enter the market as they
    rent projects in 2020 in Auckland. This is due to the
                                                                    realise opportunities for securing quality farming assets
    solutions the sector solves for a changing
                                                                    are at their best value level for some years.
    demographic, ongoing increases in rents and the
    return of capital value growth.                             18. Forestry: The One Billion Trees Programme and carbon
                                                                    pricing will continue to influence the demand for land
Hotels
                                                                    suitable for afforestation in 2020. International pressure
14. Many of NZ’s key markets remain at or near record
                                                                    for sustainably produced timber will see forest returns
    performance levels in 2019, with further growth
                                                                    rebound from the May 2019 price correction with further
    anticipated in 2020, albeit at more modest levels than
                                                                    demand for mid and late-rotation forest crops.
    seen in recent years. Growth will come from increasing
    international visitor arrivals, forecast to reach 4 million 19. Viticulture and Horticulture: The demand for grapes and
    by the end of 2020, robust domestic demand and                  grape land appears to be in balance with limited liquidity
    sustainable new supply/inventory coming to market.              and Overseas Investment office restrictions for overseas
                                                                    purchases to acquire. 2020 will see the continued
15. The Auckland hotel market which is experiencing
                                                                    unsatisfied land demand for kiwifruit in the Bay of Plenty,
    increasing levels of new supply, fewer marquee events
                                                                    pip fruit in Tasman and Hawke's Bay, cherries in Central
    and another deferment in the NZICC opening, has had
                                                                    Otago and hops in Tasman.
    a fall in both occupancy and room rates in 2019 with a
                                                     New Zealand Key Economic Indicators – December 2019

                                          Jun-19      Jun-19       Mar-18       Q-o-Q       Jun-18      Y-o-Y
                                                                                                                 2020F*   2021F*   2022F*
                                         (yr rate)   (qtr rate)   (qtr rate)   Change      (yr rate)   Change

  GDP Growth                               2.1%        0.5%         0.6%        -0.1%       3.2%        -1.1%    2.3%     2.5%     2.5%
  Current Account (% of GDP)              -3.4%         NA           NA          NA         -3.2%       -0.2%    -2.7%    -3.8%    -3.8%

                                         Sep-19       Sep-19       Jun-19       Q-o-Q      Sep-18       Y-o-Y
                                                                                                                 2020F*   2021F*   2022F*
                                         (yr rate)   (qtr rate)   (qtr rate)   Change      (yr rate)   Change

  CPI Inflation                            1.5%        0.7%         0.6%        0.1%        1.9%        -0.4%    1.6%     1.9%     1.9%
  Net Migration Gain (000's)                54          12           12           0           50         5        46       36       36
  Retail sales (ex-auto)                   4.7%        1.2%         0.7%        0.5%        3.5%        1.2%     4.0%     4.9%     4.9%
  Unemployment Rate                        4.2%        4.2%         3.9%        0.3%        4.3%        -0.2%    4.1%     4.1%     4.1%

                                         Sep-19      Sep-19       M-o-M        Sep-18      Y-o-Y       10 Year
                                                                                                                 2020F*   2021F*   2022F*
                                         (yr rate)   (yr rate)    Change       (yr rate)   Change      Average

  Tourist Numbers Growth                   2.3%        2.3%        -0.1%        5.5%        -3.2%       4.6%     4.5%     4.0%     4.7%

                                          Oct-19     Sep-19       M-o-M         Oct-18     Y-o-Y       10 Year
                                                                                                                 2020F*   2021F*   2022F*
                                         (yr rate)   (yr rate)    Change       (yr rate)   Change      Average

  Official Cash Rate                      1.00%       1.00%        0 bps        1.8%       -75 bps     2.31%     1.00%    1.00%    1.00%
  90 Day Bank Bill Rate                    1.2%        1.2%        0 bps        1.9%       -74 bps      2.5%     1.2%     1.2%     1.2%
  10 Year Government Bond                  1.2%        1.2%        0 bps        2.6%       -146 bps     3.5%     1.4%     1.8%     1.8%
  Floating Mortgage Rate                   5.3%        5.3%        0 bps        5.9%       -59 bps      6.0%     5.1%     5.1%     5.1%
  3 Year Fixed Housing Rate                4.6%        4.6%        0 bps        5.0%       -44 bps      6.0%      NA       NA       NA
  Consumer Confidence                       118         114         4%           115         3%          120      NA       NA       NA

  NZD vs US                                0.64        0.63          0%          0.65        -3%        0.74      0.64     0.65     0.65
  NZD vs UK                                0.51        0.51          0%          0.50        2%         0.51      0.50     0.47     0.47
  NZD vs Australia                         0.93        0.93          0%          0.92        1%         0.87      0.92     0.87     0.87
  NZD vs Japan                              68          68           1%           74         -7%         75       70       73       73
  NZD vs Euro                              0.58        0.58          0%          0.57        2%         0.60      0.59     0.62     0.62
Source: NZIER, Colliers International Research
*March year forecast

  2         New Zealand Research Report | December 2019 | Colliers International Research
Office Office development pipeline by development stage
The current CBD office development pipeline indicates a strong Under Construction
pipeline of projects as more space is expected to be added in Proposed
2020 addressing shortages of quality office space in Auckland Possible
and Wellington. Refurbishment / Seismic Strengthening
In Auckland, the imminent completions of Commercial Bay, One
55 Fanshawe Street and 10 Madden Street will add over 63,000 90
Floor Area (Thousands)
sqm of prime office space to the market. Average weighted pre- 80
commitment of space across the three buildings are already at 70
82%, reflecting occupiers demand for prime office space. The 60
completion of these buildings will also mark the first time since 50
2016, that a Premium graded building is added to Auckland’s 40
Office market. 30
In the capital, refurbishment and seismic strengthening of stock 20
continues to dominate the supply pipeline. However, successful 10
pre-commitments for new-builds could see development of new -
spaces such as Bowen Campus Stage 2, One Whitmore and Auckland CBD Auckland Wellington
Site 9 Kumutoto. Recently completed Bowen State Building now Metro
renamed as Defence House is fully tenanted by Defence Force Source: Colliers International Research
New Zealand and Ministry of Defence.
Transaction Activity by Sector 2017 – 2019 YTD
(Value of Transactions)
Industrial
Commercial Mixed & Vacant Land
Our analysis of commercial and industrial sales data suggests Industrial
investors have a strong focus for industrial properties, with Office
Retail
almost 50% of the total value of 2019 transactions.
48%
In Auckland, initial yields are hitting record lows with a recent
38%
transaction in Albany for just under 3.5%. However, the range is
more consistent between 4.8% and 6.5%. In Wellington, yields 42%
continue to edge down as well as in Christchurch where
industrial active remains particularly strong. Sales activity in the 18% YTD
12% 2017
regions show similar, strong market conditions. 9% 2019*
18% 22% 31%
Solid activity in manufacturing, imports and exports, the growth
of the transport and storage sector due to online retail growth 19%
24%
and a significant pipeline of infrastructure announced by the 19%
Government will all assist occupier fundamentals and
strengthen investor confidence further.
*Provisional
Source: CoreLogic, Colliers International Research
Retail
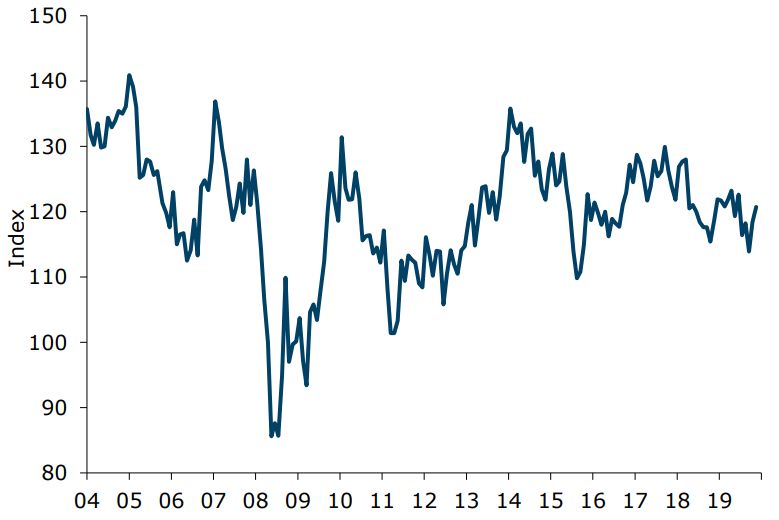
ANZ-Roy Morgan Consumer Confidence Index
Growing optimism underpins the retail sector as we enter the
festive season. The November 2019 ANZ-Roy Morgan NZ
Consumer Confidence survey found confidence to lift 3 points to
121 following on from a 4 point rise last month, lifting the series
just above the historical average of 120. Confidence rose most
sharply in Canterbury, while Wellington remains the most
optimistic region.
Sales data from Stats NZ supports the well-performing sector.
Total volume of retail sales rose 1.6% in the September 2019
quarter, while value rose 1.4%, representing an increase of
$333 million in retail sales nationally. The largest increase was
in electrical and electronic goods, up 4.4%, followed by
department stores, up 3.5%. We expect these positive trends to
lead us into the new year. Source: ANZ Research, Roy Morgan, Colliers International
Research
3 New Zealand Research Report | December 2019 | Colliers International Research
Annual Market Indicator Review – Q3 2019
                                                   Prime Rents                         Prime Capital Values
                                                                                                                                                Vacancy Rate
                                                   (% Change)                              (% Change)
        Property Sector
                                             12-Months to Sep-19                       12-Months to Sep-19                             2018                      2019

               Office                                Net Face                           Based on Net Face                                       Overall (June)

         Auckland CBD                                   1.1%                                    14.4%                                  6.2%                      5.0%

               Office                               Gross Face                          Based on Net Face                                       Overall (June)

        Wellington CBD                                  4.2%                                     3.0%                                  7.7%                      5.9%
               Office                                Net Face                           Based on Net Face                                   Overall (September)
   Auckland Metropolitan                                1.4%                                    11.4%                                  6.7%                      5.6%
            Industrial*                              Net Face                           Based on Net Face                                     Overall (August)
            Auckland                                    2.2%                                    11.8%                                  2.0%                      2.1%
            Industrial*                             Gross Face                          Based on Net Face                                   Overall (November)
           Wellington                                   8.4%                                    15.1%                             2.1% (2017)                 1.5% (2018)
            Industrial*                              Net Face                           Based on Net Face                                   Overall (September)
          Christchurch                                  -1.6%                                    3.1%                             1.9% (2016)                     N/A
               Retail                                Net Face                           Based on Net Face                                       Overall (June)
         Auckland CBD                                   0.0%                                     0.0%                                  3.8%                      5.7%
               Retail                               Gross Face                          Based on Net Face                                       Overall (June)
        Wellington CBD                                  2.7%                                     3.0%                                  6.8%                      4.2%

Source: Colliers International Research
*Combination of industrial office & warehouse at a ratio of 20:80.

Recent Commercial Property Sales

         26 Sharpe Road, Hamilton                                      186 Queen Street, Auckland                                       25 Broadway, Auckland
       Hamilton | $27,765,521 | 5.57%                                 Auckland | $15,000,000 | 5.0%                                  Auckland | $19,450,000 | 5.8%

For more information contact:

Chris Dibble                                                    Alan McMahon                                Chris Farhi                                 Colliers International
                                                                                                            Director                                    Level 27, SAP
Director                                                        National Director
                                                                                                                                                        Tower
Research & Communications                                       Strategic Advisory                          Strategic Advisory
                                                                                                                                                        151 Queen Street
                                                                                                                                                        Auckland
Adrian Goh                                                      David White                                 Caity Pask                                  +64 9 358 1888
Research Analyst                                                Director                                    Senior Analyst
                                                                Strategic Advisory                          Strategic Advisory
Anna Sizova
Research Analyst

Disclaimer: Whilst all care has been taken to provide reasonably accurate information, Colliers International cannot guarantee the validity of all data and
information utilised in preparing this research. Accordingly Colliers International New Zealand Ltd, do not make any representation of warranty, expressed
or implied, as to the accuracy or completeness of the content contained herein and no legal liability is to be assumed or implied with respect thereto.
   4         New Zealand Research Report | December 2019 | Colliers International Research
© All content is Copyright Colliers International New Zealand Ltd, Licensed REAA 2008 and may not be reproduced without expressed permission.

You can also read