1Q17 Results - CPFL Energia
←
→
Page content transcription
If your browser does not render page correctly, please read the page content below
1Q17 Results
Disclaimer

    This presentation may contain statements that represent expectations about future events or results according to
    Brazilian and international securities regulators. These statements are based on certain assumptions and analyses
    made by the Company pursuant to its experience and the economic environment, market conditions and expected
    future events, many of which are beyond the Company's control. Important factors that could lead to significant
    differences between actual results and expectations about future events or results include the Company's business
    strategy, Brazilian and international economic conditions, technology, financial strategy, developments in the utilities
    industry, hydrological conditions, financial market conditions, uncertainty regarding the results of future operations,
    plans, objectives, expectations and intentions, among others. Considering these factors, the Company's actual
    results may differ materially from those indicated or implied in forward-looking statements about future events or
    results.

    The information and opinions contained herein should not be construed as a recommendation to potential investors
    and no investment decision should be based on the truthfulness, timeliness or completeness of such information or
    opinions. None of the advisors to the company or parties related to them or their representatives shall be liable for
    any losses that may result from the use or contents of this presentation.

    This material includes forward-looking statements subject to risks and uncertainties, which are based on current
    expectations and projections about future events and trends that may affect the Company's business.

    These statements may include projections of economic growth, demand, energy supply, as well as information
    about its competitive position, the regulatory environment, potential growth opportunities and other matters. Many
    factors could adversely affect the estimates and assumptions on which these statements are based.

2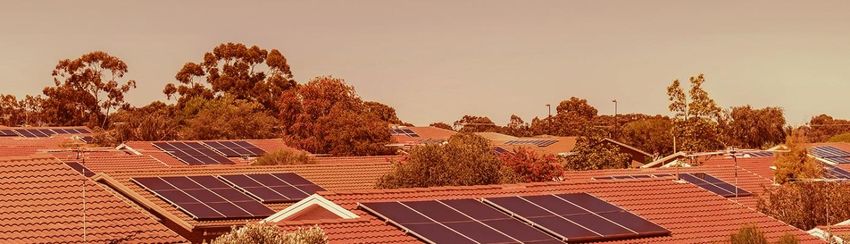
1Q17 Highlights
Stable load in the concession area (-0.4%)1
Contracted demand is being preserved: -0.6% Off Peak and -0.2% Peak (Mar-17 vs. Mar-16)1,2
Increases of 27.7% in Net Operating Revenue and of 15.6% in EBITDA
Investments of R$ 681 million3
Net debt of R$ 13.8 billion and leverage of 3.30x Net Debt/EBITDA4
CPFL Paulista tariff adjustment, in Apr-17, with an average effect of -10.50% to
be perceived by the consumers
RGE Sul tariff adjustment, in Apr-17, with an average effect of -6.43% to be
perceived by the consumers
Current status of State Grid transaction: appraisal report of the Unified Tender
Offer in preparation, as approved in the EGM of March 27, 2017
Launch of Envo, a company that will offer solutions in distributed solar
power generation, manly to residential clients
2016 Annual Report released on April 5, 2017
1) Excluding RGE Sul; 2) Excluding an A1 big client, whose demand
reduction does not impact the parcel B; 3) Considering the investments
in transmission, in the amount of R$ 38 million; 4) Financial covenants
3 criteria.
1Q17 Highlights | EBITDA1
EBITDA1 Breakdown | 1Q17 | R$ million Distribution | R$ million
5.9%
Commerc., Services & Others
4%
Renewable
20%
Distribution 1Q16 1Q17
Convent. Generation 52%
24%
Conventional Generation | R$ million
16.4%
Total: R$ 1,196 million
1Q16 1Q17
Commerc., Services & Others | R$ million Renewable Generation | R$ million
60.6% 41.0%
1Q16 1Q17 1Q16 1Q17
4 1) EBITDA is calculated from the sum of net income, taxes, financial result, depreciation/amortization, as CVM Instruction no. 527/12.
1Q17 Energy Sales
Highlights Load in the concession area
(without RGE Sul)3,4,5 |
Increase in sales in the concession area (+18.1%) average MW
RGE Sul (1Q17) added 2,549 GWh in sales -0.4%
Disregarding RGE Sul: 6,741 6,716
• Stable load in the concession area (-0.4%) +17.1%
• Stable sales in the concession area (+0.1%)
• Contracted demand maintenance: -0.6% Off Peak and -0.2% Peak -6.5%
(Mar-17 vs. Mar-16)¹
• Losses²: from 8.69% in 1Q16 and 9.08% in 4Q16 to 9.14% in 1Q17
(change in the market mix and increase in the number of cuts) Free Client Captive
Sales in the concession Sales in the concession Sales by consumption segment
area (with RGE Sul)5 | GWh area (without RGE Sul)4,5 (without RGE Sul)4,5 | GWh
GWh
+18.1%
16,715 +0.1%
14,147 14,147 14,166 14,147 14,166
+28.8% +16.1% +1.5% -2.2% -0.7% +4.0%
+0.1%
+14.5% -5.3%
Resid. Indust. Commerc. Others
Free Client Captive Free Client Captive
1) Excluding a large A1 consumer, whose demand reduction does not impact parcel B; 2) Reported values were adequate to ANEEL’s criteria (customers connected in A1 voltage are
disregarded in load); 3) Load net of losses; 4) If excluding the consumption of a large consumer of the steel industry, the load in the concession area would be: -0.2% and free client: +18.5%;
5 Sales in the concession area: +0.8%, free client: +20.0%, Industrial segment: -0.3%; 5) RGE Sul (1Q17).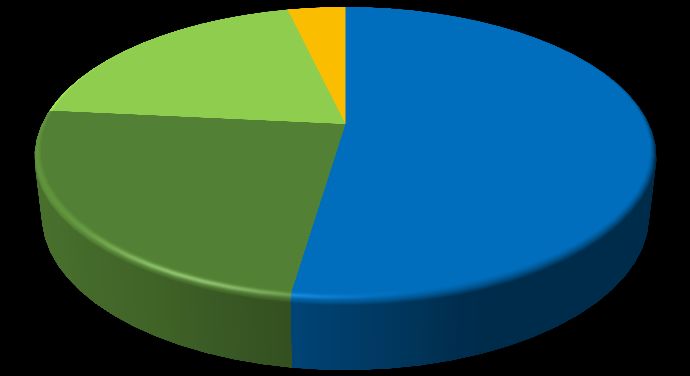
1Q17 Delinquency
ADA Evolution | % of Gross Revenue1
Avg 1Q15-1Q17:
0.65%
Avg: 0.59%
Total Overdue Bills – Above 90 days| in % of Collection actions | Cuts (thousands)
revenues – LTM²
6 1) 1) ADA/Revenue from Sales to Final Consumers. 2) Revenue from Sales to Final Consumers – last 12 months.Generation: Performance in 1Q17
Highlights 1Q17 Installed Capacity1 | %
Unfavorable hydrological situation has led the PLD (SE/CW)
Renewables
from R$ 49/MWh in Apr-16 to R$ 371/MWh in Apr-17 Conventional
4.2%
PLD (SE/CW) Evolution 371
3,128 3,258
200
14.2%
116 122 128 216
49 61 149 166
121 -0.1%
76 83
Jan-16
Feb-16
Dec-16
Sep-16
Jun-16
Apr-17
nov/16
Jul-16
jun/16
jan/17
out/16
abr/16
abr/17
mai/16
mar/17
jul/16
ago/16
set/16
dez/16
fev/17
Oct-16
May-16
Apr-16
Aug-16
Mar-16
Nov-16
NIPS Reservoir Levels | % Northeast Reservoir Levels | %
May 10 (current): May, 10 (current):
39.4% 21.0%
Jan Fev Mar Abr Mai Jun Jul Ago Set Out Nov Dez Jan Fev Mar Abr Mai Jun Jul Ago Set Out Nov Dez
2001 2013 2014 2015 2016 2017 2001 2013 2014 2015 2016 2017
7 1) Considering proportional stake in the generation projects.1Q17 Results
Net Revenue EBITDA Net Income
27.7% 15.6% -0.1%
R$ 1,202 million R$ 161 million R$ 0.3 million
1Q16 1Q17 1Q16 1Q17 1Q16 1Q17
IFRS R$ 4,337 R$ 5,539 R$ 1,035 R$ 1,196 R$ 232 R$ 232
million million million million million million
10.0% 4.2% -11.5%
R$ 436 million R$ 44 million R$ 27 million
1Q16 1Q17 1Q16 1Q17 1Q16 1Q17
IFRS (-) RGE Sul R$ 4,337 R$ 4,772 R$ 1,035 R$ 1,078 R$ 232 R$ 206
million million million million million million
Key Factors EBITDA:
Conventional Generation: total var. of +R$ 41 MM
EBITDA:
• Price readjustments of contracts (+R$ 24 MM)
Distribution: total var. of +R$ 35 MM
• RGE Sul (+R$ 117 MM)
Commerc., Serv. & Others: total var. of +R$ 16 MM
• Market (+R$ 14 MM)
• Margin gain by price and volume (+R$ 25 MM)
• Concession financial asset (-R$ 47 MM)
• Manageable PMSO + ADA + Reinforcement of
Net Income:
collection actions (-R$ 39 MM)
Financial Result: total var. of -R$ 117 MM
• Sectoral financial assets/liabilities update (-R$ 73 MM)
Renewable Generation: total var. of +R$ 69 MM
• RGE Sul (-R$ 28 MM)
• Seasonality (+R$ 35 MM)
• MTM (-R$ 19 MM)
• Start-up of wind farms - ACL complex (+R$ 32 MM)
8Indebtedness | Financial Covenants Management
Leverage1 l R$ billion
Adjusted Net Debt1
/Adjusted EBITDA2
Adjusted EBITDA1,2
R$ million
3,399 3,736 3,584 4,117 4,192
Gross debt cost3,4 l LTM Gross Debt Breakdown by
Indexer | 1Q171,4
Nominal
Real
Inflation
CDI
TJLP
Prefixed
9 1) Financial covenants criteria; 2) LTM recurring EBITDA; 3) Adjusted by the proportional consolidation since 2012; 4) Financial debt (-) hedgeDebt Profile | March 31, 2017
Debt amortization schedule1,2 l Mar-17 | R$ million
Cash Coverage:
Average tenor: 2.80 years
1.39x Short term
amortization (12M) Short term (12M): 18.9% of total
4,510
Short-term3
Long-term
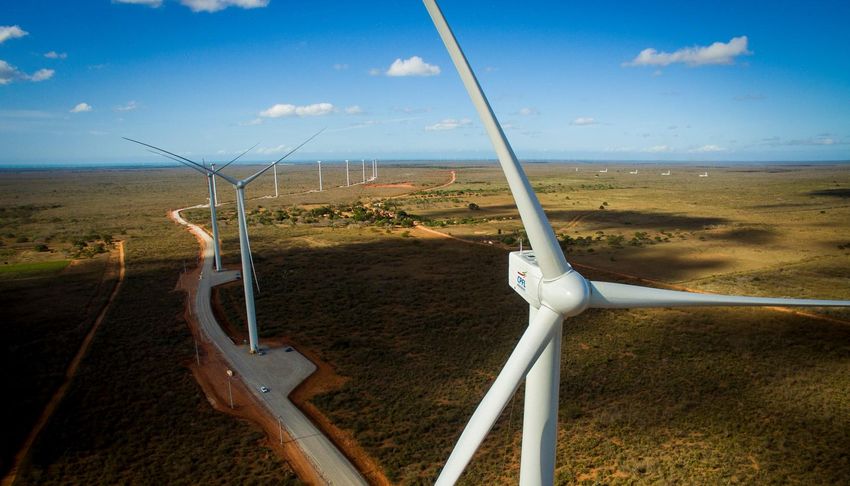
10 1) Considers Debt Principal, including hedge; 2) Financial covenants criteria; 3) Short-term (Apr-17 – Mar-18) = R$ 3,441 million.Growth Projects: Generation | Greenfield projects
Commercial Start-up
2018-
2020(e)
75 MW
of installed capacity
3 GW pipeline
41
average-MW
of assured energy
Pedra Cheirosa Wind Farms Boa Vista II SHPP
Commercial Start-up 20181 2020
Installed Capacity 48.3 MW 26.5 MW
Assured Energy 26.1 average-MW 14.8 average-MW
21st LEN 2015
18th LEN 2014
PPA2 R$ 225.53/MWh
R$ 156.50/MWh until 2037
until 2049
BNDES and BNB BNDES
Financing
(under analysis) (under analysis)
1) Gradual commercial operation from 1H18; 2) Constant Currency (Mar-17).
11Launch of the Solar Generation Company
Solar energy. From generation to generation.
Inaugurated on May 2,
Envo offers clean and
renewable energy and a
reduction of up to 95%
in the energy bill of its
customers
Envo offers solution for families to be able to generate solar electricity at
home and, thus, obtain a significant savings in the energy bills.
The Solution
The solution delivers a project that evaluates the individual potential of each
residence, management of the homologation with the local distributor,
supply and installation of all necessary equipment.
In this first moment, the sales efforts and the initial focus of action of Envo
Area of activity will be the cities of the region of Campinas, Sorocaba, Jundiaí and
surroundings. The company already has plans to expand in other locations in
the state.
12Capex(e)1,2 2017-2021 | R$ Million
Total: Distribution3: Generation4: Trading & Services: Transmission:
R$ 10,438 million R$ 9,222 million R$ 1,011 million R$ 157 million R$ 48 million
2,770
2,288
2,033 1,982
1,914
1,739
1) Constant currency; 2) Investment plan disclosed in 1Q17 Earnings Release on May 11, 2017; 3) Disregard investments in Special Obligations on Distribution segment (among other
13
22 items financed by consumers); 4) Conventional + Renewable.Corporate Structure | State Grid Transaction
Free Float
54.6% 45.4%
Term of
01/23/17 30 days 02/22/17
Mandatory
Unified Tender Offer
Unified
Conclusion Tender Unified
Tender Delisting
of Offer’s Tender
Offer’s Tender Offer Offer
Transaction Registration
Registration
Application Class Change
Tender Offer
Acquisition of the stakes
of Camargo Corrêa,
Previ and Bonaire Current status:
(54.6% of the total of
CPFL Energia) - EGM of 03/27/17 of CPFL Energia decided: Classes “A” and
i. change of the publicly-held company registration, from class “A” to “B” have a
R$ 25.51/share class “B”, and delisting from BM&FBOVESPA’s Novo Mercado – similar level of
APPROVED disclosure
(updated by Selic)
ii. choice of the firm to produce the appraisal report – CREDIT SUISSE
- Appraisal report of the Unified Tender Offer in preparation
14© CPFL 2016. All rights reserved
You can also read