3Q17 Results - CPFL Energia

Page created by Rick Holmes
 
CONTINUE READING
3Q17 Results - CPFL Energia
3Q17 Results
3Q17 Results - CPFL Energia
Disclaimer

    This presentation may contain statements that represent expectations about future events or results according to
    Brazilian and international securities regulators. These statements are based on certain assumptions and analyses
    made by the Company pursuant to its experience and the economic environment, market conditions and expected
    future events, many of which are beyond the Company's control. Important factors that could lead to significant
    differences between actual results and expectations about future events or results include the Company's business
    strategy, Brazilian and international economic conditions, technology, financial strategy, developments in the utilities
    industry, hydrological conditions, financial market conditions, uncertainty regarding the results of future operations,
    plans, objectives, expectations and intentions, among others. Considering these factors, the Company's actual
    results may differ materially from those indicated or implied in forward-looking statements about future events or
    results.

    The information and opinions contained herein should not be construed as a recommendation to potential investors
    and no investment decision should be based on the truthfulness, timeliness or completeness of such information or
    opinions. None of the advisors to the company or parties related to them or their representatives shall be liable for
    any losses that may result from the use or contents of this presentation.

    This material includes forward-looking statements subject to risks and uncertainties, which are based on current
    expectations and projections about future events and trends that may affect the Company's business.

    These statements may include projections of economic growth, demand, energy supply, as well as information
    about its competitive position, the regulatory environment, potential growth opportunities and other matters. Many
    factors could adversely affect the estimates and assumptions on which these statements are based.

2
3Q17 Results - CPFL Energia
3Q17 Highlights

    Increase in load in the concession area (+4.2%)1

    Reduction in the contracted demand: -0.9% Off Peak and -1.3% Peak (Sep-17 vs. Sep-16)1

    Increases of 62.7% in Net Operating Revenue and of 13.8% in EBITDA

    Investments of R$ 544 million2

    Net debt of R$ 13.7 billion and leverage of 3.24x Net Debt/EBITDA3

    CPFL Piratininga tariff adjustment, in Oct-17, with an average effect
     of +17.28% to be perceived by the consumers

    Status of State Grid transaction: Tag Along Tender Offer registered by CVM;
     auction will occur on Nov 30, according to the Notice released on Oct 31

    Launch of CPFL Inova, an open innovation program created
     by CPFL Energia in partnership with Endeavor Brasil

    Relevant Sector Issues in the Quarter: GSF, Eletrobras, WACC,
     Hydrology and Public Consultation 33

     1) Excluding RGE Sul; 2) Considering the investments in transmission, in
3    the amount of R$ 6 million; 3) Financial covenants criteria.
3Q17 Results - CPFL Energia
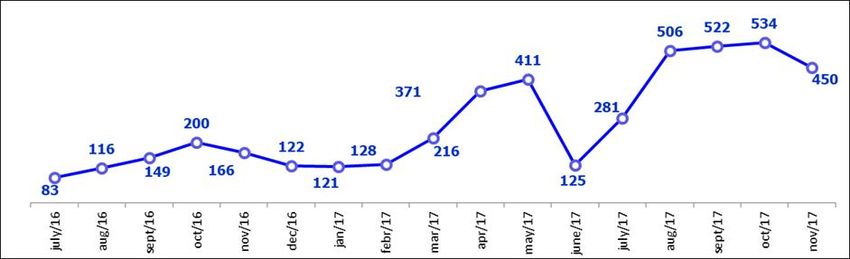
3Q17 Highlights | EBITDA1

     EBITDA1 Breakdown | 3Q17 | R$ million                                                                Distribution | R$ million
                                                                                                                                                     +6.4%

                                                                                                                    +13.3%
                       Commerc., Services & Others
                                  6%

                        Renewable                       Distribution                                        3Q16                3Q17          9M16           9M17
                          32%                              38%

                                  Convent. Generation                                                      Conventional Generation | R$ million
                                         24%
                                                                                                                                                     +13.7%
                                                                                                                   +10.8%

                              Total: R$ 1,275 million
                                                                                                            3Q16                3Q17          9M16           9M17

     Commerc., Services & Others | R$ million                                                              Renewable Generation | R$ million

                                                                                                                                                 +19.8%
                                                                                                                   +18.2%
               +6.3%                                        +23.1%

      3Q16                3Q17                       9M16               9M17                                3Q16                3Q17          9M16           9M17
4    1) EBITDA is calculated from the sum of net income, taxes, financial result, depreciation/amortization, as CVM Instruction no. 527/12.
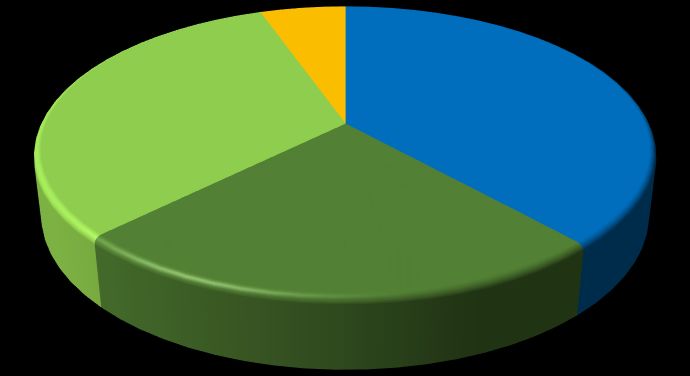
3Q17 Results - CPFL Energia
3Q17 Energy Sales

      Highlights                                                                            Load in the concession area
                                                                                             (without RGE Sul)1,2 |
                                                                                             average MW
     Increase in sales in the concession area (+18.4%)
     RGE Sul (3Q17) added 2,045 GWh in sales                                                                  +4.2%
     Disregarding RGE Sul:                                                                         6,153                6,411

       •     Increase in sales in the concession area (+3.2%)                                        1,840    +17.2%      2,156

       •     Increase in load in the concession area (+4.2%)
                                                                                                     4,314     -1.4%      4,255
       •     Reduction in the contracted demand: -0.9% Off Peak and -1.3% Peak
             (Sep-17 vs. Sep-16)                                                                     3Q16                 3Q17
       •     Losses: from 8.84% in 3Q16 and 8.86% in 2Q17 to 8.98% in 3Q17                              Free Client     Captive

 Sales in the concession                         Sales in the concession         Sales by consumption segment
  area (with RGE Sul)2 | GWh                       area (without RGE Sul)2          (without RGE Sul)2 | GWh
                                                   GWh
                   +18.4%
                                 15,933                        +3.2%                                                    98     13,888
                                                                                                     148       23
        13,454                                       13,454              13,888             166
                                  5,162
                                                                                  13,454
                    +32.2%                                                                                   +1.0%     +4.5%
           3,905                                      3,905    +18.5%     4,628                     +2.8%
                                                                                           +4.4%
                                                                                                                                  +3.2%
           9,549    +12.8%       10,770               9,549     -3.0%     9,260

           3Q16                   3Q17                3Q16                3Q17     3Q16    Resid.   Indust. Commerc. Others       3Q17
             Free Client       Captive                  Free Client     Captive

5    1) Load net of losses; 2) RGE Sul (3Q17).
3Q17 Results - CPFL Energia
3Q17 Delinquency

     ADA Evolution | % of Gross Revenue1
                                                                                                                                   Avg 3Q15-3Q17:
                                                                                                                                        0.67%
         Avg 1Q12-3Q17:
             0.59%

     Total (R$) Overdue Bills – Above 90 days| in % of                                   Collection actions | Cuts (thousands)
      revenues – LTM²

6    1) ADA/Revenue from Sales to Final Consumers – last 12 months; 2) Revenue from Sales to Final Consumers – last 12 months.
3Q17 Results - CPFL Energia
Generation: Performance in 3Q17

                                             Highlights
                                                                                               3Q17 Installed Capacity1 | MW
     Unfavorable hydrological situation has led the PLD (SE/CW) from
      R$ 149/MWh in Sep-16 to R$ 522/MWh in Sep-17
     Wind generation below the P50 (-5.0%)                                                                               Renewables
                                                                                                                          Conventional
                                                                                                               +4.2%
     PLD (SE/CW) Evolution
                                                                                                       3,168              3,283
                                                                                                       1.006   +17.2%     1.085

                                                                                                       2.198              2.198

                                                                                                        3Q16              3T17

 NIPS Reservoir Levels | %                                                           Northeast Reservoir Levels | %
                                                            November 21
                                                          (current): 18.5%                                          November 21
                                                                                                                  (current): 4.9%
                                                                ONS projection for
                                                                  November 30                                           ONS projection for
                                                                                                                          November 30

7    1) Considering proportional stake in the generation projects.
3Q17 Results - CPFL Energia
3Q17 Results

                                  Net Revenue                   EBITDA                         Net Income
                                      62.7%                      13.8%                             44.9%
                                  R$ 3,001 million            R$ 154 million                    R$ 121 million
                                  3Q16     3Q17              3Q16     3Q17                    3Q16      3Q17
                  IFRS        R$ 4,783     R$ 7,784      R$ 1,120     R$ 1,275              R$ 269      R$ 390
                                 million   million          million   million                million    million
                                      42.7%                       7.3%                             49.4%
                                  R$ 2,043 million             R$ 82 million                    R$ 133 million
       IFRS (-) RGE Sul           3Q16     3Q17              3Q16     3Q17                    3Q16      3Q17
(WITHOUT ACQUISITION          R$ 4,783     R$ 6,826      R$ 1,120     R$ 1,202              R$ 269      R$ 402
   DEBT ADJUSTMENTS)             million   million          million   million                million    million

                          Key Factors                      EBITDA:
                                                                Renewable Generation: total var. of +R$ 63 MM
    EBITDA:                                                     • Start-up of wind farms – ACL complex (+R$ 92 MM)
      Distribution: total var. of +R$ 57 MM                     • Contractual penalties in 3Q16 (+R$ 37 MM)
      • Market (+R$ 86 MM)                                      • Impact of the GSF (-R$ 27 MM)
      • RGE Sul (+R$ 72 MM)                                     • Lower wind farms generation (-R$ 23 MM)
      • Manageable PMSO + ADA + Reinforcement of
                                                                • Seasonalization of PPA for SHPPs (-R$ 10 MM)
        collection actions (-R$ 52 MM)
      • Concession financial asset (-R$ 38 MM)
      • Itaipu’s exchange variation (-R$ 9 MM)             Net Income:
                                                                Financial Result: total var. of +R$ 73 MM
      Conventional Generation: total var. of +R$ 30 MM          • Debt charges, net of income from financial investments
      • Financial adjustments of UBP (+R$ 17 MM)                   (+R$ 122 MM)
      • EPASA’s performance (+R$ 12 MM)                         • MTM (+R$ 43 MM)
                                                                • Itaipu’s exchange variation (+R$ 9 MM)
      Commerc., Serv. & Others: total var. of +R$ 4 MM          • RGE Sul: consolid. (-R$ 37 MM) & acquis. (-R$ 45 MM)
      • Margin gains by price and volume (+R$ 34 MM)
      • Contractual penalties in 3Q16 (-R$ 23 MM)
8
Indebtedness | Financial Covenants Management

     Leverage1 l R$ Billion

                                                            13.0                                   13.2              13.8               13.6           13.7
                                        12.2                                   12.2

                                        3.59               3.49
     Adjusted Net Debt1                                                        3.41                                   3.30               3.28          3.24
     /Adjusted EBITDA2                                                                            3.21

                                         2013               2014               2015               2016               1Q17               2Q17           3Q17
        Adjusted EBITDA1,2
                                         3,399              3,736              3,584              3,577              3,764              3,725          4,235
        R$ Million

     Gross Debt Cost3,4 l end of period                                                                                 Gross Debt Breakdown by
                                                                                                                          Indexer l 3Q171,4
       Nominal
       Real                                                                                                                 Inflation
                                                                                                                                           2%
                                                                                                                                                               CDI

                                                                                                                        TJLP
                                                                                                                                  19%                   74%

                                                                                                                                    5%
                                                                                                                      Prefixed

9    1) Financial covenants criteria; 2) LTM recurring EBITDA; 3) Adjusted by the proportional consolidation since 2012; 4) Financial debt (-) hedge
Debt Profile | On September 30, 2017

        Debt amortization schedule1,2 l Sep-17 | R$ Million

                                                                                                                Average Tenor: 2.55 years
                                                                                                              Short-Term (12M): 26% of total

                                 Cash Coverage:
                                0.86x Short-Term
                                                                4,704
                                                                                                                                 Short-term3
                                   amortization                    515
                                     (12M)                                                                                      Long-term

                                                                                       5,266

                                                                 4,189
                      3,832
                                                                                                              2,882
                                                                                                                                                    2,536

                                                                                                                                1,312

                                             274
                 Cash Set-2017         Short Term                 2018                  2019                  2020               2021               2021+
                                      Set - Dec 2017

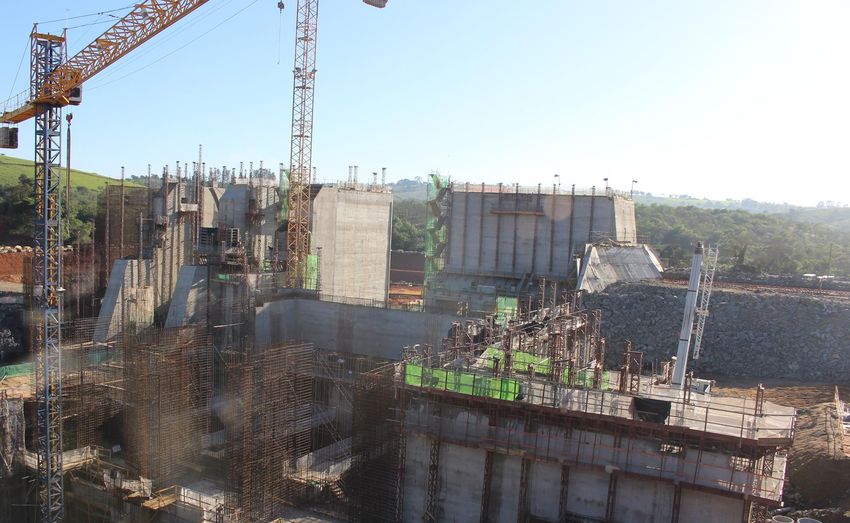
10    1) Considers Debt Principal, excluding servicing and including hedge; 2) Financial covenants criteria   3) Amortization from October-2017 to September-2018
SHPP Boa Vista II – Under Construction

                                                                         Status: concrete pouring of the structures
                                                                           concluded. Electrical and mechanical
                                                                           equipment manufactured as planned.

     Commercial                 Installed
                                            Assured Energy        PPA1              Location           Financing
      Start-up                  Capacity

                                                              21st LEN 2015
                                                 14.0                                                  BNDES
        2020                   29.9 MW                       R$ 225.53/MWh        Minas Gerais
                                             average-MW                                            (under analysis)
                                                                 until 2049

      1) Constant Currency (Sep-17).
11
CPFL Inova Program

                                                                              Main Goals

            CPFL immersion program in the
            entrepreneurial ecosystem, with the
            objective of approaching and connecting
                                                                  • Connect CPFL and its executives with
            CPFL with the largest startups/scale-ups in
                                                                    innovative initiatives in Brazil
            Brazil
                                                                  • Mapping solutions and key innovations
            The basis of the project is Endeavor’s
                                                                    within our industry
            acceleration methodology designed to map,
            select, diagnose, and track high impact
                                                                  • Customized program for the challenges
            entrepreneurs (scale-ups) of Endeavor’s
                                                                    and objectives of CPFL
            mentoring network

            The program will select up to 12 scale-ups
            within the themes of interest of the CPFL
            group

                       Operational                                  Distributed
                                             Energy Efficiency                           Energy Storage
                        Efficiency                                  Generation
     Solutions of
      Interest
                                                                                        Relationship with
                    Internet of Things       Big Data/Analytics    Smart Cities
                                                                                           Customers

12
Corporate Structure | State Grid Transaction

                                                                                       Free Float
                            54.6%                                                          45.4%

01/23/17                    02/22/17                 07/12/17                        10/26/17                   11/30/17

                              Tender                   Change of
     Conclusion                                      documentation                    Mandatory                  Mandatory
                              Offer’s                                                                             Tender
         of                                            at CVM for                   Tender Offer’s
                            Registration             the Mandatory                                                 Offer
     Transaction                                                                     Registration
                            Application               Tender Offer

Acquisition of the stakes
of Camargo Corrêa,
Previ and Bonaire                   Status:
(54.6% of the total of              -   On 10/26/17, the CVM approved all relevant documents and the continuity of
CPFL Energia)                           the Mandatory Tender Offer resulting from the transfer of control of the
                                        Company
 R$ 25.51/share
 (updated by Selic)                 -   On 10/31/17, CPFL Energia released a Material Fact informing the publication,
                                        on that date, of the Form of Notice of the Offer
                                    -   The auction will occur on 11/30/17
13
© CPFL 2017. All rights reserved
You can also read