Quarterly System Status Briefing: Summer Status - Brian Molefe Group Chief Executive - Eskom
←
→
Page content transcription
If your browser does not render page correctly, please read the page content below
Quarterly System Status Briefing:
Summer Status

Brian Molefe
Group Chief Executive

16 November 2015
Content

          Introduction

          Winter performance

          Summer outlook

          Recovery and build
          programme

          Conclusion

                               2
Overview

• Eskom continues to supply 100% electricity for the
 most part, while performing maintenance
• To date, we have had 99 days with only 2 hours and
 and 20 minutes of load-shedding.
• The recent introduction of a new maintenance methodology called Tetris
 enables effective management of maintenance with no load shedding
• The performance of our generation fleet has stabilised with unplanned
 outages (UCLF) below target of 7 000MW
• The New Build programme delivered 720MW to the grid with the
 commercial operation of Medupi Unit 6 on 23 August 2015
• Our focus is on fast tracking the capacity build programme
• Summer projections is that no load shedding is expected.
                                                                           3
Content

          Introduction

          Winter performance

          Summer outlook

          Recovery and build
          programme

          Conclusion

                               4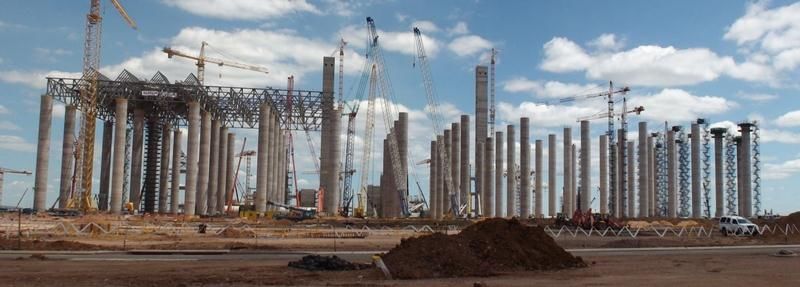
Since Winter 2015 was warmer than last year, more
maintenance was performed while still supplying 96% electricity

    •   Eskom performed three times
        more maintenance this past winter   •   Renewable energy contributed up
        than ever before                        to 1 300MW during the day, of
                                                which 800MW was from solar and
                                                500MW from wind, including
    •   Typically the winter demand for         Eskom’s Sere wind farm
        electricity increases along with
        localised power outages and
        illegal connections putting         •   All available levers were used to
        additional strain on the power          contain the level of load shedding:
        system                                  - Independent Power Producers
                                                - Open Cycle Gas Turbines
    •   While load shedding was                 - Demand Market Participation
        implemented this winter, Eskom
        continued to supply up to 96% of
        electricity during this period
                                            •   Coal stock levels were at healthy
                                                levels throughout the winter with an
                                                average of 51 days

                                                                                       5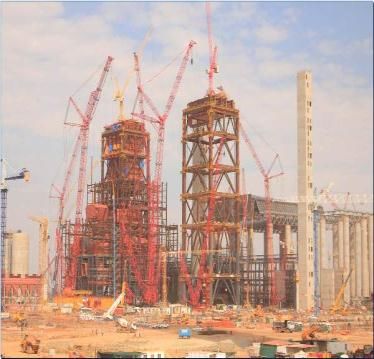
Introduction

Winter performance

Summer outlook

Recovery and build
programme

Conclusion

                     6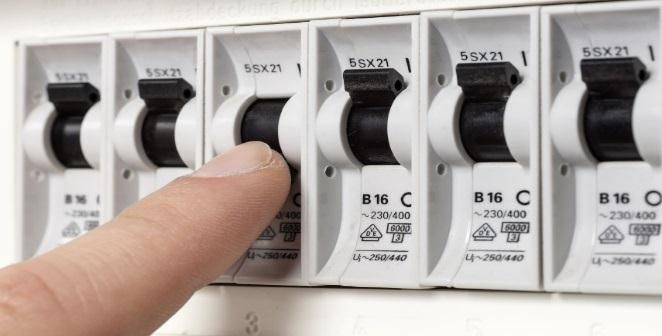
In summer, the system is tight all day up to 10pm, showing a
  flat “Table Mountain” profile

                              “Table mountain” profile       Typical Winter Day           Typical Summer Day

Summer and winter typical daily load profiles
MW

        36 000

        34 000
        32 000

        30 000
        28 000

        26 000
        24 000

        22 000
        20 000
              23:00   02:00   05:00    08:00    11:00    14:00   17:00   20:00    23:00   02:00

                                                                                                          7
Eskom will continue to execute maintenance without load
  shedding throughout the summer period (1/2)

• While the system remains tight, Eskom will
  continue with maintenance with no or
  limited load shedding

• Summer is likely to be hotter than last
  year, with a higher expected demand in
  electricity throughout the day as
  consumers switch on air conditioners and
  pool pumps

• We plan to meet demand for electricity 100% of the time and implement
  stage 1 load shedding only when demand increases beyond available
  capacity

• The 2hr 20min of stage 1 load shedding that took place on 14 September
  was an extreme incident as there was a loss of a number of generating
  units in quick succession

• Key industrial customers experienced stage 2 load curtailment only once
  in the last 99 days on 9 October 2015 for 5 hr 30 min
                                                                            8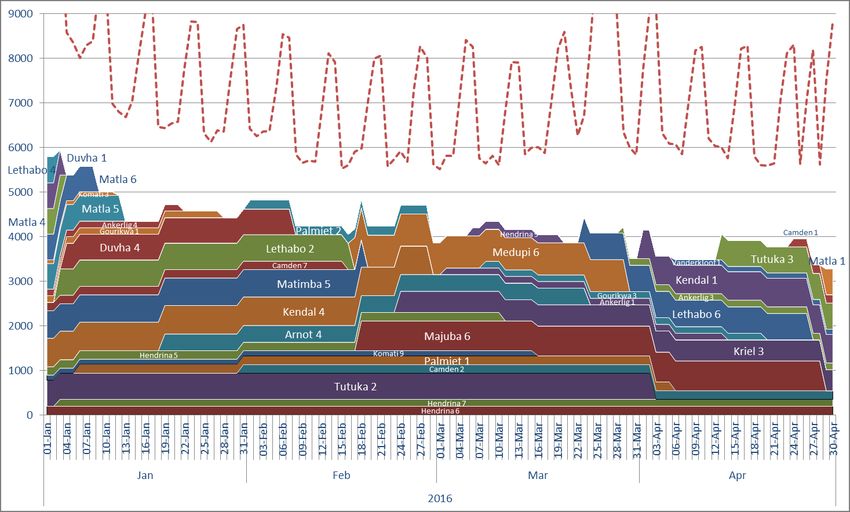
Eskom will continue to execute maintenance without load
    shedding throughout the summer period (2/2)
• The development of a new methodology, called
  Tetris has resulted in better predictability

          e.g. Medupi unit 6 remained on planned
               outage from 21 October until 9 November with no load shedding
•    Tetris enables us to perform maintenance within our maintenance budget of
     4 500 MW
• During the severe heat wave experienced in early October, Eskom was able
  to perform maintenance without load shedding
• Eskom has connected an additional 43 Independent Power Producers
  (IPP) projects with a total capacity of 2 147 MW of which 2 021 MW is in
  commercial operation
• An additional 334MW from the Department of Energy’s Dedisa IPP
  project
• Coal stock is sustained at healthy levels of 58.2 days on average
• Dam levels are currently at 58%                                                9
Capacity outlook until August 2016
                          Available Capacity    Operating Reserves         PCLF          UCLF          Peak Demand         Installed Capacity

Capacity outlook from November 2015 to August 2016
MW

45000                                                                                                         1

                                                                                         Winter UCLF
               Summer UCLF                                 UCLF                          6000 MW
40000          7000 MW

35000                                                     PCLF

                          Operating Reserves
30000

25000                                                            Available Capacity

20000
         Nov        Dec            Jan         Feb        Mar             Apr            May            Jun          Jul           Aug
                2015                                                              2016
Source: Tetris V4.03
 1 Additional capacity from IPPs (500MW)                                                                                                 10
Tetris: Overview of planned maintenance from November
1
to December 2015
Capacity outlook from November to December 2015 Available Capacity = Installed Capacity - Peak Demand - UCLF
MW
11
Source: Tetris V4.032 Tetris: Overview of planned maintenance from January to April 2016 Capacity outlook from January to April 2016 Available Capacity = Installed Capacity - Peak Demand - UCLF MW Source: Tetris V4.03 12
Tetris: Overview of planned maintenance from May to
 3
        August 2016
Capacity outlook from May to August 2016     Available Capacity = Installed Capacity - Peak Demand - UCLF
 MW

Source: Tetris V4.03                                                                                    13
On average the demand has been the same between August
and October when compared to 2013, 2014 and 2015
Weekly Energy Sent out –YOY comparison 2013 - 2015 Insights
• Despite recent statements in the
Incl IPPs 2015 Incl IPPs 2014 Incl IPPs 2013 media, electricity demand profile
5 300
has remained relatively similar
over the Aug – Oct over the last 3
Thousands
years
5 100
• Stable electricity supply has also
led to the increase in
4 900 manufacturing output:
‒ Output rose 0.9% year on year
4 700 compared to a revised -0.3% in
August
4 500 ‒ Factory production jumped
Energy (GWh)
2.2% and was up 1.4% in the
4 300 three months to Sep 2015
4 100 “Not a bad manufacturing print at all. It
may be that both the more competitive
rand and stabilisation of power,
3 900
helped” – Razia Khan (head of Africa
38 39 40 41 42 43 44 45 46
Weeks research at Standard Chartered”
Source: Eskom Transmission, Reuters, The Witness 14Introduction
Winter performance
Summer outlook
Recovery and
build programme
Conclusion
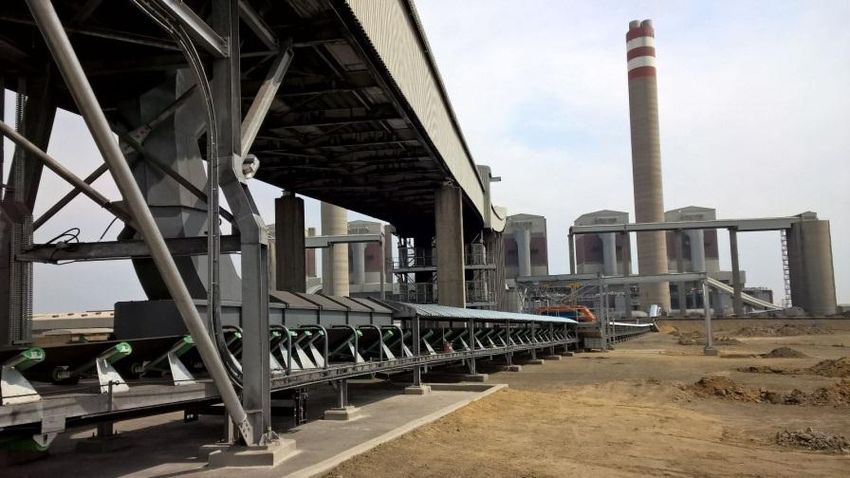
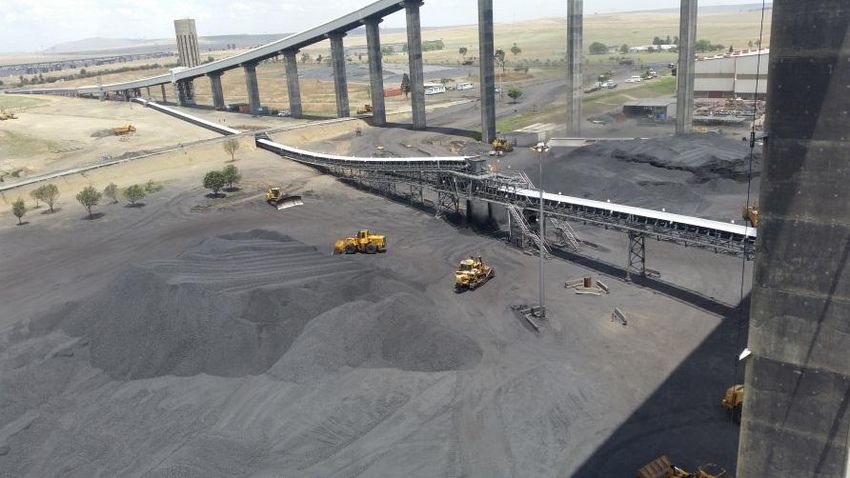
15Progress at Majuba Power Station (1/2)
• Majuba Power Station experienced a • An interim solution is currently in
coal storage silo collapse on 1 place and has been in operation
November 2014 from 1 October 2015
• A short term solution was • This includes a newly constructed
implemented with coal being fed temporary conveyer belt to ferry
through an elevated mobile boom the coal
feeder
• The power station has been able to
• The use of trucks to transport coal
has been curtailed from an average
run at full load from February
of 1060 trucks before the
2015
implementation of the interim
solution to an average of 90 trucks
16Progress at Majuba Power Station (2/2)
Permanent solution
• Designs for the permanent solution have
been completed
• This includes re-instatement of the
damaged silo and the associated coal
conveyor system
• Two other coal silos will also be reinforced
• A tender enquiry was issued to the market
and closed on 03 November 2015
• Evaluation in progress and anticipated
contract award date is 01 December
2015
• Construction will be complete by 31
December 2017
17Progress at Duvha Power Station
Progress update
• Duvha Power Station experienced an over-
pressurisation incident in March 2014
• The collaborative process undertaken
in conjunction with the Loss
Adjuster is nearing completion
• An indicative settlement offer has been
made by the insurers and the Loss Adjuster
• The boiler needs to be replaced, however,
issues of technology assessment and cost
uncertainty have delayed progress on this
project
• A proposed investment and commercial
process will be submitted to the Eskom
governance committees for a decision on the
way forward
18Build Programme - current scheduled dates
The Intention is to fast track the build programme
Medupi Commercial operation dates
Unit 6 (794MW) 23 August 2015
Unit 5 (794MW) March 2018
Unit 4 (794MW) July 2018
Unit 3 (794MW) June 2019
Unit 2 (794MW) December 2019
Unit 1 (794MW) May 2020
Kusile Commercial operation dates
Unit 1 (800MW) July 2018
Unit 2 (800MW) July 2019
Unit 3 (800MW) August 2020
Unit 4 (800MW) March 2021
Unit 5 (800MW) November 2021
Unit 6 (800MW) September 2022
Ingula Commercial operation dates
Unit 3 (333MW) January 2017
Unit 4 (333MW) March 2017
Unit 2 (333MW) May 2017
Unit 1 (333MW) July 2017
19The New Build Programme and Recovery Projects will
contribute 5 620 MW to the network over the MYPD3 window
xx MW added to
the network
Post MYPD3
• First sync Mar 2015
• Full stable power by
• Commissioned in Jun 2015
early Mar 2015 • Commissioned Aug
• Additional 100MW 2015 • Ingula Unit 4 first • Ingula Unit 1 first • Kusile Unit 1 First sync
added to the • Additional 794 MW sync in Jan 2017 sync in May 2017 in Nov 2017
network added to the network • CO by Mar 2017 • CO in Jul 2017 • CO in Jul 2018
100 794 333 333 800
Mar 2015 Jun 2015 Mar 2017 Jul 2017 Jul 2018 5 620
Sere Wind Farm Medupi Unit 6 Ingula Unit 4 Ingula Unit 1 Kusile 1
Mar 2015 Jan 2017 May 2017 Mar 2018
Majuba Recovery Ingula Unit 3 Ingula Unit 2 Medupi 5
1200 333 333 794 600
• 600MW from unit 3 gap • Ingula Unit 3 first • Ingula Unit 2 first • Medupi Unit 5 first • Duvha 3 will be fully
solution in Feb & sync in Oct 2016 sync in Mar 2017 sync in Sep 2017 recovered in
600MW from Unit 4 in • CO by Jan 2017 • CO by May 2017 • CO in Mar 2018 2019/2020
Mar 2015 • This project falls out
of MYPD3 window
SOURCE: Team analysis
20
1 Dates based on P80 ScheduleWe will collaborate with our customers to reduce demand-
“Less is more − Live Lightly!”
Saving electricity reduces pressure on the grid, cuts your electricity
bill and reduces South Africa’s carbon emissions
The power system remains vulnerable all day during summer
1. Use air conditioning efficiently “Know your
o Set air conditioning to 23ºC number”
o Close windows and doors to optimise air conditioning
o Switch off 30 minutes before leaving the office
2. Switch off all geysers and pool pumps (all day until 9pm), and
invest in a timer
3. If you use the pool frequently, limit pool filtering cycles to two
cycles daily, and not between 5pm & 9pm
4. Switch off all non-essential lighting
“Live 5. Respond to Power Alert messages by switching off all
Lightly” appliances that are not being used
21Conclusion
We endeavour to perform maintenance with no load shedding this summer
To date we have had 99 days with only 2 hours and 20 minutes of load-
shedding.
Key industrial customers experienced stage 2 load curtailment only once in
the last 99 days
Eskom will fast track its build programme to ensure supply in winter
We appreciate the support of all our customers and encourage that we
maintain 10% electricity savings
Eskom will continue to provide regular updates on the state of the power
system through various media platforms
Please also follow us on twitter @Eskom_SA and @Eskom_MediaDesk for
updates
22Thank you
You can also read