2 YAMADA HLDGS 2025 1 Information for investors April 2021- September 2021
←
→
Page content transcription
If your browser does not render page correctly, please read the page content below

【1】Information for investors
        April 2021- September 2021
                 &
【2】YAMADA HLDGS 2025
                   Mid-term business plan

                                         Nov. 16, 2021

       Information for Investors April 2021- September 2021 & YAMADA HLDGS 2025 Mid-term business plan   1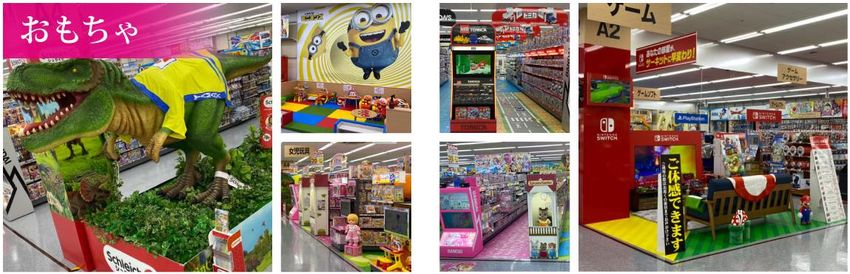
【1】Information for Investors
    April 2021- September 2021

                                                                  2
           Information for Investors April 2021- September 2021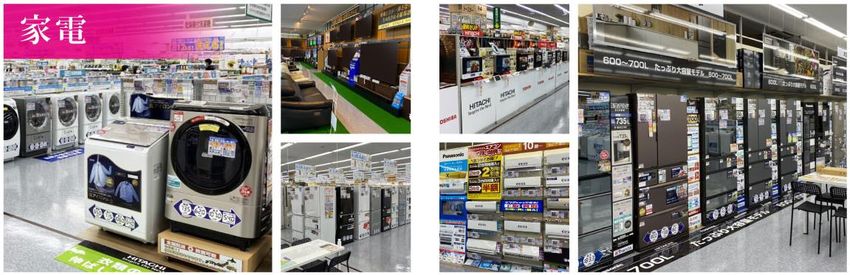
Major topics in FY2022

■First Quarter(April 2021-Jun 2021)
 March 31, 2021      : Endorsement of the recommendations of the Task Force on Climate-related Financial Disclosures (TCFD)
 March 31, 2021      : In line with the growth of the housing business, acquired shares of SANKYU Corporation
                       for the purpose of recycling waste materials
 April 25, 2021      : A state of emergency was declared for Tokyo, Osaka, Hyogo, and Kyoto
                       It was later extended to Hokkaido, Aichi, Hiroshima, Okayama and Fukuoka, and will remain in effect until June 13
 Jun 9, 2021         : Announced that it will make OTSUKA KAGU,LTD. a wholly owned subsidiary through a share exchange
                       →   completed on September 1
 Jun 18, 2021        : Opening of "Tecc LIFE SELECT Kumamoto Kasuga", a new large store with the concept of “Total-Living”
■Second Quarter(July 2021-September 2021)
 July 1, 2021        : Launch of "Yamada NEOBANK", a new financial service using the services provided by SBI Sumishin Net Bank, Ltd.
                       through YAMADA FINANCE SERVICE Co., Ltd.
 July 2, 2021        : Started to introduce shopping baskets made of recycled plastic from used home appliance to Yamada Denki stores
 July 12, 2021       : A fourth emergency declaration was issued for Tokyo. Later extended to 21 prefectures until September 30
 September 1, 2021 : Participated in the "My Human Rights Declaration" project organized by the Ministry of Justice
 September 6, 2021 : Received a Silver Award in the SUSTAINA ESG AWARDS 2021 (Industry Category: Retail), by SUSTAINA JAPAN Inc.
 September 21, 2021 : Formed an alliance ARCLAND SAKAMOTO CO.,LTD. for store development,
                       and announced the development of a next-generation concept, a “comprehensive lifestyle proposal shopping square”

                                                                                                                                           3
                                                   Information for Investors April 2021- September 2021
2022 Interim Result                                                        [Consolidated accounting]
                                                                                                                               First-half
                                                                2022 Interim                            2022 Interim
                                                                   results                                forecasts                                      2021 Interim
                                                                                       %sales                                  %sales       Plan ratio                        %sales       Y/Y
                                                            Revenue recognition                     Revenue recognition                                    results
                                 ( million yen / %)
                                                            criteria impact                         criteria impact
Net sales                                                                800,399          100.0                  830,000          100.0           96.4           860,296         100.0       93.0
Gross profit                                                             234,775           29.3                  250,000            30.1          93.9           259,205          30.1       90.6
     Personnel                                                                89,058       11.1                       93,085        11.2          95.7               81,233        9.4      109.6
     Advertising                                                              11,054        1.4                       12,224         1.5          90.4                9,523        1.1      116.1
     Rents                                                                    36,665        4.6                       36,980         4.5          99.2               37,206        4.3       98.5
     Depreciation                                                              9,854        1.2                        9,979         1.2          98.8                7,989        0.9      123.4
     Lease fee & Lease dipreciation                                             794         0.1                         809          0.1          98.1                  669        0.1      118.6
Selling, general and administrative expenses                             199,690           24.9                  211,100            25.4          94.6           213,195          24.8       93.7
Operating profit                                                              35,084        4.4                       38,900         4.7          90.2               46,010        5.3       76.3
     Non-operating income                                                      5,927        0.7                        4,984         0.6         118.9                6,608        0.8       89.7
     Non-operating expenses                                                    1,735        0.2                        1,284         0.2         135.2                3,530        0.4       49.2
Ordinary profit                                                               39,276        4.9                       42,600         5.1          92.2               49,088        5.7       80.0
     Extraordinary income                                                        63         0.0                           0          0.0             -                1,502        0.2           4.2
     Extraordinary loss                                                        3,163        0.4                        3,364         0.4          94.0               19,493        2.3       16.2
     Total corporation taxes                                                   6,139        0.8                       17,394         2.1          35.3               11,474        1.3       53.5
     Net income attributable to non-controlling interests                        68             0                      ▲ 58             -            -           ▲ 1,271               -           -
Profit attributable to owners of parent                                       29,967        3.7                       21,900         2.6         136.8               20,895        2.4      143.4

                                                                                                                                                                                                       4
                                                                                Information for Investors April 2021- September 2021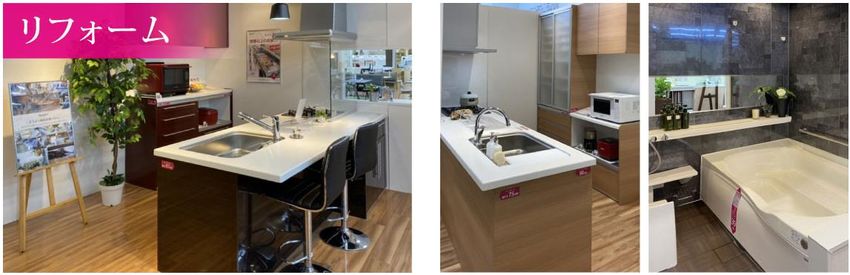
2022 First Quarter & Second Quarter                                                                                           [Consolidated accounting]
                                                                                            First Quarter[April-June]                                                         Second Quarter[July-September]

                                                                  2022 Results                                                                         2022 Results
                                                                                         %sales         2021 Results         %sales       Y/Y                                   %sales     2021 Results        %sales       Y/Y
                                                              Revenue recognition                                                                  Revenue recognition
                              ( million yen / %)
                                                              criteria impact                                                                      criteria impact
Net sales                                                                   382,987        100.0                406,520        100.0        94.2                 417,411          100.0           453,776        100.0        92.0
Gross profit                                                                118,086         30.8                125,006         30.8        94.5                 116,688           28.0           134,199         29.6        87.0
        Personnel                                                               42,603      11.1                 39,192          9.6       108.7                     46,454        11.1            42,040          9.3       110.5
        Advertising                                                              5,748       1.5                  4,113          1.0       139.7                      5,306         1.3             5,410          1.2        98.1
        Rents                                                                   18,012       4.7                 18,678          4.6        96.4                     18,652         4.5            18,528          4.1       100.7
        Depreciation                                                             4,764       1.2                  4,085          1.0       116.6                      5,090         1.2             3,903          0.9       130.4
        Lease fee & Lease dipreciation                                            390        0.1                       321       0.1       121.3                       403          0.1               347          0.1       116.0
Selling, general and administrative expenses                                    96,660      25.2                102,377         25.2        94.4                 103,030           24.7           110,817         24.4        93.0
Operating profit                                                                21,426       5.6                 22,628          5.6        94.7                     13,658         3.3            23,381          5.2        58.4
        Non-operating income                                                     2,993       0.8                  3,486          0.9        85.9                      2,933         0.7             3,122          0.7        94.0
        Non-operating expenses                                                    691        0.2                  1,868          0.5        37.0                      1,044         0.3             1,662          0.4        62.8
Ordinary profit                                                                 23,728       6.2                 24,247          6.0        97.9                     15,547         3.7            24,841          5.5        62.6
        Extraordinary income                                                        0        0.0                        18       0.0         0.0                        63          0.0             1,483          0.3          4.3
        Extraordinary loss                                                       1,607       0.4                       940       0.2       170.8                      1,556         0.4            18,552          4.1          8.4
        Total corporation taxes                                                  4,962       1.3                  8,255          2.0        60.1                      1,177         0.3             3,218          0.7        36.6
       Net income attributable to non-controlling interests                     ▲ 254             -              ▲ 815                -     31.2                       323           0.1           ▲ 455                -         -
Profit attributable to owners of parent                                         17,413       4.5                 15,885          3.9       109.6                     12,553         3.0             5,010          1.1       250.6

                                                                                                                                                                                                                            5
                                                                                                      Information for Investors April 2021- September 2021
2022 First-half net sales by segment [Consolidated accounting]
                                                                                                               (million yen / %)                       About Aggregation
               Segment                  2022 Interim result   % sales     Y/Y       2021 Interim result   % sales     % Sales /Rate of change            classification
               Television                            61,210        7.2       87.3                70,081         8.1             ▲ 0.9           *1
               Video,DVD                             14,523        1.7       83.3                17,445         2.0             ▲ 0.3           Health related products, Hairdressing
                                                                                                                                                and beauty products, Cleaner,
               Audio                                  9,924        1.2       83.8                11,837         1.4             ▲ 0.2           Services-related, etc…
               Refrigerator                          68,159        8.0       87.1                78,246         9.1             ▲ 1.1           *2
               Washing machine                       63,286        7.5       96.0                65,906         7.7             ▲ 0.2           Housing(except for solar power
    Home                                                                                                                                        systems),Renovations, etc…
               Cooking appliance                     34,264        4.0       85.3                40,191         4.7             ▲ 0.7
  appliances                                                                                                                                    **Revenue recognition criteria
               Air conditioner                       75,338        8.9       87.8                85,802        10.0             ▲ 1.1
                                                                                                                                                  impact
               Other air conditioners                 8,241        1.0       74.1                11,121         1.3             ▲ 0.3
               Construction                          38,336        4.5       97.3                39,418         4.6             ▲ 0.1
               Others*1                             115,385       13.5       89.7               128,632        14.9             ▲ 1.4
               Subtotal                             488,670       57.6       89.1               548,683        63.8             ▲ 6.2
               Personal computer                     55,290        6.5       73.2                75,530         8.8             ▲ 2.3
               Digital Camera                         5,776        0.7       98.3                 5,873         0.7                   0.0
 Information   Computer peripherals                  24,792        2.9       90.0                27,551         3.2             ▲ 0.3
  appliances   Mobile phone                          41,241        4.9      128.2                32,160         3.7                   1.2
               Others                                22,377        2.6       85.1                26,298         3.1             ▲ 0.4
               Subtotal                             149,478       17.6       89.3               167,415        19.5             ▲ 1.9
Housing related*1                                   126,830       15.0      198.6                63,872         7.4                   7.6
Furniture・interior・GMS                               48,747        5.7      122.2                39,881         4.6                   1.1
Total amount                                        847,965      100.0       98.6               860,296     100.0                          -

                                                                                                                                                                                 6
                                                        Information for Investors April 2021- September 2021
【2】YAMADA HLDGS 2025 Mid-term business plan

                YAMADA HLDGS 2025 Mid-term business plan   7
Consumer Electronics market in Japan and USA

                                   Japan                                                    USA

              ・Buy only Electronics,                                 ・Washing machines, air conditioners, and furniture
               not the set with something else                        are mainly sold in combination with housing

   Sales      ・Selling consumer electronics as audio devices and TV, ・Selling consumer electronics is main, and
               household appliances as a refrigerator, and more.      demand for purchasing at consumer store is not
  methods                                                             high.
              ・Mainly purchased at consumer store,                   ・Intense price competition due to expansion of
               demand for original concept stores also exists         E-commerce

              ・The habit of replacement is well established.         ・Consumer themselves do not have the habit of
              ・Each manufacturer frequently develop and supply        replacing their products.
               new products to compete not only on price, but also
Replacement    on function and design                                ・No significant difference in function and design,
 demands      ・Purchase at consumer store is in high demand due       consumer tend to buy the low price product
               to preference for a wide range of products             on E-commerce

              ・No. 1 share in Consumer Electronics market in Japan
              ・A wide variety of store concepts and product lines to meet a wide range of needs
              ・A conglomerate company that supply not only home electronics, but also furniture,
               housing, finance, and more.
                                                               Aim to achieve sales of 2 trillion yen
                                                               by leading the total living industries
                                          YAMADA HLDGS 2025 Mid-term business plan                                        8
Review of Previous 3 Years

                            1,752.5
  Net sales                           Ordinary profit                                      ROA/ROE
                                                                                                           ROE 8.1%
  (billion yen)                       (billion yen)                    98.8

                                                                                             4.0%
                  1,611.5
1,600.5                                                 46.0
                                        36.8                                        2.5%
                                                                                                             ROA 4.3%

                                                                                                    2.1%
                                                                                    1.2%

                                         YAMADA HLDGS 2025 Mid-term business plan                                       9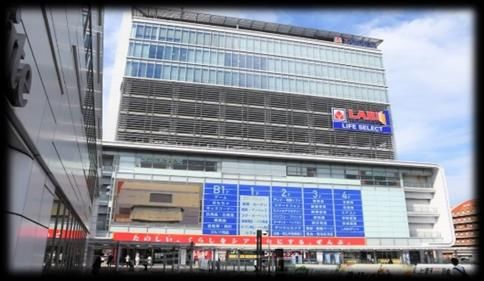
Review of Previous 3 Years
                                                                           Sales Strategy
●Complete the business foundation by                                  ●DX strategy, including introduction of electronic price tag
  structural changes for The “Total-Living” shop                         to all stores
     Governance
                                                                      ●Expansion of stores & E-commerce
●Transition to a holding company,
                                                                      ●Expand sales of SPA products and increase ratio of profit
  strengthening governance
                                                                        -Main products : Electric sofa and electric reclining bed
●Branch office system, area management
                                                                        -Exclusive Sales…FUNAI・Roborock
●Visualize the store profit and loss, individual unit measures
                                                                      ●Actual gross profit margin increased with
  in areas
                                                                         sell-out/in management.
●Implement personnel and cost structure
    Store strategy                                                    ●Grow renovation business can be completed by ourself
●New concept store YAMADA Web.com, outlet stores
                                                                              M&A
  and LIFE SELECT                                                     ●Hinokiya Group becomes a subsidiary
●Respond to structural changes in demand,                                custom built homes 8,000 buildings a year
  restructured stores in Shinjuku area                                    → 300 billion yen a year
●In line with the target of new store openings,                       ● OTSUKA KAGU becomes a subsidiary
  a key issue in the new growth strategy,                                 → A wide variety of furniture and home interiors,
  we started to realize a new large-scale concept store                         expansion of sales quality and delivery system

                                                    YAMADA HLDGS 2025 Mid-term business plan                                         10
Changes in the market environment
Global environmental • Worsening environmental problems
• Increased awareness of sustainability
changes • Advancement of information society
• Change in demand caused by declining birthrate and aging population
Current situation of • Transformation of social structure
• Changes in the employment base
the retail industry • Increasing competition across industries
• Extremely growing of E-commerce market
• Growing public health awareness
• New customs (ex.Contactless trade, home-based job)
Changes by COVID-19 • Changes of population distribution, trading area, demands
• Increasing interest in comfortable living space
• Changing needs of electronics
In light of these market changes, we will accelerate our growth
based on our management resources!
YAMADA HLDGS 2025 Mid-term business plan 11“Total-Living”-Expand home appliance through a links each segment
Aim to expansion of home appliances
by “Total-Living”
Environment Home Furniture
・
Household
Finance goods
Housing appliance Renovations Home
Interior
Digital Apps
Create new customer experiences TV
Flyer Stores WEB
advertising
through a variety of information channels Shopping
Customer Base
Platform
YAMADA HLDGS 2025 Mid-term business plan 12About mid-long term business plan
◼ We will aim for growth
without changing our management focus on profit
as we build our base through the results of our measures.
May 2030
①Expansion of sales floor
Promote store strategy by area Net sales
2.5
②Expansion of store network and E-commerce
③Maximize scale, sales, and profits
50 years since
of each segment and subsidiaries trillion yen
establishment
May 2025
Net sales
2019
2021 2
2011 trillion yen
accelerate our
Steer business in the direction
business growth
income-oriented management
Since entering the housing business,
turn to the “Total-Living” shop concept.
YAMADA HLDGS 2025 Mid-term business plan 13Mid-term business plan - Profit & Loss plan -
(million yen / %)
FY2019 2020 2021 2022 2023 2024 2025
Net sales 1,600,583 1,611,538 1,752,506 1,686,000 1,760,000 1,870,000 2,000,000
Y/Y 1.7 0.7 8.7 ▲ 3.8 4.4 6.3 7.0
Operating profit 27,864 38,326 92,078 90,000 95,000 107,000 123,000
Y/Y ▲ 28.1 37.5 140.2 ▲ 2.3 5.6 12.6 15.0
Ordinary profit 36,889 46,074 98,875 97,000 102,000 114,000 130,000
Y/Y ▲ 22.1 24.9 114.6 ▲ 1.9 5.2 11.8 14.0
Ordinary rate of return 2.3 2.9 5.6 5.8 5.8 6.1 6.5
Current net profit 14,692 24,605 51,798 59,000 59,500 61,000 68,000
Y/Y ▲ 50.7 67.5 110.5 13.9 0.8 2.5 11.5
YAMADA HLDGS 2025 Mid-term business plan 14Goal index
(%)
FY2021 FY2025
ROA 4.3 5.0
ROE 8.1 10.5
Ordinary rate of
return 5.6 6.5
Net sales Y/Y 8.7 Every term +5%~7%
ROA = Return on asset
ROE = Return on equity
YAMADA HLDGS 2025 Mid-term business plan 15Transition of target index
12.0
ROA ROE Ordinary rate of return Net sales Y/Y
10.5
10.0 10.1 10.2
10.0
8.1
8.7
8.0
7.0
6.3
5.6 5.8 5.8
6.0 5.2 6.5
6.1
4.7
4.0
5.0
4.0 4.4 4.8
3.0 4.7
2.5 2.9 4.3
2.0 2.6 1.7 2.3
2.1
0.7
0.7 1.2
0.0
FY2018 FY2019 FY2020 FY2021 FY2022(E) FY2023(E) FY2024(E) FY2025(E)
▲ 2.0
*FY2022(E):Net sales decreased 100 billion yen
by recognition
▲ 3.8
▲ 4.0
YAMADA HLDGS 2025 Mid-term business plan 16Net sales growth (trillion yen)
①Expansion of sales floor +145 billion yen
Growth after 3 years
②Expansion of store network and E-commerce
+ 50 billion yen 2.0
③Growth of each segment and subsidiaries
+314 billion yen +119 billion yen
1.87 ①
+18.6p
1.76 May 2025 ②
1.75 50 years since
1.68 establishment
③
FY 2021 2022 2023 2024 2025
YAMADA HLDGS 2025 Mid-term business plan 17Growth profit
(million yen / %)
Growth after 3 years
6.5
+ 33 billion yen
1,400
6.1
6.5
百
1,300 +0.7%
Sales growth
1,200
+20 billion yen 5.8 5.8
1,140 5.9
Profit ratio improvement +13 billion yen
989 1,020
1,000 970 5.3
5.6
800 4.7
600 4.1
461
369
400
2.9
3.5
2.3
200 2.9
0 2.3
FY2019 2020 2021 2022 2023 2024 2025
Ordinary profit Ordinary rate of return
YAMADA HLDGS 2025 Mid-term business plan 18Growth of profit
Profit ratio
= + 0.7P
improvement
FY2022 2023 2024 2025
・Optimize prices by discounts and points=Manage net gross profit
・Expand SPA line【Net sales 12.6%→20%, Profit 20%→40%】*
・Increase Reuse product 【Improve capacity 70 thou→300 thou】
・New products, increasing unit price, value added products
・Compensate for rising labor costs=Improving efficiency through DX
・Continue to restructure human resources and costs
・Integrate and improve the operations of merged subsidiaries,
Shift employee to the sales department
*Composition ratio in product categories
YAMADA HLDGS 2025 Mid-term business plan 19① Expansion of sales floor
YAMADA HLDGS 2025 Mid-term business plan 20Expansion of sales floor = Growth of consumer electronics
■New stores+New concepts+Restructuring of store network
→ Growing strategy through expansion of sales floor
・Under the “Total-Living” concept strategy, we have been
developing store that meet the needs of various customers
by integrating our management base and infrastructure, and
have accumulated successful examples and achievements
・Start restructuring of store network with a focus on new
store at the time of contract renewal for stores have passed
25 years since the beginning of nationwide network
・Focus on the expansion of sales floor as the core of growth
by organizing each business area with its own characteristics
YAMADA HLDGS 2025 Mid-term business plan 21Promote development of stores by area & Our store network
LABI 1
LIFE SELECT TeccLand
Urban, total living products and
M Suburban home appliance
L
services with a focus on home specialty store.
appliance.
The largest selection of
products in the region
Trade
Urban Type LABI area Kaden Sumairu Kan
Suburban store focusing on
Urban home appliance
speciality store. According to home appliance and renovation.
trade area and
customer need
“Total-Living” Outlet & Reuse
proposal focusing
Tecc LIFE SELECT on home appliance Selling old model and reused product
Create new customers and markets.
Suburban, “Total-Living”
products and services with a
focus on home appliance.
Largest product lineups in the
Trade SC・In-shop
region.
area Targeting families, the store
provides familiar home appliance
and services for daily life.
Web.com
M S
Provide services that cover an Small trade area TeccLand
area by integrating stores and
the internet. Community-based
home appliance specialty store.
YAMADA HLDGS 2025 Mid-term business plan 22New concept store 「LIFE SELECT」
・Largest product lineups in the region.
■New concept store ”LIFE SELECT”
Happiness in Total-Living! ・Floor space:10,000㎡~13,000㎡
Home appliance ・Annual sales:3~5 billion yen,
Operating profit margin10% or higher
Furniture, Home interiors to at least 10% of sales.
・Store opening :15 stores per year
Targeting a trade area with 250,000 customers
Effect of store opened
Home appliance & ・Increased number of diverse types of customers ・Home appliance and furniture set sale
Furniture ・Increased in purchase quantity ・Purchase unit price
Furniture &
Renovations,etc
“Total-Living” proposal
Furniture, Home
Home interiors appliance
Fun to
choose!
Professional proposal
Happiness of life
proposal!
Renovations Toys
Fun to
experience!
YAMADA HLDGS 2025 Mid-term business plan 23Expansion of sales floor = Growth of consumer electronics
FY2025 Effect of growing strategy
Net sales +145 billion yen
(80 billion yen)
(㎡)
sales floor
3,185,000
Gross profit + 15.7 billion yen
1.16 times bigger
3,033,000
2,889,000
(comparison with FY2022)
2,745,000
2,613,000 2,602,000 2,630,000 2,630,000
No change in sales floor because of restructuring of existing stores
FY 2018 2019 2020 2021 2022 2023 2024 2025
YAMADA HLDGS 2025 Mid-term business plan 24②Expansion of store network and E-commerce
③Maximize scale, sales, and profits of each segment
and subsidiaries
YAMADA HLDGS 2025 Mid-term business plan 25The concept of growth investment based on resources
Maximize scale, sales, and profits of each segment and subsidiaries
Resources and Infrastructure
Effect of growth investment
Net sales =+169 billion yen
⚫ Network of YAMADA DENKI stores
Environment
LABI:Urban large scale store・LIFE SELECT
Kaden Sumairu Kan・Tecc Land Suburban & Small trade area
Web.com ・Outlet store・In-shop・Cosmos Berry’s
Gross profit =+ 17.3 billion yen Housing
Store development Outlet
& Others
⚫ E-commerce
Reuse
Store・Online store・external EC market Furniture, Finance
Home interiors
Apps・TV shopping・Electronic price tag
Call center operation・Delivery&Installation Corporate
sales
⚫ Marketing・Advertisement method
Growth in E Renovations
TV・Radio・Web・Newspaper advertisement・Digital commerce
business Home Effect of growth
⚫ Logistics network appliance
investment
Delivery&Installation・Repair
Growth in each segment *White base circles are raised by expansion of sales floor
⚫ Supply chain
by investing
SPA(home appliance, furniture and housing accommodation),
50 billion yen Management
Merchandise procurement
resources
⚫ Other services Store・E-commerce・Furniture and Home interiors・ Renovations
Sales engineer・Trade-in and purchase・Warranty・Insurance Outlet&Reuse ・Corporate sales・SPA
Solution・Support・Finance・Payment・Lecture class Marketing and advertisement method・Logistics network・Supply chain・Other services
⚫ Management Housing・Finance・Environment・Human resources・Human resource development
Branch office system to manage employees, strategy and product Customer information・Store development
Group management
YAMADA HLDGS 2025 Mid-term business plan 26② Expansion of store network and E-commerce
YAMADA HLDGS 2025 Mid-term business plan 27Expansion of store network & E-commerce ⇒Growth of consumer electronics
Speciality of our stores & E-commerce Goals for FY2025
●Have a variety of information media
・Store ・Online store ・TV & Radio shopping
・Apps ・Digital advertisement(SNS/Email/Push notification) FY2022
・Paper advertisement(Newspaper and more)
●Wide variety of products, including home appliance, furniture,
home interiors, daily necessities, renovations
Net sales 130 billion yen
Operating profit 7 billion yen
・Delivery, installation of large products, and renovation work are also
available
●Providing last mile solutions using store inventory and delivery
networks
・Customers can pick up and check at the nearest store across the
country
・Speedy delivery and installation from the nearest store
Main growth strategies FY2025
●Website renewal to strengthen the foundation of the website Net sales 180 billion yen
●Increase in the amount of information through TV and radio
shopping
Operating profit 12.3 billion yen
●Use a variety of information channels to launch concentrated
sales products *including E-commerce as well as stores
YAMADA HLDGS 2025 Mid-term business plan 28③Maximize scale, sales, and profits
of each segment and subsidiaries
YAMADA HLDGS 2025 Mid-term business plan 29Renovation business ⇒ Growth of consumer electronics
Basic policy and speciality of our renovation Goals for FY2025
●Not an home appliance retailer that also does
renovation, but a specialty business FY2022
●Proposing mainly water-related products in
combination with home appliances Net sales 60 billion yen
●Original system to manage everything from reception
to accounting
●Remote sales without the need for on-site visits and Operating profit 3 billion yen
efficient sales support by the center
●Develop high value products through in-house
development for competitive advantage
Main growth strategies FY2025
●Operate remote sales without the need for on-site visits Net sales 100 billion yen
in all stores.
●Expansion in line with store network and E-commerce Operating profit 6 billion yen
growth
●Promote the development of original financial products
・Subscription plan *Housing group's renovation sales and profits are not included
・Renovations+Home appliance
A merit plan the rate goes down as the amount goes up
YAMADA HLDGS 2025 Mid-term business plan 30Growth strategy for Housing segment
Speciality of our Housing business Goals for FY2025
●A variety of brand homes to meet wide range
of needs FY2022
Offers 8,000
(No. of new custom-built houses)
●”Housetec“ original housing products
with history and technology Net sales 280 billion yen
Operating profit 8 billion yen
Main growth strategies
●Improve profitability through efficient group FY2025
management
●Expand sales offices to strengthen sales and marketing Offers 10,000
capabilities
●Aiming to expand used resale housing business again (No. of new custom-built houses)
(FY2021→2022 extended about 13 times)
●With the housing as a starting point, offer combined Net sales 350 billion yen
solutions for finance, insurance, home appliance,
and furniture
●Effects of the alliance with Nice Corporation
Operating profit 15 billion yen
*Sales and operating profit are the sum of housing, Housetec, and subsidiary
●Strengthen Housetec's original product development
YAMADA HLDGS 2025 Mid-term business plan 31Maximize the scale, sales, and profits of the environment segment
Number of reused products produced
350,000
300,000
250,000
Operation is scheduled
200,000
to start in 2022
150,000
100,000
50,000
0
Expansion of reuse factory 2020年 2023年
Goals for FY2025
Operation is scheduled
to start in 2022 FY2022
Net sales 30.7 billion yen
Operating profit
1.2 billion yen
Expansion of recycling plant
Operation is scheduled
to start in 2024
FY2025
Net sales 35.4 billion yen
Operating profit
2 billion yen
Establishment of new energy plant
YAMADA HLDGS 2025 Mid-term business plan 32Maximize scale, sales, and profits of the financial segment
・The six financial companies in the
group were integrated and qualified Housing Renovations Goals for FY2025
as agents of “Yamada NEOBANK” to
establish a comprehensive financial
business structure. Total coordinationInsurance
Guarantees of living space counseling FY2022
Net sales
・We provide a variety of financial
products that meet the needs of our
3.5 billion yen
customers' lifestyles to realize a Insurance Payment
“Total-Living”concept.
Various services in the financial segment Operating profit
0.8 billion yen
Subsidiary Services
Yamada NEOBANK Housing loan
Housing YAMADA FINANCE Yamada Flat 35
Loan SERVICE Bridge loan
Yamada Flat PLUS
Renovations YAMADA FINANCE
FY2025
Yamada living loan
Loan SERVICE
Payment
Yamada Financial LABI card
Net sales
7.8 billion yen
Credit and debit YAMADA FINANCE Best card
SERVICE Yamada NEOBANK debit card
Insurance
YAMADA SMALL AMOUNT
SHORT TERM INSURANCE
Disaster insurance
Rental housing insurance Operating profit
2 billion yen
Machinery insurance
Insurance agency for general
Yamada Life Insurance
Insurance customers
counseling YAMADA FINANCE Insurance agency for group
SERVICE companies
Guarantees Repair Depot Guarantees
YAMADA HLDGS 2025 Mid-term business plan 33Three-year cash flow plan
To Invest free cash generated by growth in each segment
・Opening new stores, expansion and renovation of existing stores
・An aggressive investment in M&A getting immediate profits and DX strategy
→ Flexible allocation to additional shareholder returns
Investment in ・Expansion of sales floor
・Investment in existing stores
stores ・Expansion ・Renovations
・Concept change
80 billion yen ・Optimizing the lineup
Operating cash flow
240 billion yen Capital management ・DX
・M&A
(Net profit + Depreciation)*3 terms
Growth strategy
・Flexible shareholder
160 billion yen returns
Including corporate tax
YAMADA HLDGS 2025 Mid-term business plan 34Transition and forecast of ROIC&WACC ROIC = Return on invested capital
(million yen / %)
1,400 WACC = Weight average cost of investment 10.50%
10.00%
Operating profit(Before tax) ROIC WACC 9.30%
1,230
1,200 7.90%
8.40% 8.50%
・Profit-focused management 1,070
7.36% 7.00%
・Shift to business growth
1,000 →Large returns 950
890 Shift to “Total-Living” concept and measures. 921 900 6.50%
Low returns due to aggressive investment
800
4.47% 4.50%
4.31%
600
3.11% 582
579 2.87% 2.90%
2.62% 2.50%
388 2.14% 383
400 339 343
1.60%
279
199 0.50%
200
0 ▲1.50%
FY2012 2013 2014 2015 2016 2017 2018 2019 2020 2021 2022(E) 2023(E) 2024(E) 2025(E)
Reform of result ・ Complete the business
Developing the “Total-Living” strategy ・ Carry out a reform ・ Investment priority
foundation・Shift to business growth
YAMADA HLDGS 2025 Mid-term business plan 35Shareholder returns
Basic policy
■ Provide continuous and stable dividends
■ We will make a comprehensive judgment on investment for growth and
financial conditions, and returning profits at an appropriate level
according to the situation
30.00 90.00
Dividends per share Basic earnings per share 80.00
25.00
70.00
20.00 60.00
50.00
15.00
40.00
Aim to payout ratio of 30% or higher
10.00 30.00
20.00
5.00
10.00
0.00 0.00
(yen) FY2013 2014 2015 2016 2017 2018 2019 2020 2021 2022(E) 2023(E) 2024(E) 2025(E)
Dividends per share 6.00 6.00 6.00 12.00 13.00 13.00 13.00 10.00 18.00 19.00 20.00ratio of22.00
Aim to payout 25.00
30% or higher
Basic earnings per share 23.56 20.21 11.73 38.22 43.00 36.77 18.18 28.38 62.82 72.00 72.50 74.30 85.00
YAMADA HLDGS 2025 Mid-term business plan 36【Attention】
The outlooks and business plans contained in this document are based on
assumptions and judgments made by ourself based on information
available at the time this document was prepared.
The accuracy and security of the information is not totally guaranteed or
promised. These are subject to change.
YAMADA HLDGS 2025 Mid-term business plan 37You can also read