2016 Strategy Update New Platform to Deliver on Assets Modernization - London, May 2016 - Norilsk Nickel

Page created by Alfred Willis
 
CONTINUE READING
2016 Strategy Update New Platform to Deliver on Assets Modernization - London, May 2016 - Norilsk Nickel
2016 Strategy Update
New Platform to Deliver on Assets Modernization

London, May 2016
2016 Strategy Update New Platform to Deliver on Assets Modernization - London, May 2016 - Norilsk Nickel
Disclaimer
The information contained herein has been prepared using information available to PJSC MMC Norilsk Nickel (“Norilsk
Nickel” or “NN”) at the time of preparation of the presentation. External or other factors may have impacted on the
business of Norilsk Nickel and the content of this presentation, since its preparation. In addition all relevant information
about Norilsk Nickel may not be included in this presentation. No representation or warranty, expressed or implied, is
made as to the accuracy, completeness or reliability of the information.
Any forward looking information herein has been prepared on the basis of a number of assumptions which may prove
to be incorrect. Forward looking statements, by the nature, involve risk and uncertainty and Norilsk Nickel cautions that
actual results may differ materially from those expressed or implied in such statements. Reference should be made to
the most recent Annual Report for a description of major risk factors. There may be other factors, both known and
unknown to Norilsk Nickel, which may have an impact on its performance. This presentation should not be relied upon
as a recommendation or forecast by Norilsk Nickel, which does not undertake an obligation to release any revision to
these statements.
Certain market share information and other statements in this presentation regarding the industry in which Norilsk
Nickel operates and the position of Norilsk Nickel relative to its competitors are based upon information made publicly
available by other metals and mining companies or obtained from trade and business organizations and associations.
Such information and statements have not been verified by any independent sources, and measures of the financial or
operating performance of Norilsk Nickel’s competitors used in evaluating comparative positions may have been
calculated in a different manner to the corresponding measures employed by Norilsk Nickel.
This presentation does not constitute or form part of any advertisement of securities, any offer or invitation to sell or
issue or any solicitation of any offer to purchase or subscribe for, any shares in Norilsk Nickel, nor shall it or any part of
it nor the fact of its presentation or distribution form the basis of, or be relied on in connection with, any contract or
investment decision.

                                                                                                                           1
2016 Strategy Update New Platform to Deliver on Assets Modernization - London, May 2016 - Norilsk Nickel
Strategy Update 2016 – Agenda

   Strategic vision | Andrey Bugrov

   Operations Update | Sergey Dyachenko

   Investment Governance and Portfolio Update | Sergey Dubovitskiy

   Markets | Anton Berlin

   Financial Strategy and Results | Sergey Malyshev

   Corporate Governance | Andrey Bugrov

                                                                      2
2016 Strategy Update New Platform to Deliver on Assets Modernization - London, May 2016 - Norilsk Nickel
Strategic vision

         Andrey BUGROV
Deputy Chairman of the Board,
        Senior Vice-President
2016 Strategy Update New Platform to Deliver on Assets Modernization - London, May 2016 - Norilsk Nickel
Strategic Goals for 2016–2018 –
“Three Years of Assets Modernization”

                                                                       2016–2018

                                                   “Round 2”: Assets Modernization
                     2013–2015                        Delivering on downstream reconfiguration /
                                                       Closure of 1942 Nickel Plant
“Round 1”: Building Efficiency Platform
                                                      Advancing on Environmental Protection /
   ROIC/Tier I/capital discipline
    strategy adopted
                                                      “One site” solution for the sulfur project
                                                      Redefining copper value chain
   Refocusing on Tier I assets                
                                                      Launch of the new asset – Bystrinskiy project
   Successive “quick wins” – CapEx, working
    capital, operating costs
                                                     Verification of the business case for
                                                       upstream growth optionality
   Non-core and Non-Tier I disposals          

                                                                                                       4
2016 Strategy Update New Platform to Deliver on Assets Modernization - London, May 2016 - Norilsk Nickel
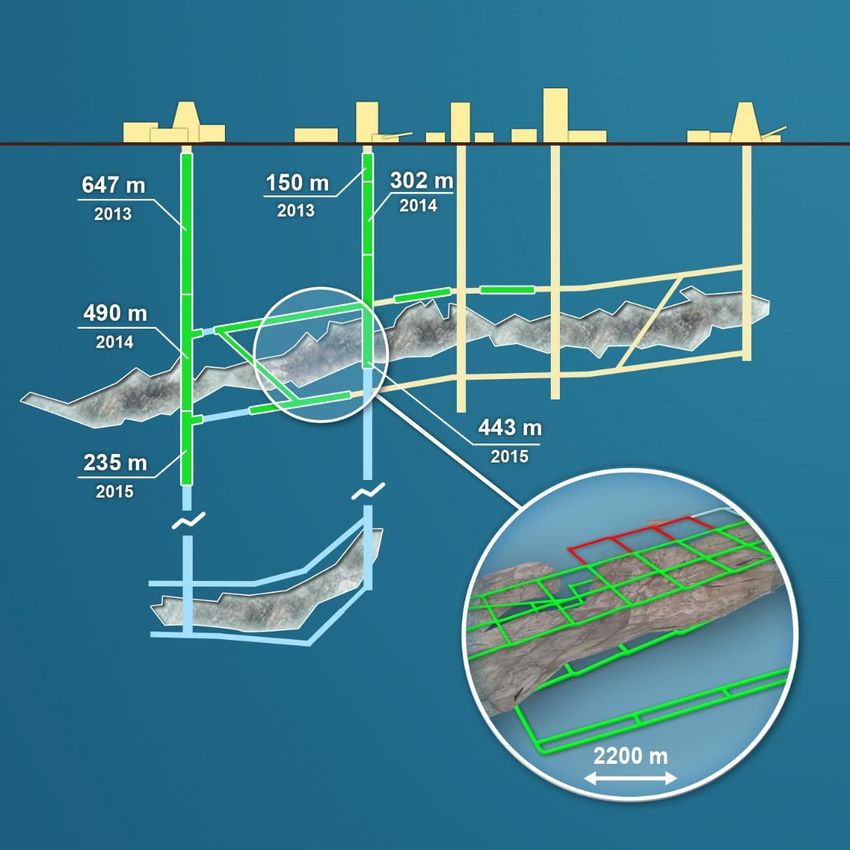
Capital Discipline in Action –
Delivery on Norilsk Strategy “Round 1”
Despite Challenging Commodity Market                                                  … Norilsk Delivered Industry-leading Financial
Environment…                                                                          Results While Maintaining Conservative Leverage
Bloomberg commodity index, bp                                                         Net Debt/EBITDA, 2015                       EBITDA Margin, 2015
200

        High: 174                                                                                      1.0x                               50%
180

160                                                                                                     1.1x                              36%
                                                                                          Peer 1

140

                                                                                          Peer 2               1.8x                       42%
120                                                                   -57%

100                                                                                       Peer 3                      2.7x                24%

 80
                                                                                          Peer 4                        3.0x               5%
                                                                  Low: 74
 60
   2011       2012          2013         2014          2015          2016
                                                                                          Peer 5                               3.6x       19%

            Note: the peers group includes Rio Tinto, BHP Billiton, Vale, Glencore, Anglo American
                                                                                                                                                        5
2016 Strategy Update New Platform to Deliver on Assets Modernization - London, May 2016 - Norilsk Nickel
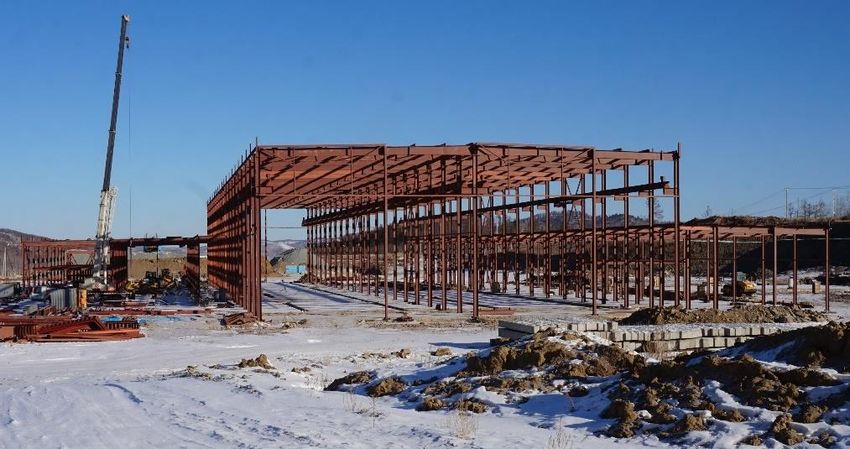
Capital Discipline in Numbers –
Quick Wins of Norilsk Strategy “Round 1”

                                                                                                                3
                                                                            2                    Release of Unproductive Capital

                  1                                                 Capital Discipline          Economic Impact of Initiatives
                                                                                                (US$ in bn)
      Operational Efficiency                            Capital Expenditures
                                                        (US$ in bn)                                    2.0
Nickel Equivalent Unit Cash Cost                              2.0                    Guidance
(2012=100%)
                                                                                         1.7
1,1
                                                                           1.3
1,0                                                                                                                    0.8
                                   -39%
0,9

0,8
                                                                                                   NWC’13–15 Non-core Assets
0,7                                                                                                 Reduction (1) Sales
                                                             2013          2014          2015
0,6

0,5
      2012     2013       2014        2015

             Note: 1. Adjusted for external factors and one-off effects.
                                                                                                                                   6
2016 Strategy Update New Platform to Deliver on Assets Modernization - London, May 2016 - Norilsk Nickel
Industry-Leading Shareholder Returns

While the Global Metals & Mining Industry Lost                                                          Norilsk Nickel Delivered Positive and Industry
Almost US$1.0 trillion in Shareholder Value…                                                            Leading Total Shareholder Return, 2013–2016 YTD1
Market Capitalisation of MSCI World Metals & Mining Index
(US$ in trln)
                                                                                                                    Norilsk Nickel                                                                 11%
1,4
                                                                                                                         RTS M&M                                     (18)%
1,2       High: 1.4

                                                                                                                               Peer 1                           (27)%
1,0
                                                                                                                               Peer 2               (48)%
0,8
                                                                                     -71%
                                                                                                      NN Commodity Basket                             (44)%
0,6
                                                                                                                               Peer 3             (50)%
0,4
                                                                                                                               Peer 4         (57)%
                                                                               Low: 0.4
0,2
                                                                                                                               Peer 5 (62)%
0,0
   2013                    2014                          2015                         2016                                              (80)% (60)% (40)% (20)%                         0%         20%

                 Sources: Bloomberg, Companies data; The peer group includes Rio Tinto, BHP Billiton, Vale, Glencore, Anglo American.
                 Note: 1. For Norilsk Nickel and peers total shareholder return calculated as the total percentage change in share price, inclusive of all dividends paid and announced (ex-div date)
                 in a period from April 2013 to April 2016. For indices and commodities – percentage change index from April 1, 2013 to April 1, 2016.                                                   7
2016 Strategy Update New Platform to Deliver on Assets Modernization - London, May 2016 - Norilsk Nickel
Strategic Focus for 2016–2018 – “Round 2”
Balanced, Modern and Environmentally Friendly Assets
                                                                                  Implemented (in execution) at the 1st stage of the reconfiguration program

                                      Nickel Chain                                                               Copper Chain
             Balanced Ni                        Comprehensive solution for               New «copper configuration»–comprehensive solution
           smelting capacity                    “SO2 problem” in Ni stream               for “SO2 problem” in Cu stream (“One-site solution”)

              Nadezhda                                                                        Nadezhda Plant                         Copper Plant
               smelting
            capacity, Mtpa                                                                                                  Smelting
Smelting

                                                                                                                          (Copper plant)

            1.9
                                2.4      +
                                                                                       New facilities on
                                                                                       Nadezhda plant
                                                 Nickel plant shutdown in 2016                                                                     +

                                                 SO2 capturing project is under             Converting
                                                                                                                                      1 Upgrade of existing
           2013             2016                  way                                                                                   Sulphur production
                                                                                                                                           facility at the
                     Modern and flexible Ni-refining capacity                                                                              Copper plant
                                                                                               Anode
                            Ni refining capacities, Ktpa                                      smelting
                                                                                                                                     2    Shutdown of the
                                                                                                                                            most polluting
                                                                                                                                              facilities
Refining

                    145
                                                                                                                        Electrowinning
                                                                                                                         (Copper plant)
                                           65
                                                                 45

                                                                                         3
                                                                                              Sulphur production from low-sulphur gases to be
                   Tank-                  NNH                 Tank-                            concentrated on one site – Nadezhda Sulphur Project
                  house-2                                    house-1

                                                                                                                                                                8
2016 Strategy Update New Platform to Deliver on Assets Modernization - London, May 2016 - Norilsk Nickel
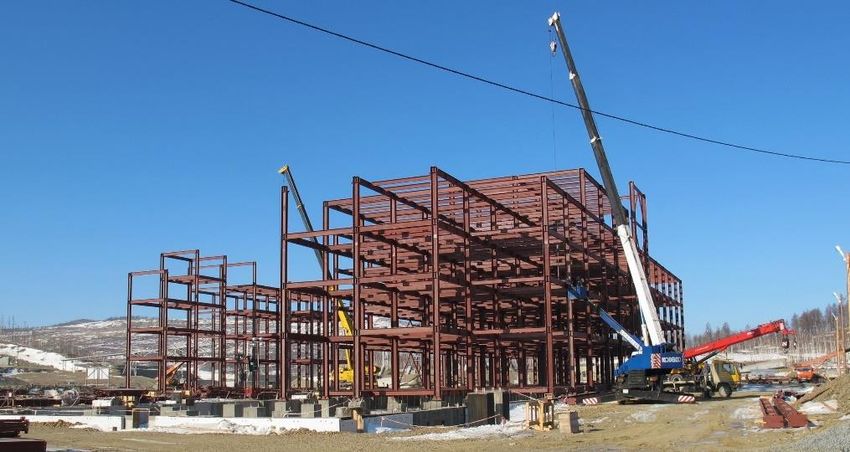
Strategic Focus for 2016–2018: Verification of Upstream
Business Case and Strategic Options

              Focus on Talnakh development

      Verified mine plan - to maintain Norilsk Nickel metal
                production level in the long-term

                   Talnakh ore production, Mt

                           +20–25%
                                                  17.5–18.5
                                                                  Strategic options for future
                            15.5–16
       14.8                                                              partnerships
                                                                   Chita project – building a new mining
                                                                   center in Siberia / Far East region in
                                                              1    partnership with Chinese and other
                                                                   potential investors

                                                                    South Cluster:
                                                                     potential development option –
                                                                      investment case for ore production
                                                              2       growth up to 6Mtpa
                                                                     partnerships to de-risk the project
       2015                  2020                    2025             considered

                                                                                                            9
Responsible Corporate Citizen in Dialogue with Stakeholders
and Partnership with Government

   Support of major                    Sustainable                          Employees                                  Partnership with the
  nation-wide sports                 development of                       partnership and                                  Government
 and cultural projects*                 territories                         motivation

                                  Norilsk Airport                     Renewed 3-year                               Stable fiscal
                                   (Alykel)                             collective                                    environment
                                   reconstruction                       bargaining
                                                                        agreement                                    Early cancellation of
                                  Norilsk City                                                                       export duties on nickel
                                   infrastructure:                     ‘Our home’ and ‘My                            and copper
                                                                        home’ housing
                                     •   Kindergartens                  programs                                     Railroad to Bystrinsky
                                     •   Hospitals                                                                    project
                                     •   Water park                    ‘Cumulative equity
             Golden Mask             •   Shopping mall                  pension’ program                             Co-financing of Norilsk
             Art Festival
                                     •   Churches                                                                     Airport reconstruction
                                                                       Relocation
                                  Fiber-optic high-                    program for Norilsk                          Dialogue on support
                                   speed internet                       citizens                                      for environmental
                                   to Norilsk                                                                         program
                                                                       Subsidies on the
                                  Pasvik Natural                       basic food basket                            Strategic partnerships
                                   Reserve                              in Norilsk                                    with state-owned
                                                                                                                      banks

                   * Football Union of Russia, CSKA Basketball Club, Sochi 2014 Olympic Games, Krasnoyarsk 2019 Winter Universiade, Golden Mask
                   National Performance Arts Festival, Rosa Khutor Olympic Ski Resort                                                             10
Promotions in the Top Management Team
            Sergey Dubovitskiy                                            Vladimir Zhukov
            Vice President                                                Vice President
            Head of Strategy                                              Head of Investor Relations

  ▪ Joined Norilsk Nickel in 2013 as Head of Strategic            ▪ Joined Norilsk Nickel as IR Director in 2013
      Planning Department
                                                                  ▪ 15 years of experience in the metals and mining
  ▪ Spearheaded the development and updates of the                  industry
      corporate strategy, supervised capital investment policy
                                                                  ▪ Prior experience: Metals and mining equity research
  ▪ Prior experience: 6 years in strategy function in the oil &     analyst at HSBC, Lehman Brothers/Nomura, Alfa Bank
      gas industry and McKinsey&Co
                                                                  ▪ Holds PhD from the University of Nottingham Business
  ▪   Holds MBA from INSEAD Business School                         School

                                                                                                                          11
Operational Priorities

                                                                                    Next Round of Modernization &
                                                                                         Strategic Optionality
                                                  “On Time/On Budget”           3
          Uncompromised Focus                       Project Delivery
            on Health, Safety           2
            and Environment
1

                                                                                     Second phase of modernization:
                                                                                      comprehensive solutions for
                                                                                      environmental issues:
                                             First phase of modernization is
                                              close to completion:                    ‒ cost-effective
       Health & Safety culture               ‒ Talnakh concentrator – upgraded       ‒ based on new technologies/“no
        change                                                                           dogma” approach to solution
                                              ‒ Nadezhda smelter – upgraded
                                                                                         space definition
                                              ‒ Norilsk nickel smelter shutdown –
       Strategic aspiration for                                                     Optionality for strategic
                                                 75% complete
        “Clean Norilsk” – with                                                        partnerships – priority for
                                             15 mining (brownfield extensions)
        material progress achieved at                                                 scalable options with low risk and
                                              projects commissioned                   relatively short lead time (South
        both NN sites in 2016
                                             Bystrinskiy project on track            Cluster)

                                                                                                                           12
Operations Update

Sergey DYACHENKO
    First Vice-President
 Chief Operating Officer
Operations Update

                 Focus on health, safety and environment –
                  world-class standards

                          Downstream reconfiguration is on track –
                           over 50% of projects commissioned

                          Major Upstream projects are on track

                 Potential development projects – value creation
                  options in case of market recovery

                                                                      14
Adherence to High Health & Safety Standards –
Progress Update
LTIFR Dynamics                                              Health and Safety Culture Change
1*10-6                                                       DuPont production safety culture index

                            -24%
          0.80
                                                                                                                2.30
                                              0.61                                              2.10

                             0.46                                       1.40

         2013               2014              2015                    Mar 14                  Mar 15           Mar 16

                                                                  Ongoing implementation of Group safety standards in
                                                                   key areas
                                                                  Production safety training and assessment
                                                                   program under way

Strategic Objectives:

    1     Zero-fatality on production sites

    2     Sustainable LTIFR improvement – two-year average went down by more than 20 %

                                                                                                                         15
Progress in Implementation of
“Environmental Roadmap for New Norilsk”
                                                                                         Polar Division SO2
                  Project                            Impact                              Emissions Impact
                                                                                   (mtpa)

                        Talnakh           Increased Sulphur content in
                      concentrator         tailings                                                -15%
                       upgrade &          Enables moving smelting                          1.8
                       expansion           operations from Nickel to
                                           Nadezhda plant                                                 1.5-1.6

“Environmental
  roadmap”
                       Nickel plant       SO2 emissions in
 (completed and       agglomeration        residential areas to
    close to         facility shutdown     decrease by 170-190 ktpa
   completion
    projects)

                       Nickel plant       SO2 emissions in
                     electric furnaces     residential areas to
                        and anode          decrease by 160-180 ktpa                         2014           2017
                         smelters
                        shutdown                                                     Emissions in residential
                                                                                      areas cut by 30-35%

                                                      Emissions from facilities located outside of residential areas
                                                      Emissions from facilities located within the city of Norilsk area

                                                                                                                    16
“One Site” Solution

                                                                                              New solution:
            Previous solution:
                                                                                     Single project with a number of
  “Two sites – two independent projects”
                                                                                        modernization initiatives
        Nadezhda                       Copper                                         Nadezhda                              Copper
          plant                         plant                                           plant                                plant
                     Furnaces                                                                             Furnaces

                                                                                                                                           Upgrade
  !                                             Existing                       !                                                   Existing

                                                              Upgrade
                                              Sulphur shop                                                                       Sulphur shop
      SO2                                                                 SO2
                    Converters                                                                            Converters
                                                                                                 New
   Sulphur                                             !
  project #1                                     SO2                     Sulphur                                                     SO2
                                                                        project #1
                                                Sulphur                                                                             Sulphur
                                               project #2                                                                          project #2

                   Electrowining                                                                            Electrowining
                                                                         Construction of new converters
                                                                          based on new technology of
                                                                            “weak” gases treatment

                                Cu cathodes                                                                        Cu cathodes

                                                              Achievement of regulatory targets for emissions reduction
                                                              Maintenance of copper production capacity
                                                              Projected CAPEX saving (to be specified based on detailed
                                                               engineering)

                                                                                                                                                     17
Nadezhda Sulphur Dioxide Capturing Project –
Progress to Date

               May
               2015
                        I
                             Tender process Stage 1 was completed with a decision to
November’15
                             separate detailed engineering and construction phases

                             Feasibility study completed and approved by the
December’15
                             government’s technical expertise («Glavgosexpertisa»)

                        II
 January’16                  Stage 2 tender initiation

 February’16                 Engineering survey on site is in progress

    April’16                 Construction site preparation is in progress

                             Detailed engineering contract awarded to one of the world
    May’16
                             leaders in engineering and construction market – SNC Lavalin

               May
               2016

  Dialogue with Russian Government on support measures for the Company’s environmental program launched

                                                                                                          18
Production Reconfiguration Program – Overview

            Reconfiguration Program
                            Assets Location                                           Mining      Concentrating           Smelting                Refining

                                                                                                                                                                     Cu cathodes
                                                                                                                        Copper Smelter          Copper Refinery

                                                               Polar Division
                                                                                                     Norilsk
Kola Division and               Polar Division                                                     Concentrator

                                                                                                                                     Upgrade
 NN Harjavalta                                                                                                                                                       PGMs in
                                                                                      7 Mines
                                                                                                                                                                     concentrate

                                                                                                             Upgrade
                                                                                                                                                Precious metals
                                                                                                                       Nadezhda Smelter             refinery
      Kola Division
                                                                                                    Talnakh
                                                                                                  Concentrator
                                                                                                                        Nickel Smelter          Nickel Refinery
  Finland
                                                                                                                                                                     Ni cathodes

                                                               Kola Division & NNH

                                                                                                                                                           Upgrade
NN Harjavalta                                       Chita                                                                                                            Cu cathodes
                                 Russia
                                                                                                                                                                     PGMs in
                                                                                                                                                  Kola Nickel        concentrate
                                                                                                                                                   Refinery
                                                                                      2 Mines      Zapolyarny               Nickel
                                                                                                   Concentrator            Smelter                                   Ni cathodes
                                                                                                                                                                     Ni salts
                                                                                                                                               Harjavalta Refinery

     Mining operations                                                                                                                                               Cu conc.
                                                               Chita

     Concentrators                                                                                                                                                   Au conc.
                                                                                     Bystrinsky    Bystrinsky
     Metallurgical plants                                                             O/P mine    Concentrator                                                       Fe conc.

                                       Overall cost saving and improved recovery
    Reconfiguration                    SO2 emissions reduction by 15% resulting from concentrator upgrade and Nickel plant shutdown;
    impact                              significant decrease of emissions in residential areas
                                       Energy consumption reduction by Polar Division

                                                                                                                                                                                19
Reconfiguration Program – On-time Delivery in Progress

            Reconfiguration Program
                                          2014                                  2015                                 2016                             >2017

1

    Nickel plant shutdown                                                              75% of smelting capacity is   Complete plant
                                                                                                                                           Rehabilitation
                                                                                                down                   shutdown

2
    Talnakh concentrator
                               Phase 1
    upgrade and capacity                                                                       Phase 2 completed
                              completed
    expansion

3
                            Smelter upgrade                                     Nadezhda plant upgrade
    Nadezhda smelter
                              (phase 1)                                       completed; all Nickel smelting
    upgrade
                              completed                                      operations moved to Nadezhda

4
                                                 Re-launch of the Nickel Tankhouse-1
    Kola downstream
    upgrade                                      Cobalt electrowinning facility launched
                                                 Concentrate briquetting facility launched
5
          5
                                                                          FS completed, regulatory approvals             Construction works with gradual
    Kola refining upgrade
                                                                             received, contractor selected                commissioning in 2017–2019
    and expansion

                                                                                                                                                              20
1    Nickel Plant Decommissioning –
     Two Main Facilities Shut Down in April
     Reconfiguration Program

                       Current state                                           Next steps

 To date – 75% of smelting capacity is down                     All facilities to be shut down by
                                                                  October 2016
    Agglomeration                       Smelting
                                                                 2016+ – closure and site rehabilitation
     Agg. facilities         Smelters              Converters

                                                                                                            21
2     Talnakh Concentrator Upgrade (Phase 2) –
      Successfully Completed
       Reconfiguration Program

                                                       Phase 2 – upgrade &                                   Phase 3 (potential) –
                   Phase 1
                                                  capacity expansion to 10.2 mtpa                       capacity expansion to 16.0 mtpa

 Optimized utilization                          Capacity increase up to 10.2 mtpa                     Next steps:
 Increased of nickel recovery rate by 1 p.p.    Concentrate volume decrease enables Nickel             Update of project design as well as budget
                                                  plant shutdown                                          & schedule
                                                 Recovery improvement:                                  Confirmation of economic impact

                                                 ‒ Impact of new technology (7.7 mtpa): Ni up to 1%
                                                 ‒ Impact of re-directing volumes from Norilsk
                                                   concentrator to Talnakh (2.5 mtpa): Ni – 2 %, Cu –
                                                   2 %, PGM – up to 4 %

            Completed in 2014                        Commissioned in May, 2016

                                                                                                                                                       22
23
3     “Single Stream” Smelting at Nadezhda Plant – “On
      Track” Commissioning in March 2016
      Reconfiguration Program

Smelting capacity, Mmtpa            Moving of all Ni smelting operations to Nadezhda plant

                 2.4
    1.9

    2014         2016                  Norilsk             Nickel plant           Nickel plant
                                     concentrator
                                               Ni conc.

                                                                        Upgrade
                                               Ni conc.
                                      Talnakh
                                                          Nadezhda plant          Kola refinery
                                    concentrator

                                                                                      NNH
                                    Concentrating            Smelting               Refining

                                     Upgrade of smelting, concentrate drying and
                                      filtering facilities

                                                                                                  24
4    Kola Downstream Modernisation: Launch of New
     Facilities and Added Synergy with Polar
     Reconfiguration Program

    Concentrate briquetting facility         Launch of cobalt cathodes                    Re-launch of Ni
1                                      2                                       3
           commissioned                             production                             Tankhouse-1

            >30 ktpa                               +US$25m                                  +45 ktpa
             reduction                                EBITDA                           of nickel production
         of SO2 emissions                                                                    capacity
    Reduction of emissions in the          Additional profitability compared       Additional capacity to balance
    concentrate preparation stage             to selling Co concentrate                  production during
     (Zapolyarny production site)                                                    reconfiguration program

                                                                                                                    25
5   Chlorine Leaching Technology in Kola Downstream –
    Targeting Further Efficiency Gains in 2018–2019
    Reconfiguration Program

      What has been done?                   Next steps                      Expected impact

                                                                      Kola Ni refining capacity, ktpa
                                                                             Tankhouse-1   Tankhouse-2

                                                                            165               190
                                                                             45                45

                                                                            120               145

                                                                           Before             After

 Project design completed         Equipment delivery                Increase of extraction rate by
 Regulatory approvals received    Construction works with staged     >1.0 p.p.

 EPC-contractor selected,          commissioning of new chlorine     Decrease in unit cost at refining
  construction contract signed      leaching technology                stage by ~10%

 Zinc-recovery circuit is         Full capacity from 2019           Improvement of work-in-
  under construction                                                   progress turnover

                                                                                                           26
Reconfiguration Program Impact

              Capital Expenditures                           Expected Impact

(US$ in m)                   % Complete
                             (May 2016)           Government Support through
                                                  the Cancellation of Ni and Cu
       1,010–1,070                                         Export Duties
                                                   (Starting from August, 2014)

             400–420

                                                Cost Optimization

             340–360                                                                Average Yearly
                                                                                   EBITDA Impact
                                                                                  Starting from 2018

                                                Improved Recovery Rates
                                                                                   US$250–300m
             260–290

         2013–2019

     Talnakh conc. upgrade (Phase 2)            Work-in-progress Metal Release
     Nadezhda upgrade and Nickel Pl. shutdown
     Kola Refinery Upgrade

                                                                                                       27
Priority Upstream Brownfield Projects

              Project Highlight

                                        Taimyrskiy Mine                                             Oktyabrskiy Mine                                  Komsomolskiy Mine2
 Reserves covered
    by projects                  63 mt of ore                                                   59 mt of ore
                                                                  2.3%                                                         1.0 %                                               1.5%
              Ni1
                                                                  3.5%                                                         3.1%                    24 mt of ore                1.8%
    Total

             Cu1
                                                                 7.3 g/t                                                      7.6 g/t                                           5.3 g/t
            PGM1

                            Ore production ramp up to 3.9 mtpa by 2022                  Maintain production at 5.0–5.2 mtpa until 2023      Maintain production at 3.8–4.1 mtpa until 2020
                            Next stage to be launched in 2016                           Next stage to be launched in 2017                   Next stage to be launched in 2016
 Project description        CapEx 2016–2018: US$201m                                    CapEx 2016–2018: US$113m                            CapEx 2016–2018: US$140m
                            Completion: 52%                                             Completion: 40%                                     Completion: 47%

                                                72.0                                                            70.0

   CapEx, US$m                                                                                                                                                     45.0
   (actual 2015)

                            7,600m of underground shafts and drifts                     7,100m of underground shafts and drifts             4,700m of underground shafts and drifts
     Completed
      in 2015               Launch of 0.8 mtpa capacity                                 Launch of 1.0 mtpa capacity                         Launch of 0.7 mtpa capacity

      On time/
     On budget                                   /                                                              /                                                  /

                    Note: 1. Ore grade.
                    2. Komsomolskiy mine data doesn’t include Skalistiy mine (Skalistiy mine is illustrated on a separate slide).
                                                                                                                                                                                                28
Skalisty Mine: Project Development on Track

           Project Highlight                                                                  Project overview
 Ventilation Shaft   Main Shaft    Auxiliary Shafts           Ventilation Shaft              Production capacity – 2.4 mtpa

                                                                                             Ore reserves – 58 mt

                                                                                             Estimated Project IRR > 30%

                                                                                             CapEx 2016–2018: ~ US$650m,
                                                                                              2015 CapEx ~ US$256m

                                                                                              Project timeline

                                                                                             Commissioned mining capacity – 500 ktpa in 2015

                                                                                             Next launch – 150 ktpa in 2016

                                                                                             Completion of ventilation shaft #10 in 2018

                                                                                             Completion of main shaft by 2019

                                                                                              Project update

                                                                                             Progress in 2015:

                                                                                                 678m Shaft sinking                           Development
                                                                                                                                2,200m

                                  Existing objects and shafts as at the beginning of 2015                     Reconstruction works
                                                                                                               Construction completed in 2013–2015          29
                                  Total capital mine works planned in 2015–2025
Bystrinsky Project – Pit Design Optimization Results

                                                                                                                        Indicators at 1Q16
       Operational profile
                                                                                                                         macro conditions
                                             Upstream                                                                (US$ in bn)
 Pit optimization resulted in
  significant reduction in
                                             Reserves & Resources: 336 Mt
  waste stripping                                                                                                          CapEx’16–18
                                             Cu – 0.64%
 This in turn allowed to convert            Fe – 20%
  additional 40mt of ore resources           Au – 0.8 g/t
  into mineable reserves                                                                                                             0.9
                                             Capacity: 10 Mtpa

Waste stripping                              Production profile
40,0     m m3
                                             Ore production 10                                       9      10               EBITDA’20+
35,0                                                                                    8
                                             and processing, 8
30,0                                         Mt
                                                                   6                                                               0.4–0.5
25,0                                                               4
                                                                             2
20,0                                                               2
                                                                   0
15,0                                                                        2017      2018       2019    2020–2045
                                                                                                                                    IRR
10,0
                                             Annual production                     2018–2020 (av.)         2021+
 5,0
 0,0
                                             Cu (in concentrate)       kt              45–50             70–75                     >30%
        2016 2017 2018 2019 2020 2021 2022
                                             Au (in concentrate)       koz            250–260            250–260
              Previous design
                                             Fe (magnetite             kt            2000–2100           ~2900
              Optimized design
                                             concentrate)

                 Source: Norilsk Nickel.

                                                                                                                                             30
Bystrinsky Project: 45% Complete

     Project Highlight

                         Railway link to the project site is near completion (227 km, 3.7 mtpa capacity). Project
                         financed in partnership with the Russian Government:

                          Trial operation launched in December 2015, full commissioning in 2016

                         An agreement reached with «FGC UES» regarding power line construction
                         and operation:
                          220kv power line construction is in progress. Commissioning is scheduled for 2Q17

                         Waste stripping at the open pits Ildikanskyi and Bystrinsky-2 is on schedule:

                          3m m3 of waste rock moved in 2015

                         Construction of main facilities/ordering of equipment on track:

                          Contractors have been hired for the construction works (concentrator, camp, etc.);

                          Ongoing construction of more than 20 facilities (ore supply, warehouses, etc.);

                          All concentrator equipment has been ordered (Outotec, FL Smidth)

                                                                                                                    31
Bystrinsky Project: 45% Complete

       Project Highlight
Primary Crusher Construction     Crushed Ore Stockpile

Administration Building          Mechanical Workshops

         Source: Company data.

                                                         32
Further Conversion of Norilsk Unique Resource Base into
Development Opportunities
Reserves and Resources – Polar Division (at 01/01/2016), mt
                                                                                              Comments
             2,103                                 2,103
                                                                            In addition to approved projects (15% of
             15%                                   15%                       reserves) over 50% of reserves and
                                                                             resources were subject to desktop studies
                                                                             during 2015–2016
                                                                            Long-term development scenarios were
                                                                             identified – potential ore production increase
                                                                             of 5–7 Mtpa by 2025–2030
                                                   56%
                                                                            Potential development scenarios:
                                                                              – Talnakh upstream projects
              85%
                                                                              – South Cluster development projects
                                                                              – Talnakh concentrator upgrade (3rd stage)
                                                                            Next stage – project design and schedule
                                                   29%                       development, commencing Investment
                                                                             Committee procedures

         2015 Strategy                         Current state

  Reserves covered by approved projects                        Reserves for further review
  Resources confirmed for development by desktop studies

                                                                                                                              33
Long-term Mining Outlook for Polar Division

               Upstream Development Scenarios, mtpa (ore)

                South Cluster potential development                                       Potential Talnakh concentrator
                 option: marginal returns – “zero”-NPV      Expansion of concentrating
                                                            capacity after Talnakh-3: to        upgrade (phase 3):
                 (@20%) at YTD spot
                                                                     25 Mtpa                Enables South Cluster
24                                                                                           development
            Polar Division concentrating capacity
                  after Talnakh-2: 19 Mtpa
20                                                                                          Provides efficiency gains through
                                                                                             improved recoveries
16

                                                                                            Next steps:
12                                           Base production profile is stress
                                              tested and demonstrates robust                 ‒ 2016–1H17:
                                              profitability even in “gloomy”                     Update of project design and
 8                                            market scenarios                                    economic model

 4                                                                                               Detailed scheduling
                                                                                             ‒ 2H17: Final investment decision
 0
     2015   2016   2017    2018    2019     2020    2021   2022   2023      2024   2025

       South Cluster “development option”
       Base case ore production profile: Talnakh + “sunset” South Cluster

                                                                                                                                 34
Screening for Potential Long-term Opportunities

                                     East Siberia – “home”               Far East – vast undeveloped
     Screening approach          I     region for NN/still       II      resource potential and links to target
                                         underexplored                   Asian market

  Strategic criteria:
   Regions where NN can build                                                           Potential
    on it competitive edge –                                                             Copper
                                                                                         greenfields
    Russian Federation

   Preferred products
    (metals) basket                         Brownfield
                                            exploration
   Potential to become                      Maslovskoe

    Tier I asset                               New exploration
                                               licenses
   Risk mitigation options
    (project financing,
    partnerships, etc.)
                                                                      Prospects around
                                                                      Chita project

                                                                                                                  35
Production Guidance

               Production Guidance from Russian Feedstock
Ni/Cu – kt, PGM – t
(saleable metal)
                              PGM        Cu      Ni

                                                                     95–100         The Company will maintain stable
          99                                     95–100                              production levels after 2016
                              88-93
                                                                                    Copper volumes growth due to
                                                                                     grade increase (and from 2018 –
                                                                    420–440          due to launch of Bystrinskiy project)
         353                 342–352            370–380

         224                 206–212            215–220             215–220

         2015                  2016               2017                2018

                       One-off increase of work-in-progress due to Nickel plant
                        shutdown and moving refining operations to Kola division

                                                                                                                             36
Investment Governance and
           Portfolio Update

    Sergey DUBOVITSKIY
              Vice-President
            Head of Strategy
Norilsk’s Strategic Principles – Set Out in 2013

                          Progress

                             Most non-Tier 1 assets successfully
 Focus on Tier I Assets
                              exited, Stage II Strategic review underway

  Optimal Value Chain        Unprecedented production reconfiguration
       Footprint              program on track

                             Quality of investment governance enhanced
 Capital and Investment
       Discipline            Stay-in-business CapEx and working
                              capital optimized down to industry averages

                             Enhanced focus on Health & Safety
  Social Responsibility      Norilsk’s city area emissions cut
                              by 30–35%

                                                                            38
Strategic Context – Rise in Volatility Combined with
Weak Prices…
                                                                                 Lessons Learnt from Previous Downturns:
                                                                                 Number of Weeks When Ni Price Was Below
Ni Spot Prices -60%, Ni Price Volatility +80%                                    Top Quartile of Cost Curve

                                                                                 100
25 000                                                                     35%

                                                                                  90      87
                                                                           30%
20 000                                                                            80

                                                                           25%    70

15 000                                                                            60
                                                                           20%
                                                                                  50                  47

                                                                           15%
10 000                                                                            40                                                     36
                                                                                                                             30
                                                                           10%    30
                                                                                                                  22
 5 000                                                                            20                                                                 16
                                                                           5%
                                                                                  10

    0                                                                       0%     0
   Apr 2014      Oct 2014           Apr 2015            Oct 2015      Apr 2016         1982-1983 1985-1986      1993        1998        2013     2016YTD
                   Ni Price (US$/t)             Ni Price Volatility                     Number of weeks with the price below upper cost quartile
                                                                                        (years with average annual price below upper cost quartile only)

              Source: Bloomberg, Norilsk Nickel data;
              Note: Rolling annual volatility.
                                                                                                                                                           39
… Driven by Tectonic Shift in Chinese Economic Model

GDP and Investments Growth Rate in China is                                                    Structural Shift in Chinese Economy:
Slowing Down                                                                                   Growth in Services, Reduction in Industry

12%                                                                                            60%

                                      +8%                                      +6%
10%                                                                                            50%

                                      +3%                                      +3%
8%                                                                                             40%

6%                                                                                             30%

4%                                                                                             20%

2%                                                                                             10%

0%
      2010

             2011

                       2012

                               2013

                                        2014

                                               2015

                                                       2016E

                                                               2017E

                                                                       2018E

                                                                               2019E

                                                                                       2020E

                                                                                                 1990        1995     2000        2005      2010          2015

                                      China           World                                             Agriculture   Industry&Processing    Services
                                                                                                        (Primary)     (Secondary)            (Tertiary)

                    Source: Bloomberg, Norilsk Nickel data, World Bank.

                                                                                                                                                                 40
… Impacting Negatively Metal Intensity of the
Chinese Growth
Fixed-Asset Investments Growth
The Lowest Level Since 2000                                                              Ni Demand Growth Rate in China to Normalize
China Fixed Assets Investments (Exc. Rural Households)                                     25%
Cumulative YoY growth

60                                                                                         20%
                                                                                                                                                +13%                        +1%

50                                                                                         15%
                                                                                                                                                +2%                         +2%
40
                                                                                           10%

30
                                                                                             5%
20

10

                                                                                           (5)%
 0

                                                                                                     2010

                                                                                                            2011

                                                                                                                   2012

                                                                                                                          2013

                                                                                                                                  2014

                                                                                                                                         2015

                                                                                                                                                2016E

                                                                                                                                                        2017E

                                                                                                                                                                2018E

                                                                                                                                                                        2019E

                                                                                                                                                                                  2020E
  1999     2002         2005          2008           2011           2014

                                                                                                                                 China          ROW

                                                                                                   +ХХ%        Average growth rate in 2000–2015, 2016–2020E

            Source: Bloomberg, Norilsk Nickel data, JP Morgan Research, NBS Research data, World Bank.

                                                                                                                                                                                          41
…. Challenge the Validity of Many Investment Decisions in
the Industry

Global Miners’ CapEx + M&A: Volatile Capital Intensity Tends to Overact in Up and Down Turns
(US$ in bn)

                                                                                            3.0x Decline
                                                                       104

                                                      74
                                                                                         71

        53                           52                                                                    54

                                                                                                                                                       Overreaction?
                   40                                                                                                       38
                                                                        79
                                                                                         71
                                                      64
                                                                                                                                              26
                                                                                                           52                                                  21
                                     43                                                                                                                                            20
        42
                   36                                                                                                       37

       2008       2009             2010              2011             2012              2013             2014              2015            2016E             2017E            2018E

                                                                       M&A Spending              CapEx

              Source: Bloomberg, Norilsk Nickel data; Total CapEx includes major diversified peers – BHP Billiton, Rio Tinto, Vale, Anglo American, Glencore and Norilsk Nickel.

                                                                                                                                                                                        42
Norilsk Investment Strategy in the Industry Context

   Global Miners Investments
   (US$ in bn)

            224

                                            158

                                                           61

                                                                          Robust (low-risk/high
                                                                           profitability) projects portfolio

   Norilsk Nickel CapEx                                                                  +
   (US$ in bn)
                                                                          Enhanced focus on investment
            6.6                                                            discipline (improved investment
                                                                           governance system
                                             4.9
                                                                           implemented in 2013–2015)

                                                                                         =
                                                                          Consistent/solid investment
       2010–2012                       2013–2015       2016–2018
                                                                           program through the cycle
                           Environmental program (1st Phase) & Chita

            Source: Bloomberg, Norilsk Nickel data.

                                                                                                               43
Strategic Priorities – Focus on Investment Discipline
US$1.0bn of Capital Investment Savings in 2014–2015

Annual CapEx (Norilsk Nickel)
(US$ in bn)

              2.7

                                                                                               Portfolio of highly profitable commercial
              0.7
                                                                                                projects – stress tested under spot
                                     2.0                Guidance / market expectation
                                                                                                macro parameters
                                  2,7                                                   0.3
                                                        0.7              1.7                   Major commercial projects are delivered on
                                                                                                time/on budget (see details on the next slide)
                                    1.0
                                                  1.3
                                                                         1.1    1,3
              2.0                                 0.7

                                    1.0                                                          Stay-in-business investments optimized to
                                                  0.6                    0.6                      industry benchmark levels

              2012                 2013          2014                   2015

                     Stay-in-business Projects   Commercial Projects

                                                                                                                                                 44
Strategic Priorities – Focus on Investment Discipline
Delivery On Key Investment Projects

Schedule Deviation, % of Investments                             Budget Deviation, % of Investments
83% of Investments – On Schedule since 2013                      >95% of investments – On Budget/with Savings

                                               Accelerated 19%
                             4%                                                              4%

                      13%

                                         83%
                                                                                                  96%

        On Schedule          Over 6m delay                          On Budget/with Savings   Overspending More than 20%
        Up to 6m Deviation                                          Overspending Up to 20%

    Rigorous investment governance procedures in action
    Low-risk projects portfolio
    FX impact tailwind

                                                                                                                          45
Strategic Priorities – Focus on Investment Discipline
Stress-tested Profitability of 2013 Upstream Projects Portfolio
                     Portfolio of Upstream Projects – Approved by the Investment Committee in 2013

                     IRR as of 01.01.2013 Based on Original Macro         IRR as of 01.01.2013 Based on Spot Macro
                     Parameters                                           Parameters1
                        %                                                   %

  Skalistaya                             31%                                           27%
 Mine Projects

 Komsomolsky                                   40%                                        35%
 Mine Projects

  Taimyrsky                                                                                          53%
                                                     61%
 Mine Projects

  Oktyabrsky                                                                                                  79%
 Mine Projects                                             91%

                                    20%                                             20%

           Note: 1. Average 1Q16 macro parameters.

                                                                                                                     46
Strategic Priorities – Focus on Investment Discipline
Robust Returns of Current Upstream Projects Portfolio
Returns (Point-forward) Sensitivity of Approved Upstream Projects Portfolio1 to Macro Scenarios
As of 01.01.2016
Ni price
 18 000

                                                                                       IRR 59%    At Average 1Q16 Macro Parameters
 15 000                                                                                           Other Actual (Short-term) Macro Data Points
                                                                                       IRR 60%
                                                                                                  in 2Q15–1Q16

                                        IRR 59%
 12 000

                                                                        IRR 60%
  9 000
                                                                                                  IRR 59%
                                                                                                                           IRR 53%
  6 000

  3 000

               Area of Returns Below 20%

      0
          45              50                   55                  60             65         70         75            80           85           90
                                                                                                                               RUB/US$ FX Rate

                Note: 1. Excluding projects with launch in 2016.

                                                                                                                                                     47
Strategic Priorities – Focus on Investment Discipline
Stay-in-business CAPEX Optimisation
                    Production Assets Maintenance                           Energy Assets Maintenance

                Implementation of risk assessment tools and        Strategy review for Energy business – revised
                 long-term equipment replacement programs            technological solutions
  Approach
                Implementation of Total Cost of Ownership approach
                Enhanced tendering procedures/Review of payment terms

              Example: capitalized maintenance dynamics           Example: Energy business strategy review

                                                Roubles –
                                                                    Up to 20% of CapEx savings (excl. FX impact)
  Examples                                      zero inflation
                                                                     while maintaining the same level of energy
                                                                     supply security
                                                US$ –                (see next slide for more details)
                                                >40%
                 2012-2013   2015-2016          optimization
                  average     average

                                                                                                                     48
Energy Business Strategy Review –
Optimization of CAPEX Program for 2016–2018 by 20 %

PV CAPEX in Energy Assets in 2016–2018
(US$ in m)

                                                                  -19–20%
             890                     -220

                                                                                                    +170                     720
                                                          -120

                                                                             550

     Energy Business           Revision of The      Cost and Payment   CapEx Program in      Additional Projects    “Nov 2015” Strategy
     Strategy “2012”           Projects Portfolio       Schedule        the Same Scope
                                                      Optimization

                      Review of Gas Midstream development strategy                      Additional projects identified due to
                       based on revised technological solution                            more rigorous planning process and
                                                                                          risk assessment
                      Investments synchronized with demand dynamics

                                                                                                                                          49
2016 Investment Plan
US$0.5bn Optimization Vis-à-Vis the Guidance

                                                                                    Potential Tier-1 status confirmed
projects
Growth

                                                               Chita
                                  500–550
                                                           Copper Project
                                                                                    De-risking strategy in implementation – partnership and
                                                                                     project financing

                            2.0               Guidance

                                                          Saving vis-à-vis
                                                           the Guidance

                            1.5                            Downstream               Nickel Plant shutdown, completion of Nadezhda Plant upgrade,
  Base Investment Program

                                  240–270                 Reconfiguration            Talnakh concentrator upgrade – Phase 2 launch

                                                                                    Brownfield extension projects to maintain current
                                                         Upstream Projects
                                  330–370                                            production level

                                                          Other                     Efficiency improvement projects and initiatives (IT, automation,
                                  140–160            Commercial Projects             R&D, exploration, etc.)

                                  250–290                   Maintenance of          Investments in Energy (gas, power) and Logistics (ports,
                                                         Infrastructure Assets       fleet) assets

                                  430–490                  Maintenance of           Investments in maintenance of production assets (equipment
                                                          Production Assets          replacement, fulfilment of regulatory requirements, etc.)

                                  2016 Plan
                                  US$ in m

                                                                                                                                                        50
2016–2018 CAPEX Target – US$2bn p.a.

Cumulative CAPEX 2016–2018
(US$ in bn)                                                                               Goals / Context                          Potential Co-funding
    Growth Projects

                                ~0.9                 Chita Copper              Project completion in 4Q2017
                                                                                                                             Partnership and project financing
                                                        Project                 and ramp-up

                                TBD                 Optional Projects
                                                                               Investment decisions subject to market       Partnership for South Cluster
                                                    Talnakh conc. (Ph.3)       conditions and strategic review results       considered
                                                    South Cluster
 Environmental
   Program

                                TBD                 Sulphur Dioxide            First phase of “One-Site Sulphur
                                                                                                                             Government support discussed
                                                    Capturing Project           Project”

                                 +
                                          4.4
    Base Investment Program

                               0.5–0.6              Reconfiguration            Full completion in 2019

                               1.2–1.4                                         Brownfield projects to maintain current
                                                Upstream Projects
                                                                                level of production
                               0.4–0.5          Other Commercial               Process upgrades (IT infrastructure,
                                                    Projects                    automation), R&D, exploration, etc.
                                                                               Mandatory CapEx – to ensure
                               1.9–2.3              Stay-in-business
                                                                                undisrupted production processes and
                                                        Projects
                                                                                meeting of all obligations

                              2016–2018

                                                                                                                                                              51
Norilsk Asset Portfolio – Status Update

Norilsk Asset Portfolio

                                                 Maslovskoe                                                          Honeymoon Well
 Potential/Greenfields

                         Core Assets

                                                                                                Strategic Review                                               Cash Proceeds &
                                                                                                                                                              Foregone Liabilities
                                                                                                                                Non-Core:
                                                                                                                             Exited/In Closing
                                          Bystrinsky

                                                                                                 Polar :
                                                                                              South Cluster                  Nkomati (50%)(1)                       Closed:
                                                                                              (PGM/Tail Co)
                                                         Kola                                                                           Arkhangelsk Port           US$0.8bn
                                                                                                                    Tati Nickel (85%)
  Operating

                              Polar :
                          Talnakh Cluster                                                                           Nordavia              Inter Rao (13,2%)
                                                          NNH                                                                                                     In Closing:
                                                                                                                     Australian assets
                                                                                              Gas UpstreamCo                    Minority stakes in
                                                                                                                                power grid companies              US$0.6bn(2)

                                                                                                                        Other non-core assets

                                                Tier I                                                        Non-Tier I/Supporting Business

                                 – The size of the bubble represents indicative estimate of the assets’ value compared to each other

                         Note: 1. Closure pending due to regulatory approvals
                               2. Including proceeds from the sale of 0.79% treasury shares (US$158m).
                                                                                                                                                                                52
Norilsk’s Legacy Assets – Status Update

                                                                  Pro-Forma
                                           Overview               Revenue              Core/tier 1?   Status

                                                                  (FY’15, US$ in bn)

                                              PGM-rich
                                                                                                         Asset perimeter
                                               mines (open pit
                                                                                                          defined,
                                               & underground)
                                                                                                          business case
                                               with own                        ~0.4                       under review
                                               concentrating
                                               facility located                                          Strategic
                                               within Polar                                               options
                                               Division                                                   considered
                  Polar “South                                                                            (incl. potential
                                                                                                          partnerships)
                    Cluster”     Norilsk

                                              Upstream                                                  Ongoing legal
                                               cluster of 4                                               restructuring of
                                               developed gas           ~0.1                               gas business
                                               fields in close                                            into Upstream
    Norilsk gas                                proximity to the                                           and
     upstream                                  Polar Division                                             Downstream
                                                                                                          companies

                                                                                                                         53
Bystrinsky Project De-Risking Plan – Implemented

                                Realized De-Risking Initiatives:

                        Leveraging Public-Private Partnerships:

                           Railway link construction on track; to be           Best-in-class mining
Project Status
                            completed by the end of the year                    greenfield project

   Project Launch:        Agreement with Federal Grid and VTB bank on
    On track, planned       construction and financing of grid infrastructure   Tier-1 status in
    for 4Q17                                                                    Norilsk portfolio
                        Bringing high-quality strategic partners:
   Residual CAPEX:                                                             Norilsk reiterates its
    ~US$0.9bn              Sale of a minority stake (13.33 %) to a             strategic interest in
                            consortium of Chinese investors. Binding            operating the project
                            agreement signed in 2015                            and increasing its
                                                                                footprint in the region
                        Securing project financing:

                           US$800m facility from Sberbank for 8 years
                            approved; first installment received in May 2016

                                                                                                          54
Adaptive Dividend Targets Providing Superior Shareholder
Returns and Balanced Financial Model
Uses                                           Sources

New Dividend Targets         Dependent on          Highest quality Tier I mining assets – strong
with Improved Flexibility   Net debt/EBITDA        margins and cash generation even at cycle lows

                               Dividend            Ample liquidity – US$6bn in cash and
                                Floor              committed credit lines as of 1Q16
                                 3.65

                                                   Project financing for Bystrinskiy Project
                             Environmental
                                                   (up to US$0.8bn)
                            Projects & Chita

Highly Profitable,                                 Proceeds from the sale of non-core assets
Disciplined CapEx                                  (executed/signed transactions)
                              Base CapEx
Programme
                                  4.4

                                                   Further strategic optionality – ongoing strategic
                                                   review and non-core asset disposal programs,
                                                   potential pre-payment/streaming options
                              2016–2018

                                                                                                       55
Superior Shareholder Returns

Leading Mining Companies - Projected Dividend Yield for 2016 FY

                             Corresponding
                             to the minimum
                               dividend of
                                  $1.3bn*
        6.2%

                                       4.1%

                                                                         1.7%

                                                                                                           0.1%                              0.0%                              0.0%

    Norilsk Nickel                    Peer 1                            Peer 2                            Peer 3                            Peer 4                            Peer 5

            Sources: Bloomberg, Companies data; The peer group includes Rio Tinto, BHP Billiton, Vale, Glencore, Anglo American.
            Note: 1. Projected dividend yield (ex-date) based on 2016 FY (including interim and final dividends for 2016 FY) - minimal definition of the “floor”, to be increased by Nkomati deal
            proceeds                                                                                                                                                                                56
Key Takeaways

       Norilsk in the industry context – consistent and solid investment program through the cycle
  1

       “All-in” CAPEX Target for 2016-2018 – US$ 2bn p.a.
  2    (incl. “Base Investment Program”, Chita, 1st Phase of Environmental Program and potential options)

       “Base investment program”:
  3    ‒ US$ 4.4bn cumulatively for 2016-2018
       ‒ Portfolio of verified investments: optimized stay-in-business CAPEX levels and stress-tested
          commercial projects

       Portfolio Review: non-core assets disposal program well advanced; ongoing strategic review of the
  4    “legacy” assets; de-risking plan for Bystrinskiy project implemented

       Strategic financial model enhanced through adaptive dividend targets – balanced and providing
  5    superior shareholder returns

                                                                                                            55
Markets

         Anton BERLIN
Head of Strategic Marketing
Macro-Driven Commodity Prices, Increased Volatility

Commodity Prices are Inversely Correlated with
Trade-Weighted US Dollar                                                                        Commodity Price Volatility Increased in 2015-2016

180                                                                                             35
                                                                  Corr (LTM) = -0.94                                                                    Bloomberg Commodity Index

                                                                                                30

150
                                                                                                25

                                                                                                20

120
                                                                                                15

                                                                                                10
 90

                                                                                                  5

 60                                                                                               0
 Apr 2013              Apr 2014                  Apr 2015                   Apr 2016                  янв   фев мар        апр    май     июн     июл     авг   сен   окт   ноя   дек
             USTWBROA                   Bloomberg Commodity Index                                                             2014           2015         2016YTD

            Source: Company data, Bloomberg, WoodMackenzie; As of 25th April 2016.
            Note: USTWBROA Index is a broad trade-weighted USD index relative to other world currencies, as reported by the US Federal Reserve.
                                                                                                                                                                                    59
Lowering of the Cost Curve Driven by Currencies and Oil
Price Depreciation

                                                                               C1 Nickel Total Projects Cash Costs (ex. Norilsk)
Mining Currencies and Oil Price Decline vs. USD                                Down 23% Driven Mainly by Currencies & Oil
End of March 2016/ End of December 2014,                                       US$/t

                                                                                                                                                     (23)%
                                                                        (6)%

                                                                 (9)%
                                                 (11)%

                                    (13)%

                                                                                 12,430

                        (22)%                                                                                                                        9,592

             (26)%

                                                                                                                                             Other
                                                                                   C1 2014

                                                                                                                                                      C1 2016
                                                                                                                     FX Rates
                                                                                                        By-product

                                                                                                                                Oil Prices
                                                                                             Ni Price
  (36)%

                                                                                                          credits
 Oil (WTI)   BRL         ZAR         RUB          CAD            CLP    AUD

             Source: Company data, Bloomberg, WoodMackenzie.
             Note: C1 cash cost 2016 updated as of April, 2016                                                                                                  60
Speculative Pressure Running High on Demand Concerns

Speculative Pressure on Metals Running High:                                             Ni Speculations at Record High Levels:
Change in Exchange Trading Positions                                                     LME Turnover Over 200x of Physical Market
                                                                                   250
1Q 2016/4Q 2014¹                                                                         Mt

                                                                           178%                                                                           245
                                                                                   200

                                                                                                                                                          74
                                                                                   150
         82%
                                                                                                                                                    142

                                         50%
                                                                                   100
                                                                                                                                             101
                                                                                                                                       88

                                                                                                                                66                  116   124
                                                                                                                  58     64
                                                                                   50
                                                                                                            46                               84
                                                                                          32    36    33                              68
                                                                                                                        45     50
         (43)%                                                                                                   41
                                         (46)%                                                  26    24    32
                                                                                          22
                                                                                    0
                                                                           (78)%         2005 2006 2007 2008 2009 2010 2011 2012 2013 2014 2015

          Ni                              Cu                                Pd                               Annual Ni trade volumes (LME Ni quality)
                                                                                         LME   SHFE    xx
        Change in speculative shorts                   Change in net positions                               Annual Ni output (LME Ni quality)

               Source: Company data.
               Note: 1. NYMEX,LME data used for metal trading positions.
                                                                                                                                                                61
Sharp Downward Adjustment of Consensus Forecasts

                                                               Analyst Consensus Ni Price Forecast: Sharp
Nickel LME Forward Curve: No Sense of Direction                Downward Adjustment, Bullish Outlook Retained
US$/t                                                          US$/t

18 000                                                         25 000

                                                                                                  21,200
15 000
                                                               20 000

12 000

                                                               15 000
                                                                                                    US$11,900/t
 9 000

                                                                                                                              12,300
                                                               10 000
                                                                                                                   10,600
 6 000
                                                                                                   9,300

 3 000                                                          5 000
          Spot               3M              15M         27M            Spot       2015          2016        2017           2018

         Jan 2015                 Jun 2015         Apr 2016             Jan 2015      Jul 2015          Apr 2016        Sep 2015

         Source: Company data, Bloomberg.

                                                                                                                                   62
Nickel Market: Little Guidance from Inventory Movements

Total Exchange Inventories Up 19% in 2015,                                        LME Inventories: Relocation Between Asian
Relocation from LME to SHFE                                                       Warehouses Since 2H 2015
Kt                                                                                Mt

 600                                                                     25 000
                                                                                                          456
                                                                                                                          441
                                                                                                                                             431
                                                                                         413
 500
                                                                         20 000

                                                                                                          192             166
                                                                                                                                             165
 400
                                                                                         177
                                                                         15 000

                                                                                                           1
 300                                                                                                                       53
                                                                                          2                                                  59
                                                                         10 000
 200

                                                                         5 000           203              209
 100                                                                                                                      178                166

      0                                                                   0
     Apr 2012      Apr 2013         Apr 2014       Apr 2015         Apr 2016           Dec 2014      Jun 2015           Dec 2015           Apr 2016

                         LME           SHFE        Ni price ($/t)                                 Johor     Singapore   Taiwan     Other

                Source: Bloomberg, Company data;

                                                                                                                                                      63
Ni-Intensive Stainless Steel in China – Healthy Demand

Variety of Chinese Sources: Ni-intensive Stainless                                          … with Modest Growth Rates Continuing into 1Q
Steel Production Up 5–11% in 2015                                                           2016
Mt                                                                                    YoY   Kt

                                                                                             1 200

            +5%                                                                +2%                                                            1Q16:    +3%

                                              +1%
                                                                                     3,4     1 000
                  4,0                                                   3,6
     4,1
                                       3,9          4,0
                                                                               11%               800
            14%
                                              6%                        9,8          10,9
     9,3          10,6
                                       9,2          9,7                                          600

                                                                                                 400
     6,9                                                                7,8          7,2
                  6,6
                                       5,4          5,0

                                                                                                 200
     2014         2015                 2014         2015                2014         2015              Jan Feb Mar Apr May Jun   Jul   Aug Sep Oct Nov Dec
       Source 1                          Source 2                         Source 3
                                                                                                               2013      2014          2015           2016
                          200 series     300 series        400 series
                                                                                                                                                  ХХ%        YoY

                    Source: Company data, Umetal, BGRIMM, TSSINFO

                                                                                                                                                                   64
China – Nickel Destocking in 2015 and Surge of Ni Imports

Implied Ni Units Destocking in China Excluding                                                Strong Increase of Fe-Ni and Refined Ni Imports to
Build Up of SHFE Inventory (48 kt) in 2015                                                    China in 2015 Extended into 1Q 2016
Ni Units, Kt                                                                                  Ni Units, Kt

                                                                                              500            Refined Ni          +125%           +342%

                                                                                                             Fe-Ni               +90%            +15%
                                                                                              400

                                                                                                                                   123

                       118                                                                    300

      198

                                                                                              200
                                          35
                                                                                                                65
                                                                                                                                   292
                                                            48                                                                                      31
                                                                                              100
                                                                                                                130
                                                                             (10)                                                                   106
  Incremental        China         Incremental Ni    Change in            Implied
   net-import      production         usage in     SHFE inventory        destocking              0
     (2015)          losses        stainless steel                         (2015)                              2014               2015            мар.16
                                     production
                                                                                                                          Refined Ni     Fe-Ni
                                                                                                                                                    YoY%

                Source: Company data, China customs statistics, Bloomberg, TSSINFO, UMETAL.

                                                                                                                                                           65
Supply Rigidity – Investment Cycle

Major Ni Projects Ramp-up When Ni Market is                                                                                                                High Reported Ni Stocks: After 3Y of Potential
Trending Downward                                                                                                                                          Drawdowns Inventory Would Still Run High
US$ in bn                                                                                                                                             Kt   Kt

 7,0                                                                                                                                             450

                                                                                                                                                 400        83 days     70
 6,0
                                                                                                                                                 350                          70 –100
 5,0
                                                                                                                                                 300
                                                                                                                                                                                        70 –100
 4,0                                                                                                                                             250
                                                                                                                                                                                                  48 days
 3,0                                                                                                                                             200            485
                                                                                                                                                                                                            40 days
                                                                                                                                                 150
 2,0                                                                                                                                                                                                                  31 days
                                                                                                                                                 100                                     255
 1,0                                                                                                                                                                                                                            8 days
                                                                                                                                                 50

 0,0                                                                                                                                             0
         2000
                2001
                       2002
                              2003
                                     2004
                                            2005
                                                   2006
                                                          2007
                                                                 2008
                                                                        2009
                                                                               2010
                                                                                      2011
                                                                                             2012
                                                                                                    2013
                                                                                                           2014
                                                                                                                  2015
                                                                                                                         2016E
                                                                                                                                 2017E
                                                                                                                                         2018E

                                                                                                                                                               Ni    2016E     2017E    2018E        Ni         Al        Zn        Cu
                                                                                                                                                           exchange                               exchangeExchangeExchangeExchange
                                                                                                                                                           inventory                              inventory inventory inventory inventory
                                                                                                                                                             (2015)                                           (2015)    (2015)    (2015)
                                Production ramp-up                                     Project capex

      Industry inertia (cycles)                                                                                                                                Constant inventory re-allocation
      Barriers to exit/re-entry                                                                                                                                Unknown off-exchange stocks
      Political considerations

                        Source: Bloomberg, Norilsk Nickel data

                                                                                                                                                                                                                                         66
Slow Response From Supply Side Helped by Lowering Cost
Curve

1Q 2016 Average Ni Cash Cost (C1) Down 23% vs. 4Q 2014
US$/t

 30 000

 25 000

 20 000

 15 000

 10 000

  5 000

        0

 (5 000)

(10 000)
            0%             10%               20%              30%         40%         50%             60%   70%   80%   90%   100%

                                                                            1Q 2016         4Q 2014

    Flattening of the Cost Curve
    Decreasing marginal cost – reduced support for Ni price

                 Source: Bloomberg, Norilsk Nickel data, WoodMackenzie.

                                                                                                                                67
Only a Quarter of Loss Making Capacity Runs a
Shut-Down Risk

At Spot Price, Over 70% of Global Nickel Production
is Making a Cash Loss …                                                         … but Only 17% Run a Shut-down Risk
US$/t

 35 000

 30 000                                                                                                                               44%
                                                                                                     30%             70%
 25 000                                                                                                                                        5%
                                                                                                                                               4%
 20 000                                                                                                                               17%

 15 000       2016 consensus forecast of US$9,889/t                                                      Diversified miners
              Average 1Q 2016 of US$8,526/t                                                              Government support
 10 000                                                                                                  Ramp-up
                                                                                                         Price sensitive production (under risk)
  5 000
                                                                                Ni Industry Has Entered a Major Restructuring Phase
        0
                Norilsk

                                                                                Production cuts and shut-downs, kt
 (5 000)

(10 000)                                                                                                                                           218
                                                                                                                     48
(15 000)                                                                                                             90
            00 10%
                 10020% 20030% 30040%
                                    40050%
                                         50060%
                                              60070% 70080%80090%900100% 1000              42
                 Diversified miner              Government support
                 Ramp up                        Price sensitive production                 139
                 Spot price
                                                                                          2015                       2016                   Assets for sale
                                                                                                     China     ex.China      Assets for sale

                   Source: WoodMackenzie, Bloomberg.

                                                                                                                                                              68
Pressure on Loss Making Ni Producers Rising Rapidly

Most of the Ni Industry Became EBITDA Negative
Only in 2H 2015 …                                                                               … Pressure on CFs is Mounting in 1H 2016
EBITDA Ni Segments                                                   Ni price, US$/t            Re-based to Nickel Price, US$/t                               Performance H-o-H

 800                                                                            20 000          18 000
                                                                                                                                          EBITDA
                                                                                                                                          Expansion
 600                                                                                            16 000

                                                                                15 000
                                                                                                                                                                   EBITDA
 400                                                                                            14 000                                                             contraction

 200                                                                            10 000          12 000

   0                                                                                            10 000

                                                                                5 000

(200)                                                                                             8 000

(400)                                                                           0                 6 000
          1H 14            2H 14              1H 15              2H15                                1H 2014              2H 2014         1H 2015        2H 2015        1Q 2016

                  EBITDA Ni segments                Average Ni price                                              Crude Oil (WTI)         Mining Currencies     Nickel price

            Source: Bloomberg, Norilsk Nickel data
            Note: Combined EBITDA includes results of Anglo American, Glencore, Sherritt, BHP Billiton and ERAMET nickel business units                                          69
Nickel Feed for China: Philippines

Nickel Ore Imports from Philippines to China Were                              Mine Life of Nickel Ore Reserves with Ni Grade >1.5%
Down 26% in 2015 and Continue to Fall in 2016                                  in Philippines is Less than 3 Years
Mt                                                                             Ni Units, Kt

10,0                                                                           1 400                                                    3,0

                                                2015 YoY:              (26)%                                                   2.6
                                                                               1 200
                                                                                                                                        2,5
 8,0                                            1Q 2016 YoY:           (25)%

                                                                               1 000
                                                                                                                                        2,0

 6,0
                                                                                 800
                                                                                                                                        1,5
                                                                                 600
 4,0
                                                                                                                                        1,0
                                                                                 400

 2,0
                                                                                                                                        0,5
                                                                                 200

 0,0                                                                                0                                                   0,0
  Mar 2013 Sep 2013 Mar 2014 Sep 2014 Mar 2015 Sep 2015 Mar 2016                           Ni Ore        Ni Reserves         Number
                                                                                                                         Number
                                                                                        Production in   (>1.5%) by the   of Years
                                                                                                                             of Years
                     Indonesia       Philippines      Other                                2015          End of 2015

           Source: Company data, China customs statistics, Bloomberg

                                                                                                                                         70
Nickel Feed for China: Indonesia

Only 3 Projects in Indonesia Have High Probability
of Completion                                                                         Indonesia NPI Output Forecast for 2015-2017
                                                                                      Ni Units, Kt
                                                                          Capacity,   250
Project Name          Process            Status        Start Year         Kt pa Ni

Indoferro                 BF             Started          2013               18
                                                                                      200

PT Cahaya
                          BF             Started
Modern Metal                                              2014               4
Industry                                                                              150

Tsingshan               RKEF             Started          2015               30
                                                                                      100
Tsingshan
                        RKEF               High           2015             60-120
2–3 stages

                                                                                       50
9 projects           RKEF, BF           Medium         2016-2018             70

                     RKEF, BF,                                                           0
8 projects                                 Low         2016-2017            150                      2014             2015E      2016E              2017E
                      Leach
                                                                                                     Commissioned in 2014-2015   High probability
                                                                                                     Medium probability          Low probability

             Source: Company data, China customs statistics, Bloomberg.

                                                                                                                                                            71
Nickel Market Moving into Deficit in 2016

Moderate Supply Cuts Have Been Triggered …                                      … while Global Consumption Holds …
Kt                                       Incremental change in global supply    Kt                                                              Incremental change in global demand

     100                                                                        150                                                                                                +2.0%
                                                                                                        +1.3%                              +2.1%

                                                                                100
     50
                                                                                                                                                                                   40
                                                                                 50
                                                                                                                                                40
       0
                                                                                                      20
                                                                                     0
                                                                                                     2015                                2016E                                    2017E
     (50)
                                                                                … and Growth Reliant on China
                                                                                 Kt
 (100)                                                                                                                                               +3.0%
                                                                                            +3.6%
                                                ?
                                                                       ?
 (150)

                                                                                                                                                                                                 2 000
                                                                                                                                       1 960
                                                                                1 920
 (200)
                2015                    2016E                    2017E

      New projects growth                       Indonesian NPI ramp-up
                                                                                     2015

                                                                                                               Americas

                                                                                                                                                                       Americas
                                                                                             China

                                                                                                      Europe

                                                                                                                                                      China

                                                                                                                                                              Europe
                                                                                                                                        2016E

                                                                                                                                                                                                  2017E
                                                                                                                          Other Asia

                                                                                                                                                                                    Other Asia
      China NPI production losses               Change at existing operations

                Source: Company data.

                                                                                                                                                                                                          72
Palladium Market in Structural Deficit

Palladium ETFs Holdings Change:
Driven by the Macro Concerns                                                          Global Palladium Market: Structural Deficit
Koz                                                                         YoY       Kt                                                      Surplus/(Deficit), Koz

                     1 104
                                                             904

         507                                                                                       1 015
  381                                          430
                                                      24
                                                                            (24)                           (225)                      ETF
                                                                                           (435)
                                                                                                                   (655)             outflow
                                (520)
                                                                    (703)
                                                                                                                           (1,622)
  2008

         2009

                       2010

                                  2011

                                               2012

                                                      2013

                                                             2014

                                                                     2015

                                                                            2016YTD

                                                                                            2010

                                                                                                    2011

                                                                                                            2012

                                                                                                                    2013

                                                                                                                             2014

                                                                                                                                       2015

                                                                                                                                                    2016E

                                                                                                                                                              2017E
                Source: Norilsk Nickel data.

                                                                                                                                                                      73
Platinum Market – Deficit Holds

Platinum ETFs Holdings Change:
2015 Outflow Reversed in 2016                                                         Global Platinum Market: Deficit Holds
Koz                                                                         YoY       Kt                                                  Surplus/(Deficit), Koz

                                                      902

                      583

         384

                                               276
                                                             228
                                 183
  102                                                                                      247    233
                                                                            72
                                                                                                         (261)
                                                                                                                 (574)            ETF
                                                                                                                                 outflow
                                                                                                                         (975)
                                                                    (278)
  2008

         2009

                       2010

                                  2011

                                               2012

                                                      2013

                                                             2014

                                                                     2015

                                                                            2016YTD

                                                                                           2010

                                                                                                  2011

                                                                                                          2012

                                                                                                                  2013

                                                                                                                          2014

                                                                                                                                   2015

                                                                                                                                                2016E

                                                                                                                                                          2017E
                Source: Norilsk Nickel data.

                                                                                                                                                                  74
PGM Demand Drivers In Automotive Industry –
Tightening Environmental Regulations

Increasing Complexity of Emission Systems and
Powertrains Requires Higher PGM Loadings                                  Tightening Emission Legislation
                                                                                            2015   2016    2017 2018      2019   2020   2021      2022    2023     2024 2025
               Requires soot (particulate matter) filter
Gasoline
                (Euro 6c) = more PGMs                                                                                                        RDE Phase 2/95
                                                                          Europe               Eu 6b            Eu 6c/RDE Phase 1                                    EU 7?
                                                                                                                                               g/km CO2

                                                                          North America        Tier 2                Tier 3 Phase In: NMOG + Nox, PM Tightening
                                                                          EPA
               Requires advanced NOx control
 Diesel                                                                   North America        LEV III Phase In: NMOG + Nox, PM
                (SCR, LNT, SCR-LNT)                                                                                                            LEV III Further Tightening
                                                                          CARB                             Tightening

                                                                          Japan                    JP09                                       JP18?

               Smaller engines but frequent “cold start” requires more
 Hybrid                                                                   South Korea       K-
                PGMs loadings                                                                                   K-ULEV 70                             K-SULEV?
                                                                          (Gasoline)        ULEV

                                                                          South Korea
                                                                                                        Eu 6b                                    Eu 6c
                                                                          (Diesel)
  Direct       Cooler exhaust gas, higher HC and soot requires more
injection       PGMs in catalyst                                          China (Beijing)    BJ5 (EU 5)            BJ6                           BJ6 Phase 2

                                                                          China
                                                                                              China 4 (EU 4)         China 5 (EU 5)                      China 6
                                                                          (Nationwide)
Gasoline
 Lean          Requires LNT = more PGMs
 burn                                                                     India                         BS4 (EU 4)                                BS6 (EU 6)

                                                                          Indonesia            EU 2                                     EU 4
               Current ~30 g Pt per vehicle
Fuel Cell
               Pd for hydrogen production and storage                    Thailand                 EU 4                               EU 5                           EU 6

            Source: Norilsk Nickel analysis ,Johnson Matthey
                                                                                                                                                                             75
PGM Demand Drivers In Automotive Industry – Rising
Vehicle Production

Total Number of Vehicles Forecasted to Increase:
Gasoline Remains the Main Driver                                              Global Light Vehicle Sales Expected to Grow in 2016
Mln Units                                                                     Mln Units

120
                                                                                                                                                                       +3%

100

 80

 60

                                                                                                                                                                       91
 40

                                                                                 89

 20

  0                                                                               2015

                                                                                                                                       Japan/Korea /
                                                                                          China

                                                                                                                  Europe
                                                                                                  North America

                                                                                                                                                       South America

                                                                                                                                                                       2016E
                                                                                                                           ME+Africa
      2012 2013 2014 2015 2016 2017 2018 2019 2020 2021 2022 2023

                                                                                                                                        South Asia
               Total Diesel         Total Gasoline            Electric cars

             Source: Norilsk Nickel analysis, IHS estimates
                                                                                                                                                                               76
Copper Market: China Driven Demand and Low Global
Inventories

China Remains the Main Driver for                                                   LME Copper Price Near Multi Year Lows while
Cu Consumption Growth                                                               Inventories Run Tight
Mt                                                                                  Mt                                                                US$/t

                                                                                    1 000                                                             8 000
                                                                            +4%

                                                                     +3%             900
                                                                            23,3                                                                      7 000

                                                                                     800
                                                                     22,9
                                                                                                                                                      6 000
                                        +2%                                          700

                                                                                                                                                      5 000
                                                                                     600
                                       22,3
            +1%
                                                                                     500                                                              4 000

            21,8                                                                     400
                                                                                                                                                      3 000
     21,6
                                                                                     300
                                                                                                                                                      2 000
                                                                                     200

                                                                                                                                                      1 000
                                                                                     100

                                                                                         0                                                             0
 2014       2015   China     Other    2016E     China     Other    2017E    2018E        Apr-13   Oct-13   Apr-14   Oct-14   Apr-15   Oct-15      Apr-16

                                                                     ХХ%    YoY                     LME       COMEX          SHFE      Cu price

               Source: Company data, Macquaire Research, Wood Mackenzie.
                                                                                                                                                           77
Copper Market Remains Balanced, Supply Disruptions -
Limited

Copper Supply Disruptions: Unfold in 2015 at 5% in
Line with Historical Average                                                          Copper Supply/Demand Balance
Kt                                                                                    Kt

1 400                                                                           10%
                                                                                                      560

1 200            8%
                                                                                8%

1 000

                                             5%             6%                  6%                                  190
     800                                                                                                     170
           6%           6%            6%

                               5%                                  5%      5%                   10
     600
                                                                                4%

     400                                             4%

                                                                                2%
     200

                                                                                       (330)
      0                                                                         0%
           2007 2008 2009 2010 2011 2012 2013 2014 2015 2016E                          2010    2011   2012   2013   2014   2015   2016E   2017E   2018E

                  Disruption        Relative to original production target

                Source: Company data, Macquaire Research, Wood Mackenzie
                                                                                                                                                      78
Metal Markets Outlook

                                                                        Loss making
                                Inventory                                                                Forecasted market             Medium-term
Metal                                                                    production
                          (days of consumption)                                                               balance                  fundamentals
                                                                      (% of cost curve)
                                                                                                   Kt
                                                                                                                  Deficit
                                             ?                                     30%

Nickel                                       80                            70%                             (70)
                                                                                                                            (70-100)
                                Exchange          Off-exchange                                              2016E           2017E
                                                                      Profitable   Loss-making
                                                                                                   Koz            Deficit

Palladium                                    87
                                                                                                          (550)
                                                                                                                             (700)
                                                                                   46%
                                             ETF                                                             2016E          2017E
                                                                           54%
                                                                                                   Koz
                                                                                                                  Deficit
                                                                                               1
                                            120                       Profitable   Loss-making
Platinum                                                                                                  (150)
                                                                                                                             (130)

                                             ETF
                                                                                                             2016E           2017E

                                                                                                   Kt             Balanced
                                                                                                           160

                                             9                                           10%                                   50
Copper                                                                     90%

                                    Exchange inventory                                                      2016E           2017E
                                                                      Profitable   Loss-making

           Source: Company data; Note: 1. South Africa and Zimbabwe
                                                                                                                                                      79
Financial Strategy and Results

          Sergey MALYSHEV
           Senior Vice-President
           Chief Financial Officer
Financial Policy Framework…

                      Financial Policy Goals                                                 Recent Achievements
1
                                                                                             ▪   Industry leading US$ unit cost
                       ▪   Maintain industry leading profitability by containing operating
                                                                                                 improvement in 2012–2015
      Profitability        costs while benefiting from rouble devaluation
                                                                                             ▪   Industry leading EBITDA margin

2
                                                                                             ▪   Debt maturity extended
                       ▪   Maintaining investment grade credit ratings                       ▪   Funding sources diversified (Chinese
 Prudent Balance       ▪   Balanced debt structure in terms of currencies, maturities,           credit line, Sberbank project
Sheet Management           and financing sources                                                 financing etc.)
                       ▪   Defensive liquidity management                                    ▪   Above-average liquidity and
                                                                                                 comfortable leverage ratios

3
    Working Capital    ▪   Following significant improvement in previous years,
                                                                                             ▪   Working capital stable despite one-
                                                                                                 off increases; some release
     Management            maintain achieved levels of net working capital
                                                                                                 expected in 2016

4
       Financial                                                                             ▪   2015 audited results published in
                       ▪   Gradually speed up publication of IFRS financials                     mid-March (vs late March in
      Disclosure                                                                                 previous years)

                                                                                                                                       81
… Resulting in Global Leadership on Margins and Balance
Sheet Strength

EBITDA margin, 2011–2015                                                                       Net debt/EBITDA, 2011–2015

                                                                             50%                         Peer group range

                                                                                                         Norilsk

          Peer group range                                                                                                              1,0x
          Norilsk

   2011          2012              2013              2014              2015                      2011      2012        2013   2014   2015

   Company’s leading cost position and conservative financial policy allow Norilsk to maintain strong
    standing through the commodity cycle

            Source: Bloomberg, Company data.
            Peer group includes BHP Billiton, Rio Tinto, Glencore, Vale, and Anglo American.
                                                                                                                                               82
Unit Costs Under Control Despite Some Headwinds

                                                                                                                             Profitability

Unit costs in US$, 2012 = 100%

      Norilsk                             Peer 1                                    Peer 2                       Peer 3                       Peer 4
       -39%                                 -39%                                    -33%                          -20%                         -17%

2012 2013 2014 2015             2012 2013 2014 2015                      2012     2013     2014     2015   2012 2013 2014 2015    2012       2013   2014   2015

  Despite some of the negative underlying trends (ore degradation, depletion of low-cost secondary
   feedstock, catch-up inflation of consumables and salaries etc.) the company managed to
   outperform peers
  Tight cost controls were greatly helped by the US$ appreciation starting from 2H14

            Peer group includes Rio Tinto, Glencore (industrial assets only), Vale, and Anglo American.

                                                                                                                                                                  83
EBITDA and FCF Strongly Supported by FX

                                                                                                                   Profitability

     At the year-end US$/RUB rate of 72.9, 1% change in exchange rate translates into EBITDA change of US$ 22.0m, FCF change of
      US$ 36.3m

           US$m
     60                                                              exchange
                                                                     rate as at
                                                                     31.12.15
     50    44.1
                                  40.7
     40                                                          36.3
                                                                                            33.1
                                                                                                                                29.4
     30    26.7
                                  24.7                                                                                               Free cash
                                                                 22.0
                                                                                            20.0
                                                                                                                                17.8 flow
     20
                                                                                                                                       EBITDA
     10
           60.0                    65.0                          72.9                       80.0                                90.0

Share of Foreign Currency in Company CapEx                                        Share of Foreign Currency in Company OPEX
    Non-                                                                           Non-                                  Non-
                                           Non-
    RUB                                    RUB
                                                                                   RUB                   7%              RUB
           11%                                                                            22%                                   24%
                                                  24%                                                                           13%
                                                                                                         5%

             2014                                       2015                                    2014         7%                        2015

                                                               76%                                     78%         31%                        76%
                  89%
                          RUB                                        RUB                                     RUB                                    RUB

                   Source: Company data.

                                                                                                                                                      84
You can also read