2019 Corporate Presentation - ARAUCO
←
→
Page content transcription
If your browser does not render page correctly, please read the page content below
2019 Corporate Presentation
Overview
ARAUCO at a glance

                                                      Angelini                                       Empresas
                       Shareholder Structure                                  AntarChile
                                                       Group         74.30%                 60.82%    Copec          99.98%

                                                                     International Scale                                        National Scale

                                                            Fitch Ratings              BBB
                                                                                      (Negative)
                                                                                                                              Fitch Ratings       AA-
                                                                                                                                                 (Negative)

                              Credit Ratings                       S&P                BBB-
                                                                                      (Negative)
                                                                                                                               Feller Rate        AA
                                                                 Moody’s              Baa3                                                        (Stable)

                                                                                       (Stable)

                                                            EBITDA            1,147        Net Debt/EBITDA    3.9x

                  Financial highlights 2019                 EBITDA Margin      22%         Net Debt/Equity    82%
                                      In US$million
                                                            Debt              6,050        Net Income          62

                                                            Cash              1,560        CAPEX             1,350
 As of December 2019
DIVERSIFIED SALES                                                               REVENUE BY REGION
 AROUND THE WORLD

                                                      Forestry   Others
                                                        3%        3%

  Revenues
  MUS$5,329                                          Pulp                 Wood
                                                                          51%            32%                    32%
                                                     43%                            Asia and Oceania     North America

                                                                 Others
                                                      Forestry    -5%
                                                        22%
Adjusted EBITDA
                                                                                         24%                     8%
   MUS$1,147                                          Wood                Pulp         Central and              Europe
                                                     products             58%         South America
                                                       25%
                                                                                                        4%
   As of December 2019 LTM                                                                             Others
   (1) Pulp and Wood products include energy sales
                                                                                                                         4
THREE STRATEGIC BUSINESS SEGMENTS
                                                 Forestry                Pulp                               Wood products                                      Complementary energy
                                                                                                       Panels                      Solid Wood                      operations
                                                                                                         2 Mills
                                                                                                                             7 Sawmills: 2,646 th. m3            10 Power Plants
                                                697 th. Ha (1)          5 Mills                  MDF:      515 th. m3        Plywood(5) : 710 th. M3                     606 MW
                                                                                                 PB:       340 th. m3        4 Rem. Facilities
                                                                      2,905 th. t                                                                               Surplus: 219 MW

                                                                                                         2 Mills                                                 2 Power Plants
                                                                         1 Mill                                              1 Sawmill: 318 th. m3
                                                                                                 MDF:      300 th. m3                                                     82 MW
                                                133 th. Ha   (1)
                                                                        350 th. t                                            1 Rem. Facility
                                                                                                 PB:       260 th. m3                                            Surplus: 8 MW

                                                                                                          4 Mills
                                                130 th. Ha (1)                                   MDF: 1,530 th. m3
                                                                                                 PB:    720 th. m3

                                                                                                                                                                 1 Power Plant
                                                                        1 Mill                                                                                           91 MW (2)
                                                 79 th. Ha (1) (2)
                                                                      710 th. t (2)                                                                             Surplus: 50 MW

                                                                                                        10 Mills
                                                                                                  MDF: 1,470 th. m3
                                                                                                  PB: 2,104 th. m3

                                                                                                         2 Mills
                                                                                                  MDF: 250 th. m3
                                                                                                  PB:  339 th. m3

                                                                                                    10 Mills (3)(4)
                                                                                                   PB: 1,165 th. m3           1 Sawmill (3): 25 th. m3
                                                                                                   MDF: 741 th. m3
                                                                                                   OSB: 258 th. m3
                                Total          1.0 million ha        4.0 million t              10.1 million m3                 3.7 million m3                    779 MW

As of December 2019                                                    (4) One PB mill in South Africa is currently shut down
(1) Considers hectares planted, in thousands                           (5)Considers 2 plywood mills.
(2) Considers 50% of Montes del Plata                                  (6)As of the date of publication of this report, 2 MDF mills are shut down. Also, the
(3) Considers 50% of Sonae Arauco                                        PB lines of two different mills are also shut down.
                                                                                                                                                                                      5
WE ARE A MAIN PLAYER IN
                                                                                                               Market Pulp Capacity (thousand tonnes)
THE GLOBAL MARKET
                                                                                  Suzano
                                                                             ARAUCO (*)                                                 5,225
                                                                            IP (exc. Ilim)
                                                                                    CMPC

                #2
                                     In market
                                                                                    APRIL
                                     pulp capacity
                                                                           Metsa Group
                                     in the world
                                                                        UPM-Kymmene
                                                                         Georgia Pacific                                                                MAPA’s new capacity
                                                                              Stora Enso
                                                                           APP (excl. PE)

                                                                                             0                2,000       4,000         6,000       8,000        10,000

                                                                                                                World Panels** Capacity (thousand m3)
                                                                            Kronospan
                                                                          ARAUCO (*)                                            9,916

                #2
                                     In Panels                                    Egger
                                     capacity in                              Norbord
                                     the world                            Swiss Krono
                                                                           Kastamonu
                                                                       Georgia Pacific
                                                                      Louisiana Pacific
                                                                             Pfleiderer
                                                                               Duratex

                                                                                             0      3,000       6,000   9,000     12,000 15,000 18,000 21,000 24,000
 World market pulp and panel competitors capacity as of December 2019
 *Arauco capacity includes 50% of Montes del Plata, 50% Sonae Arauco, and MAPA Project, as of December 2019
 **Panels refers to Composite Panels, which corresponds to MDF, PB and OSB.
 Source: Hawkins Wright, Public fillings, Arauco estimations and Company information and fillings
                                                                                                                                                                              6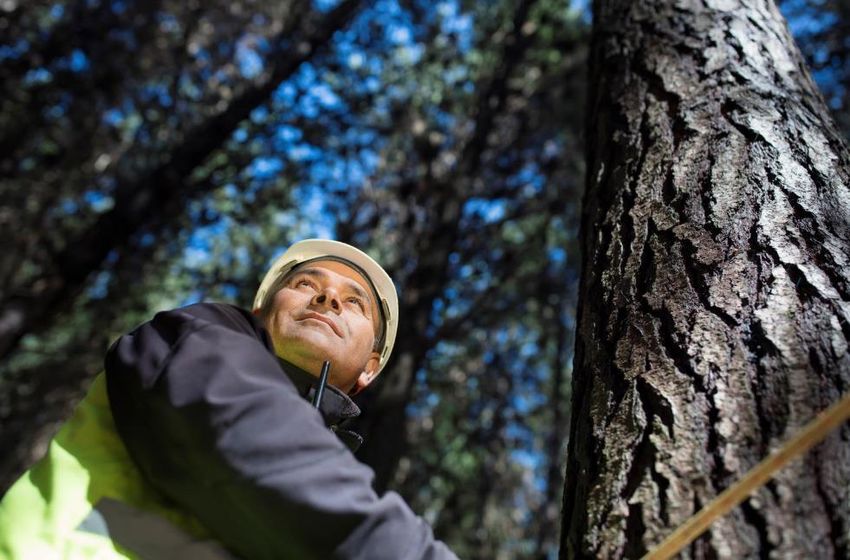
MAXIMIZING THE
VALUE OF EVERY TREE
                                             PULP
                                                    EKP
                                                    BSKP
                                                    UKP
                                                    Fluff
                                                    DissolvingPulp

                              PULP
                              MILLS
                                                                                  SURPLUS
                      Chips                                                       277 MW

                                             HEAT                        ENERGY             National Grid
                                          PRODUCTION                     &STEAM

                                                    MDF/ PB
                                                    Plywood
                               WOOD                 SawnTimber
                              PRODUCTS              Rem. Wood Products
                                MILLS
                                         WOOD
                                         PRODUCTS

                                                                                                            7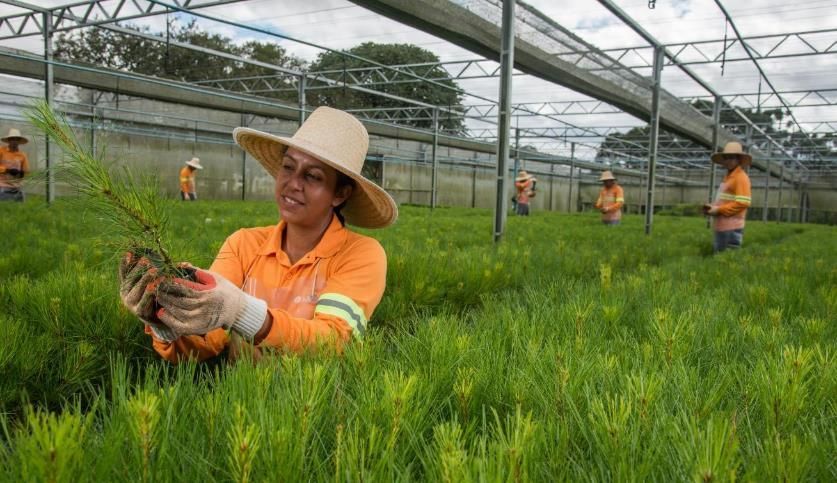
BUSINESS
SEGMENTS
FORESTRY BUSINESS
    Total Plantations                                            Includes plantations in Chile, Argentina, Brazil and Uruguay
                                                                                                                                 Planting and harvesting
  In thousand hectares                                                                                                          In thousand hectares
                                                                                                                    1,038              90

                                                                                                                                      80                                                                                             71 ha
                                                                                                                                      70

                                                                                                                                      60                                                                                             55 ha
                                                                                                                                      50

                                                                                                                                      40
                                                                                                                                           37 ha

                                                                                                                                      30   23 ha                                                                  Planted hectares
                                                                                                                                      20                                                                          Harvested hectares
                                                                                                                                      10
      2003         2005         2007         2009         2011      2013            2015            2017            2019                   2002 2003 2004 2005 2006 2007 2008 2009 2010 2011 2012 2013 2014 2015 2016 2017 2018 2019

                     1.8 million (*)                                                          Hectares Planted                                                           Environmental Certifications
                              hectares owned                                                                                           Pine : 70 th.                     Our forests plantations have international
                                                                                                                                       Euca: 60 th.                      certification in Forestry Management and Chain
                                                                                                                                       Others: 0.2 th.                   of Custody
                           1.0 million                                                                                                             130 th.
                                                                                                                                                                         For detailed information about each certification, you can visit our
                             hectares planted                                                                                         Euca: 78 th.                       web site www.arauco.com
                                                                                                                                      Pine: 0.1 th.
                                                                                                      Pine : 503 th.                  Others: 0.4 th.
                           667 th. of Pine                                                            Euca: 192 th.                                79 th.
                                                                                                      Others:  2 th.            Pine : 94 th.
                          349 th. of Euca                                                                                       Euca: 19 th.
                           22 th. Others                                                                              697 th.
                                                                                                                                Others: 20 th.
                                                                                                                                       133 th.
(*) includes 515 th. hectares of native forest plantations.
As of December 2019
                                                                                                                                                                                                                                             9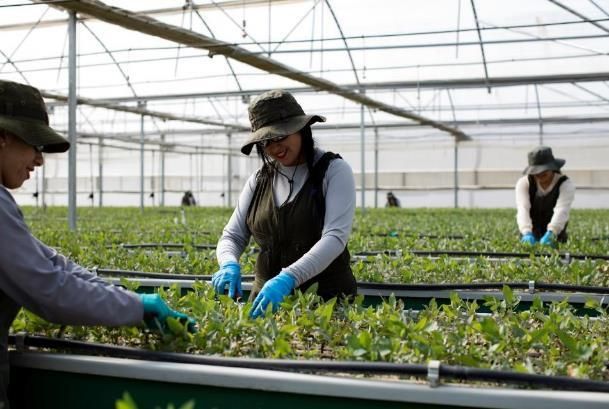
FORESTRY BUSINESS

Bioforest research and development

Bioforest was formed in 1990 by Arauco and one of the
achievements has been the increase in the plantation
yields by 40%

 59
                Highly
                trained
                researchers                             ● Bioforest has a wide participation in local and international
                                                          organizations that are leaders in the forestry-industrial
 work in order to develop and                             scientific knowledge
 apply the best technologies,                           ● In addition, Bioforest aims to fulfill the environmental
 maximizing the forestry and                              objectives for the protection and conservation of
 industrial resources.                                    biodiversity present in our native forests

                                                        ● During October 2019 and after 3 years of work, Bioforest
                                                          discovered a species of fungus that is affecting more than
                                                          80% of the chilean Araucaria. This fungus has already killed
                                                          10% of that protected native tree species.

                                                                                                                          10
PULP BUSINESS Production
million tonnes
4 3.6 3.7 3.8 3.7
3.3 3.4
3
Pulp Sales
2
1
MUS 0
2014 2015 2016 2017 2018 2019
$2,296
EKP BSKP UKP Fluff
Sales volume: 3.7 million tonnes
Fluff
Does not include energy sales UKP Europe
4% 17%
As of December 2019 LTM 13%
EKP(1) BSKP (2) UKP(3) FLUFF DP (4) America
11%
EKP China
48% 54%
Rest of the
World
BSKP 12% Korea
35% 6%
(1) Eucalyptus Kraft Pulp
(2) Bleached Softwood Kraft Pulp
(3) Unbleached Kraft Pulp
(4) Dissolving Pulp
As of December 2019 LTM
11PULP BUSINESS
OUR MILLS
in thousand tonnes
LICANCEL
160 UKP
CONSTITUCION ALTO PARANA
355 UKP 350 BSKP & Fluff
Swing mill
MAPA PROJECT (2021)
NEW LINE 3
1,560 EKP ARAUCO MILL
LINE 1: 290 EKP
Line 1 will be shut down LINE 2: 510 BSKP
upon completion.
NUEVA ALDEA MONTES DEL PLATA
520 EKP 1,414 EKP
520 BSKP Arauco owns 50%
VALDIVIA
550 EKP
As of December 2019
12PULP BUSINESS
COMPETITIVE ADVANTAGES
1. Logistic Efficiency 2. Cost Advantages
620
East Canada
Coastal BC
Int. West Canada
570 Japan
Japan
US Finland
Other Europe US
520 Sweden
China
Cash Cost, CIF China
Bel/France
470 East Europe
Iberia
US$/ADt
Indonesia Canada
Finland
420 Sweden
Average distances from Average distances from Other Asia
East Europe
Forests to Mills Mills to Ports 370
Km Chile
320 Other World Chile/Uruguay
Chile 85 Licancel 420
Brazil
Constitucion 316 270
Argentina 80
Nueva Aldea 63
220
Uruguay 282
Arauco 35 0 5,000 10,000 15,000 20,000 25,000 30,000 35,000 40,000
Annual capacity (000s ADt)
Valdivia 301
Arauco
Alto Paraná 1,200
BSKP BHKP
Montes del plata 0
Weighted Avg. 205 (1) 161(2) Source: Hawkins Wright, as of December 2019
Other world includes Argentina, China and Oceania.
with MAPA
Source: ARAUCO, as of December 2019
(1) Calculated using sales volume for 2019
(2) Calculated including sales volume from ARAUCO´s Line 3 expected capacity and assuming Line 1’s shutdown
13PULP BUSINESS
COMPETITIVE ADVANTAGES
3. Product Diversification
BCP world industry demand by End-use, 2018(2)
(48%) FLUFF
SOFTWOOD 9%
UKP
13%
Current Capacity
(52%)
4.0 million HARDWOOD
tonnes
EKP
BSKP 52%
26% DP
4%
FLUFF
UKP
7% (60%)
10% HARDWOOD
(40%) Projected
SOFTWOOD Capacity
5.2 million EKP
Including MAPA’s tonnes 59%
BSKP
capacity and DP (1) 20%
Source: ARAUCO, as of December 2019 (2) Source: Hawkins Wright, as of December 2019
(1)Dissolving Pulp BCP: Bleached Chemical Pulp, which includes all bleached kraft pulp (and not unbleached)
and sulphite pulp
14WOOD PRODUCTS BUSINESS Sales evolution
US$ billion
3 2.8 2.6 2.6 2.7 2.7
2.5
2
Revenues 1
MUS
0
2014 2015 2016 2017 2018 2019
Panels Solid wood
$2,742 Does not include energy sales
Subdivisions
As of December 2019 LTM
PANELS
SOLID WOOD
15WOOD PRODUCTS BUSINESS: PANELS Production
million m3
7
Millares
6.0
6 5.6
4.8 4.8 4.8 4.9
5
4
Panels Sales 3
2
1
MUS 0
2014 2015 2016
MDF PB
2017
Others
2018 2019
$1,859 Does not include energy sales
Sales volume: 5.9 million m3
Others*
3%
Chile 4%
Argentina
Others**
4%
As of December 2019 LTM
6%
Mexico
10%
MDF
PBO 53%
44%
USA and
Brazil Canada
25% 51%
As of December 2019 LTM
Does not include Sonae Arauco volumes
*OSB, HB, Retail and Composite panels
** EMEA, Asia, Oceania and Rest of Latam
16PANELS
OUR MILLS 2 mills
470 m3 MDF 4 mills *
in thousands 974 m3 PB
886 m3 MDF
516 m3 OSB
2 mills*
140 m3 MDF
428 m3 PB
2 mills*
372 MDF
456 PB
8 mills (**)
1,000 m3 MDF
2,104 m3 PB
2 mills
339 m3 PB
250 m3 MDF
4 mills
1,530 m3 MDF
720 m3 PB 2 mills*
472 m3 PB***
84 m3 MDF
3 mills
515 m3 MDF
340 m3 PB
Legend 2 mills
MDF: Medium Density Fiberboard 300 m3 MDF
PB: Particle Board 260 m3 PB
OSB: Oriented Strand Board
As of December 2019
*Arauco owns 50% of Sonae Arauco
**As of the date of publication of this report, 2 MDF mills are shut down. Also, the PB lines of two
different mills are also shut down.
***One PB mill in South Africa is currently shut down 17WOOD PRODUCTS BUSINESS: SOLID WOOD Production
million m3
5
4
3.2 3.2 3.1 3.2 3.1
2.9
3
2
Solid Wood Sales 1
0
MUS 2014
Sawn Timber
2015 2016
Kiln dried lumber
2017
Plywood
2018 2019
Reman. Wood products
$883Does not include energy sales
As of December 2019 LTM
Sales volume: 2.7 million m3
Rem. Wood
products
Others*
2%
Rest of Latam
Chile
8% Asia and
Oceania
16% Kiln-dried 12%
36%
lumber
34%
EMEA
Plywood 13%
18%
North America
Sawn Timber 31%
30%
As of December 2019 LTM
Does not include Sonae Arauco volumes
* Pallets
18SOLID WOOD
OUR MILLS
in thousands
1 sawmill*
50 th. m3 ST
7 Sawmills
2,646 m3 ST
408 m3 Rem
Legend
2 Plywood Mills 1 sawmill
ST: Sawn Timber 318 m3 ST
710 m3
Rem: Remanufactured Wood Products
45 m3 Rem
As of December 2019
*Arauco owns 50% of Sonae Arauco
19ENERGY BUSINESS Highlights As of September 2018
Arauco generates renewable energy from forestry biomass and uses it in
the production processes.
In Chile, Argentina and Uruguay, we are self-sufficient in net electricity
consumption and we sell the surplus to the local grid.
Revenues 5 cogeneration plants in Chile and 1 plant in Uruguay are registered under
the Kyoto Protocol Clean Development Mechanism (CDM).
ARAUCO expects MAPA will generate an additional surplus of 142MW
MUS available for the national grid.
$74 277 MW
As of December 2019 LTM
779MW Sold to National Grid in Chile,
Installed capacity Argentina and Uruguay
606 MW
82 MW 900,000 homes
can be powered by the surplus
injected to the grid
91 MW
20FINANCIAL HIGHLIGHTS
MAIN FIGURES
Adjusted EBITDA Net Debt
2,000
US$ million 35%
31% US$ million
1,800 3.9x
30% 5,000
26% 3.8x 3.6x
1,600 25% 4,500 3.2x 2.9x
24% 25% 2.7x
1,400
22% 22% 22% 4,000 1.9x
3,500
1,200 20%
3,000
1,000 1,851 15% 2,500
4,359 4,490
2,000 4,107 3,805 3,889
800 3,684 3,434
1,280 1,290 1,353 1,500
10%
1,153 1,067 1,147
600 1,000
5% 500
400
-
200 0% 2013 2014 2015 2016 2017 2018 2019
2013 2014 2015 2016 2017 2018 2019
Net Debt Net Debt/ EBITDA
Adjusted EBITDA Adjusted EBITDA Mg
CAPEX Debt Breakdown
US$ million
by Instrument by Currency
Leasing Other
Currencies
Bank 4%
4%
Loans
1,350 16%
865 921
614 665 654
469
2013 2014 2015 2016 2017 2018 2019
Bonds USD (1)
80% 96%
As of December 2019
(1) 23% of the total debt corresponds to local currency swapped to US dollar
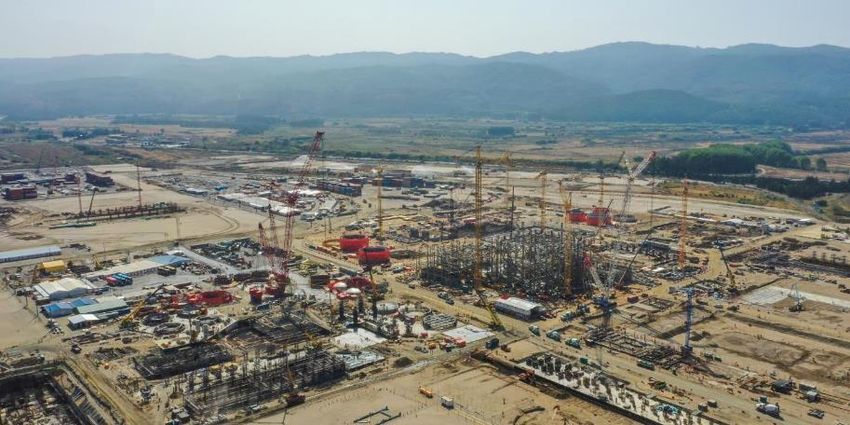
22FUTURE INVESTMENTS
MAPA NEW PULP LINE AT                                                           Modernization and Expansion of the Arauco Mill (MAPA)
ARAUCO MILL & COGENERATION                                                      consists in the construction of a third pulp line of 1.56
PLANT                                                                           million tonnes (short fiber), increasing ARAUCO’s total
                                                                                pulp capacity to more than 5 million tonnes.

 The investment for this project is   Additionally, the Project considers the       The Project is expected to    It is expected that the new line will
 approximately US$ 2,350million.      shut down of Arauco´s line 1 of 290 th.       generate 8,000 jobs as of     start its operations during the
                                      tonnes of short fiber pulp once the new       August 2020.                  second quarter of 2021.
                                      line (line 3) is operating, and the
                                      construction of a 132 MW cogeneration
                                      plant.

                                                                                                                                                          24
MAPA PROJECT TIMELINE
July 2018 February 2019 May 2019 March 2020: 45% advance
The Board ofDirectors Contracts awarded for Most of the critical equipment is arriving on-site
approved the MAPA Earth-moving worksstart. construction companies, totaling and building constructions are in progress.
Project. approximately US$ 680 million.
April 2011 October 2018 April 2019 2021
Arauco’s first Arauco signed main equipment On April 1st, 2019, Arauco signed an The new Line 3 is
environmental studies contracts with Andritz and ECA* agreement for a total of Eur 555 expected to start
for MAPA Project. Valmet million. This financing is mainly operating on 2021,
associated with the suppliers while Line 1 is
contracts signed on October 2018. shutdown.
(*) Export Credit Agency
25DISSOLVING PULP PROJECT
• Dissolving Pulp Project is a brownfield project, located in the Valdivia mill and approved by
ARAUCO’s Board of Directors on September 2017. This US$ 200 million investment consists
in the mill’s adaptation to produce dissolving pulp, with the option to switch back to paper
pulp production
• This project allows Arauco to continue diversifying its product portfolio and reaching new
costumers
As of this report, construction of the
Dissolving pulp is used to produce viscose,
dissolving Pulp Project is finished. It is
an alternative material for cotton.
expected to start operating during the
It is used to soften, shine, and purify fibers.
second quarter of 2020.
26SUSTAINABILITY
SUSTAINABILITY STRATEGY

Combining science,       Developing high standard,   Responsibly managing       Being a virtuous actor in
innovation and           quality-oriented products   our operations using       the areas where we
technology               that always aim to be the   best-in-class              maintain operations to
with the goal of         superior choice for our     environmental practices    become an active agent
unlocking the full       customers.                  and promoting the safety   for their social and
potential of our                                     of ARAUCO’s workers.       economic development.
plantations.

                                                           With products that come from responsible
                                                           management of natural and renewable
                     Towards a Bioeconomy                  resources
SUSTAINABILITY STRATEGY
Global Change
Our commitment to sustainable development is a
CARBON
response to the challenges posed by climate change
and population growth. NEUTRAL
COMMITMENT RENEWABLE RESOURCE
2020
Capture more Solutions to fulfill the
greenhouse gas
emissions than it
+ world´s demand, while
keeping our planet in
ARAUCO anticipates it will
be the first company in
emits globally balance
our industry to certify
achieving this important
goal
ARAUCO also announced its intention to align with the
“Science Based Targets”
29SUSTAINABILITY STRATEGY Around We maintain and protect,
Engagement with US$56 63 128
220
million Areas of High Biological
Conservation Value
Areas of High Social,
Cultural or Religious
Invested during 2019 Conservation Value
in environmental projects
communes
over In alignment with the UN
more than
70,000
programs with direct beneficiaries
communities
Source: ARAUCO Sustainability Report
30FOR FURTHER INFORMATION, PLEASE CONTACT: Marcelo Bennett, Treasurer marcelo.bennett@arauco.com Phone: (562) 2461 7309 Gonzalo Jofré, Investor Relations gonzalo.jofre@arauco.com Phone: (562) 2461 7494 investor_relations@arauco.com For further information, please visit www.arauco.com
You can also read