2019 Global Journalism Report - ROKK Solutions
←
→
Page content transcription
If your browser does not render page correctly, please read the page content below

2019 Global
Journalism Report
Data Show Worldwide Decrease in Professional Journalists;
Shift Towards Independent Authors
Data Shows 16% Worldwide Increase in Number of Content
 TOP 100Continued
Publishers, AUTHOR    PLATFORMS
                    Trend Towards MediaLIST  RELEASED
                                         Fragmentation
TOP 50 EDITORIAL TOPICS LIST RELEASED
The State of Journalism
The world of journalism has never been as dynamic as it is today. Thanks
to the digital media revolution and the emergence of self-publishing
platforms it has become easier than ever for individuals to create and
distribute editorial content of all forms. This has led to a proliferation of
independent, digital-first authors who are either affiliated with a variety of
media outlets, or solely publishing from their own personal brands. The
result: the lines have blurred between news and entertainment, and the
practice of journalistic expression has become democratized.

There are obvious benefits to consumers in having access to real-time
information from a broad set of perspectives. Digital media has given
us an alternative to the bias of publishing monopolies, not the least of
which is corporate and political influence. But democracy comes at a
cost, and this “democratization” of the media is no exception. We all
want more choice. The challenge is when the choices
are endless, and when journalist credibility is no
longer a simple function of the reputation of the
publication to which they contribute.

It may be the case that, due to a legacy of high
editorial standards and extremely competitive
newsrooms, journalists from established media
outlets like The New York Times and the Wall Street
Journal can be trusted for quality, accurate reporting.
However, truthful, informative, and entertaining content is
not limited to the media elite, and some may argue that
the editorial fringes provide comparable valuable.

To fully understand the transformation which
the world of journalism is undergoing,
Onclusive analyzed 2.1 billion pieces of
editorial content between Quarter 1 2018
and Quarter 1 2019. The numbers tell a
story of an author ecosystem which is
fragmenting across publication tiers,
editorial topics, and content formats.

The Numbers
      Between Q1 2018 and Q1 2019 there was a decrease
     in the percentage of authors who contributed for Tier 1
    publications, and an increase in the percentage of authors
    who contributed for Tier 3 publications. In Q1 2019, 15% of
   authors contributed to Tier 1 publications, down from 26% in
   Q1 2018. Conversely, in Q1 2019, 41% of authors contributed
          to Tier 3 publications, up from 25% in Q1 2018.

             Percentage of Authors
              by Publication Tier
100%                                                      Tier 1 Publications

                                                          Tier 2 Publications

75%                                                       Tier 3 Publications

50%

25%

 0%

   This data represent a decline in the number of authors who
     would generally be considered “professional journalists”
       based on the association of Tier 1 publications with
     the largest, most established media outlets, and Tier 3
    publications representing the growing list of independent,
                  niche content sites and blogs.

                      2019 Global Journalism Report | 3
                                                             2018 GLOBAL MEDIA REPORT | 5
Inside the Newsroom
The traditional newsroom is changing in shape and form, and is declining
in overall size and scope. According to the Bureau of Labor Statistics
Occupational Employment Survey, newsroom employment in the U.S.
dropped 23% between 2008 and 2017, and paid positions as reporters and
news correspondents are projected to drop another 10% by 2026. And while
all positions may not be full-time and on-staff, certain media companies
continue to employ a fair number of journalists overall, including a number
of major metro newspaper properties. The Top 100 Author Platforms List ranks digital
publications by their volume of contributing authors.

Top 100 Author Platforms List
  1      Medium                           1,689,753   26   CNN                       4,113
  2      Yahoo                            28,032      27   The Wall Street Journal   4,092
  3      Huffington Post                  15,450      28   LA Times                  4,012
  4      MSN                              9,236       29   BBC                       3,985
  5      The Guardian                     9,023       30   Time                      3,926
  6      The New York Times               8,271       31   The Roanoke Times         3,851
  7      Washington Times                 7,132       32   Stuff                     3,822
  8      Washington Post                  6,799       33   Nature                    3,807
  9      Sydney Morning Herald            6,788       34   Telegraph                 3,792
 10      The Daily Mail                   6,744       35   Vice                      3,732
 11      USA Today                        6,559       36   Bloomberg                 3,607
 12      Business Insider                 6,395       37   The State                 3,589
 13      Chicago Tribune                  6,194       38   Mirror                    3,490
 14      The Star                         6,153       39   CNBC                      3,458
 15      Independent                      6,032       40   NPR                       3,271
 16      Seattle Times                    6,027       41   Stars and Stripes         3,208
 17      Miami Herald                     6,024       42   The Atlantic              3,149
 18      US News                          5,952       43   Houston Chronicle         3,125
 19      New Observer                     5,364       44   Denver Post               3,063
 20      St. Louis Post                   4,953       45   Boston Globe              3,023
 21      Forbes                           4,819       46   Reuters                   3,019
 22      The Globe and Mail               4,723       47   AOL                       2,967
 23      Charlotte Observer               4,573       48   AZ Central                2,874
 24      The Sacramento Bee               4,257       49   National Post             2,839
 25      Fox News                         4,255       50   Baltimore Sun             2,831

      2019 Global Journalism Report | 4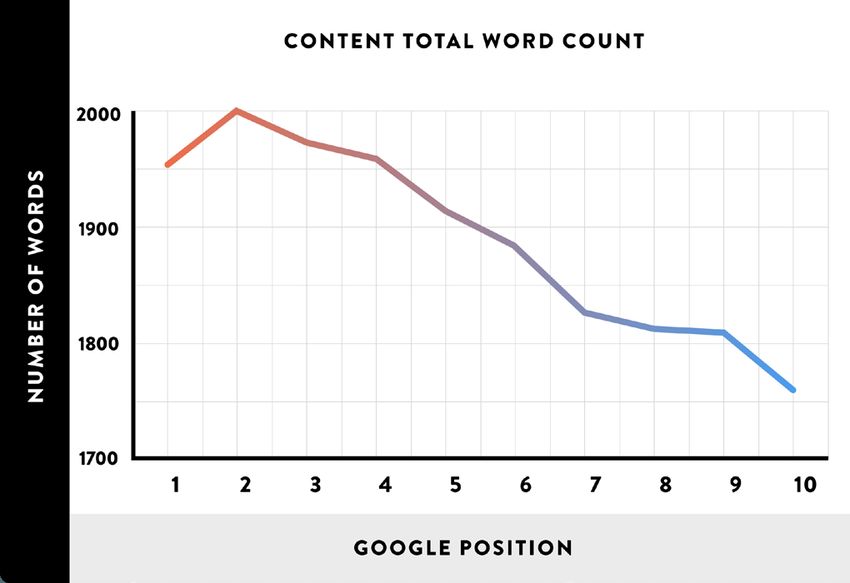
Top 100 Author Platforms List (cont.)
51      Milwakee Journal Sentinal        2,779   76   Philadelphia Inquirer       2,144
52      Times Union                      2,768   77   Billings Gazette            2,135
53      Salon                            2,729   78   The Times UK                2,088
54      Murcury News                     2,679   79   The Kansas City Star        2,069
55      Associated Press                 2,655   80   MarketWatch                 2,052
56      News.com.au                      2,574   81   AlterNet                    1,999
57      Orlando Sentinal                 2,531   82   Irish Times                 1,981
58      The Conversation                 2,514   83   New York Post               1,978
59      Slate                            2,482   84   The Sun                     1,964
60      Herald Online                    2,457   85   CBC                         1,954
61      NBC News                         2,435   86   San Antonio Express News 1,908
62      Modesto Bee                      2,423   87   Sun Sentinal                1,869
63      Missoulian                       2,410   88   Ledger Enquirer             1,857
64      Star Tribune                     2,398   89   Star Telegram               1,773
65      New York Daily News              2,388   90   Boston Herald               1,738
66      NZ Herald                        2,382   91   Christian Science Monitor   1,659
67      Pittsburgh Post Gazette          2,347   92   Bleacher Report             1,616
68      Buzzfeed                         2,330   93   Independent.ie              1,588
69      ABC News                         2,317   94   Newsday                     1,588
70      Lexington Herald                 2,305   95   The Daily Beast             1,552
71      Seeking Alpha                    2,298   96   Brisbane Times              1,551
72      Macon Telegraph                  2,237   97   The Hill                    1,535
73      Entrepreneur                     2,188   98   All Africa                  1,532
74      The Age                          2,184   99   Daily Record                1,523
75      Real Clear Politics              2,177   100 Columbus Dispatch            1,517

     2019 Global Journalism Report | 5
Topics of Interest
There is a vast spectrum of editorial topics about which today’s author is writing.
Topics like business, sports, politics and entertainment remain popular themes,
but articles about the environment, religion, and information technology are also
top subjects. The Top 50 Editorial Topics List ranks each major topic by its
volume of contributing authors.
Top 50 Editorial Topics List
1 Business / Professional 1,811,426 26 Automotive 55,413
2 National News 1,784,878 27 Industrials 55,073
3 Information Technology 1,767,171 28 Education 53,042
4 Consumer Products 1,255,406 29 Real Estate 46,186
5 Lifestyle 1,205,435 30 International News 41,984
6 Fashion 1,160,499 31 Recipes 34,330
Travel / Tourism / 32 Food & Beverage 33,527
7 1,148,880
Geographic
33 Literature 28,369
8 Sports 1,095,771
34 Law 24,987
9 Society 587,594
35 Transportation 22,965
10 Arts 582,623
36 Energy 21,813
11 Local News 573,709
37 Theater 21,114
12 Recreation 565,438
38 Gossip / Tabloid 19,012
13 Politics 564,910
39 Aerospace Defense 12,340
14 Finance / Banking 563,152
40 Agricultural Products 9,803
15 Health / Medical 558,966
41 Oil Gas 9,353
16 Media / Television 548,575
42 Hotels / Restaurants / Leisure 9,346
17 Music 536,034
43 Telecommunication Services 9,313
18 Environment 532,536
44 Marketing / Advertising 9,164
19 Science 531,226
45 Retailing 8,824
20 Film 524,137
46 Insurance 8,780
21 Organisations 515,680
47 Electronics 8,530
22 Games 514,296
Construction
23 Religion 512,332 48 8,110
Engineering
24 Government 508,210 49 Human Resources 6,779
25 Health Care 56,885 50 Biotechnology 5,618
2019 Global Journalism Report | 6Increased Editorial Volume
While we are witnessing a wider distribution of authors across publication types
and editorial topics, we are also seeing an increase in the overall number of articles
published per author. In our previously published Global Media Report we cite a 78%
overall increase in the average number of articles per author. This may reflect the
increasing demands of journalists as media companies downsize their staff writers
who are now covering multiple beats and are required to deliver higher output. This
also illustrates how the greater ease of publishing across newer digital channels is
resulting in more content being generated overall.
But with these increased pressures on journalists, content is becoming more and
more “snackable”. When analyzing the overall length of articles we saw the number
of characters per article drop by 18%, from an average 2,324 characters per article to
1,967 per article. So, while authors are producing more articles, on average they are
shorter pieces.
The length of an article matters. One of the key performance indicators of digital
content is how well it ranks in search engines like Google, since a large portion of
publisher web traffic comes through these portals. And while few people know exactly
how Google’s search algorithms are tuned (and since the tuning changes frequently)
the best we can do is look at testing data. A recent study from Backlink.io shows a
direct correlation between the length of the article and its appearance on the first page
of Google’s search results—the ultimate destination for any piece of content.
Generally, the longer the article, the higher the Google rank. Specifically, the average
word count of a Google first page result is 1,890 words, so while the 18% decrease in
article length which we’ve observed may not yet be having an impact, a continued trend
in this direction may yield negative consequences. Journalists take note.
2019 Global Journalism Report | 7The Power of Influence
Google is not the only factor in the impact of editorial content. Today, authors build
their own independent brands, separate from the publications to which they contribute.
They organically develop their own loyal audiences, many of which even rival Tier 1
media outlets in scale. Key indicators to influence include the total volume of content
an author produces, their number of social media followers, and the total amount of
social media engagement an author earns.
When analyzing the distribution of influence across the author ecosystem, it appears
that a relatively low percentage of authors, less than 2%, commands the highest
level of influence. The majority of influence is largely spread out across a bell-curve
distribution indicating that this new form of currency is actually accessible to a broad
set of writers. Today, an author only needs an influence score of 70% or higher to be in
the top 2% of influencers.
Author Influence Distribution
20%
15%
Percentage of Authors
10%
5%
0%
20 40 60 80
Influence Score
2019 Global Journalism Report | 8Sentiment Still Matters
While influence is an important characteristic
when understanding the author ecosystem,
Author Sentiment
another critical factor is the general sentiment of 60% Positive
the author. What is their tone in social media, are
they largely positive, do they typically take a more Neutral
negative tone, or does most of their commentary
Negative
take a generally neutral position? In the PR world, 40%
knowing both the level of influence as well as
the general tone and sentiment of a journalist is
important.
The charts here and on the following pages show
20%
the distribution of sentiment across a sample of
authors in the ecosystem. The first chart to the
right aggregates all authors into three general
0%
categories; positive, neutral, negative. The simplest
interpretation of this data is that most authors
convey a neutral sentiment most the time, about one quarter are generally positive,
and the minority of authors are mostly negative in their tone.
However, most authors take a different tone based on a given topic, versus always being positive,
neutral, or negative. The below charts represent the full percentage distribution of commentary that
is positive, neutral, or negative compared to the overall distribution of authors. In other words, what
percentage of authors’ articles are conveying a particular sentiment? For example in this first chart,
20% of most authors’ articles are positive.
Positive Sentiment - Article Distribution
40%
30%
Positive Sentiment
20%
10%
0%
20% 40% 60% 80%
Percentage of Authors
2019 Global Journalism Report | 9Sentiment Also Matters (cont.)
Neutral Sentiment - Article Distribution
In this next chart, 60% of most authors’ articles are neutral.
30%
Neutral Sentiment
20%
10%
0%
20% 40% 60% 80%
Percentage of Authors
Negative Sentiment - Article Distribution
In this last chart, 10% of most authors’ articles are negative.
50%
40%
Negative Sentiment
30%
20%
10%
0%
20% 40% 60% 80%
Percentage of Authors
2019 Global Journalism Report | 10Key Takeaways
• There was a dramatic decrease in the percentage of authors who
contributed for Tier 1 publications, and a significant increase in the
percentage of authors who contributed for Tier 3 publications
• The number of professional journalists continues to decline overall
and the ratio of PR professionals to journalists is at an all-time high
• There is an extremely diverse set of editorial subjects being written
about, well beyond the most obvious news topics
• The average number of articles per author is increasing while the
average length of those articles is in decline, potentially leading to
negative consequences on search engine results
• Author influence is increasingly important and largely distributed
across the author ecosystem, with less than 2% of authors
commanding the highest level of influence
• Author sentiment continues to be a factor in the media relations
process, with most authors conveying a neutral sentiment most the
time and fewer authors predominantly positive or negative in their
overall tone
Heading towards 2020, many PR departments are changing the way
they think about the target journalist list. More than ever, businesses
are evaluating communications performance by connecting content to
actual business outcomes, and it is not always easy to predict which
journalists can help drive a brand’s Power of Voice™ or deliver high
PR Attribution™.
Today’s media relations pro requires real-time insights into the quality,
engagement, influence, and impact of their placements. This is the only
meaningful way to discover which journalists to develop relationships
with. But discovery is just the beginning. Once the most important
journalists have been identified, breaking through to them can be
challenging in today’s fragmented media ecosystem. According to the
US Census there are now more than 6 PR pros for every journalist.
Getting a reporter’s attention has never been easy. Now, it requires
data science.
But you don’t need a PHD to survive in the new PR world—that is why
we have artificial intelligence. The machines can now take over what
has become an otherwise insurmountable tasks of reading, analyzing,
and scoring billions of pieces of content every year, so communicators
can focus on telling great stories.
2019 Global Journalism Report | 11About the Study
Data is sourced from the Onclusive newscrawler, the world’s largest automated aggregator of
editorials, blogs, press releases, and content marketing; and from Onclusive’s Author Intelligence™
media relations system which uses AI to analyze and score over 2 million authors worldwide.
Definitions
Author: Any writer, reporter, or journalist contributing editorial content to a media publication
Article: A discrete piece of news, blog, press release, or content marketing
Influence Score: A relative, composite measure of the total volume of articles an author publishes,
their number of social media followers, and the total amount of social media engagement an author
earns
Publication: Any publisher of news, blogs, or content marketing in digital, television, print, and radio
formats
Publication Tier: A relative rank based on a digital media property’s domain authority and reputation
Power of Voice™: A proprietary metric developed by Onclusive for measuring the overall quality of
content marketing and earned media based on its relevance, sentiment, social media engagement,
and the authority of the publication in which the content appeared
PR Attribution™: A proprietary metric developed by Onclusive to measure the connection between
articles and business outcomes like website traffic and sales
About Onclusive
Onclusive is the data science company for marketing and communications. We use artificial
intelligence to reveal which earned media strategies drive business outcomes, and leverage
advanced marketing technologies to deliver a brand’s most valuable content to its intended
audience. Onclusive developed the Power of Voice™ metric as a way to measure the quality
of a brand’s media coverage in relation to its competitors, and invented PR Attribution™ to
measure the real impact that content is having on a company’s bottom line.
ContacT US
T: (415) 545-8247
E: info@onclusive.com
Request a Demo: demo@onclusive.com
2019 Global Journalism Report | 12You can also read