2020-21 Physician Supply: Estimates for Washington Wei Yen - Office of Financial Management
←
→
Page content transcription
If your browser does not render page correctly, please read the page content below
2020-21 Physician
    Supply:
   Estimates for Washington

    Wei Yen
    Wei.Yen@ofm.wa.gov

    Forecasting and Research
    Health Care Research Center
    The Office of Financial Management

    October 2021
2020-21 Physician Supply
To accommodate persons with disabilities, this document is available in alternate formats by
       calling the Office of Financial Management at 360-902-0599. TTY/TDD users should contact
                     OFM via the Washington Relay Service at 711 or 1-800-833-6388.
                                   Visit our website at www.ofm.wa.gov.

2020-21 Physician Supply                                                                             i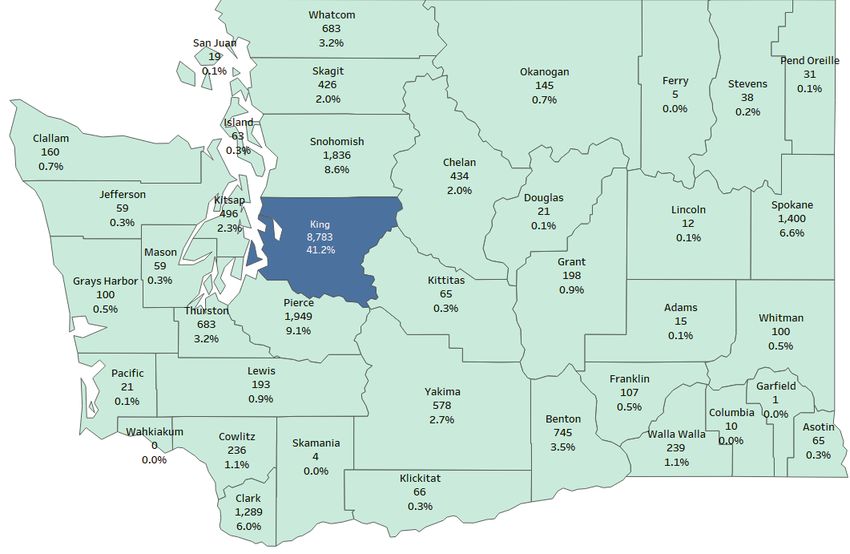
Contents
Executive summary ....................................................................................................................................... 1
   Our data sources and method .................................................................................................................. 1
   Here is what we found .............................................................................................................................. 1
Total physician supply ................................................................................................................................... 3
Physician supply by specialty ........................................................................................................................ 3
Supplies of primary care physicians and specialist care physicians.............................................................. 5
Physician demographics................................................................................................................................ 5
County distribution of physicians ................................................................................................................. 7
ACH distribution of physicians .................................................................................................................... 11
Appendix: Data sources and method.......................................................................................................... 15
   Data sources............................................................................................................................................ 15
   How we organized the data .................................................................................................................... 15

2020-21 Physician Supply                                                                                                                                    ii
List of Figures
Figure 1. Physician Licenses and Physicians Providing Direct Patient Care,
Washington State: 2020 and 2021................................................................................................................ 3
Figure 2. Total Practicing Physicians per 100,000 Population,
Washington State: 2020 and 2021................................................................................................................ 3
Figure 3. Number, percent and rate (per 100,000) of physicians by Specialty,
Washington: 2020 and 2021 ......................................................................................................................... 4
Figure 4. Year, number, percent and rate (per 100,000) of PCPs and specialists,
Washington: 2020 and 2021 ......................................................................................................................... 5
Figure 5. Gender of total physicians, PCPs and specialists (%), Washington: 2020 and 2021...................... 5
Figure 6. Median age of total physicians, PCPs and specialists: 2020 and 2021 .......................................... 6
Figure 7. Median age of total physicians, PCPs and specialists by gender,
Washington: 2020 and 2021 ......................................................................................................................... 6
Figure 8. Number and percent of physicians by county in 2020 and 2021
(numbers shown for 2021 only).................................................................................................................... 7
Figure 9. Number physicians per 100,000 population by county: 2020 and 2021 ...................................... 9
Figure 10. Number and percent of physicians by ACH, 2020 and 2021 ..................................................... 11
Figure 11. Number of physicians per 100,000 population by ACH: 2020 and 2021 ................................... 13

List of Maps
Map 1. Number and percent of physicians: counties 2020 .......................................................................... 8
Map 2. Number and percent of physicians: counties 2021 .......................................................................... 8
Map 3. Number of physicians per 100,000 population: counties, 2020 .................................................... 10
Map 4. Number of physicians per 100,000 population: counties, 2021 .................................................... 10
Map 5. Number and percent of physicians: ACH regions, 2020 ................................................................. 12
Map 6. Number and percent of physicians: ACH regions, 2021 ................................................................. 12
Map 7. Number of physicians per 100,000 population: ACH regions, 2020............................................... 14
Map 8. Number of physicians per 100,000 population: ACH regions, 2020............................................... 14

List of Tables
Table 1. Physician supply changes from 2020 to 2021 by specialty: Washington ........................................ 4

2020-21 Physician Supply                                                                                                                          iii
Executive summary
This annual report presents estimates of Washington state’s physician supply changes from 2020 to
2021. The physician supply refers to health providers with medical degrees in Doctor of Medicine (MD)
and Doctor of Osteopathic Medicine (DO) who are licensed and practice in Washington. The estimates
are presented for overall supply, in specialty groups, in primary care and specialist care, by physician
demographic characteristics, and for distributions among counties and Accountable Communities of
Health.

Our data sources and method
The main data source for this report is the Network Adequacy Reports (NAR) that health insurance
carriers submit monthly to the Washington State Office of the Insurance Commissioner. The NARs
contain information of individual providers affiliated to one or more provider networks that provide
direct care in Washington. We matched provider records in the NAR with records in the state’s provider
license database and with the national provider identifiers in the National Plan and Provider
Enumeration. In cases where a physician practices at multiple locations, we used a record weighting
method that accounts for the different locations without overcounting the total number of physicians. 1

Here is what we found
•     Overall physician supply. 2021 was another bumper year in Washington’s physician supply, which
      increased by 769 from the previous year to total 20,563 physicians. The total number of physicians
      in 2021 represents approximately 65% of physicians with an active license in the state. The growth
      in physician supply outpaced the general population increase. We can see this in the increase of
      physician-to-population ratio from 269 physicians in 2020 to 275 physicians per 100,000 population
      in 2021.
•     Physician supply by specialty. Family medicine/general practice, internal medicine (general),
      emergency medicine and anesthesiology continued to be the specialties with the largest number of
      physicians. This includes the other specialty group, which is made up of smaller specialized groups
      outside of the largest 12 groups. These large specialty groups each accounted for 6% to 28% of the
      total physician supply in 2021. While there was an increase in most specialty groups, the increases in
      the hospitalist and OB-GYN groups (21% and 14%, respectively) were by far the largest.
•     Supplies of primary care physicians and specialist care physicians. There were more physicians
      practicing in both primary care and specialist care in 2021 than in 2020. However, the share of
      primary care physicians declined slightly from 34% to 33%, while the share of specialist care
      physicians increased from 66% to 67%, suggesting a faster growth in specialist care.
•     Physician demographics. The share of female physicians in Washington’s physician supply increased
      in 2021, as it did in the previous few years, to a new high of 40.4%. The share of female physician
      also increased in primary care and specialist care. For the first time in primary care, there were more

1
    For detailed information on the data sources and method, see the Data Sources and Method section.

2020-21 Physician Supply                                                                                   1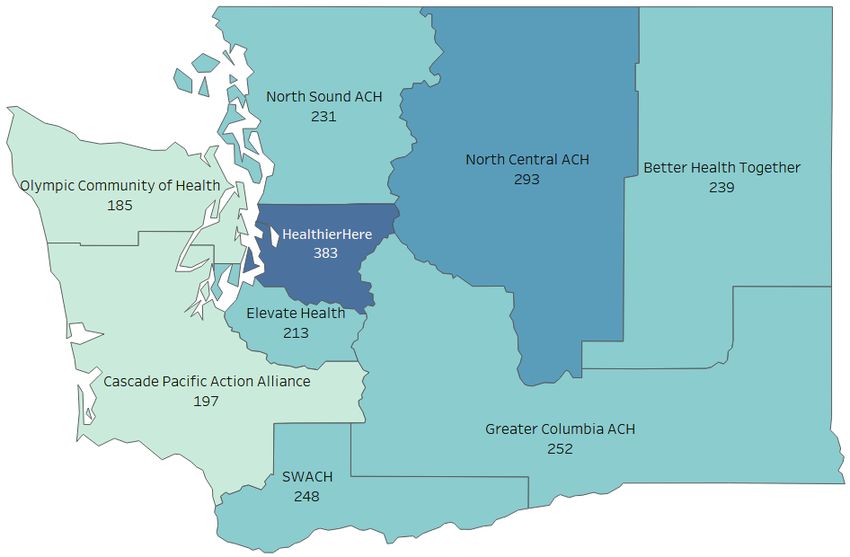
female physicians (51%) than male physicians (49%). The median age of physicians remained the
      same in 2021 as in 2020: 49 overall, 48 in primary care and 49 in specialist care.
•     Physician supplies in counties and Accountable Communities of Health. There was little change in
      the county shares of total physicians. King County, despite a slight decrease in its physician supply,
      still has by far the largest share at 41.2%. Pierce County, with a share of 9.1%, is the second largest.
      The four of the five largest counties (Pierce, Snohomish, Spokane and Clark) had a physician increase
      from 2020 to 2021. King County did not have an increase. Of the nine Accountable Communities of
      Health, 2 HealthierHere (which only consists of King County) has the largest share. North Sound ACH,
      which includes the Puget Sound counties north of King, has the second largest share of physicians,
      14.2%, and that is an increase from 13.4% in 2020.

We publish separate reports on the Office of Financial Management’s Health Care webpage for
estimates of physician demographics and specialties for counties and ACHs in 2020-21.

Finally, the appendix at the end documents the data sources and method that we used for this report.

2
    Accountable Communities of Health are comprised of one or more counties.

2020-21 Physician Supply                                                                                    2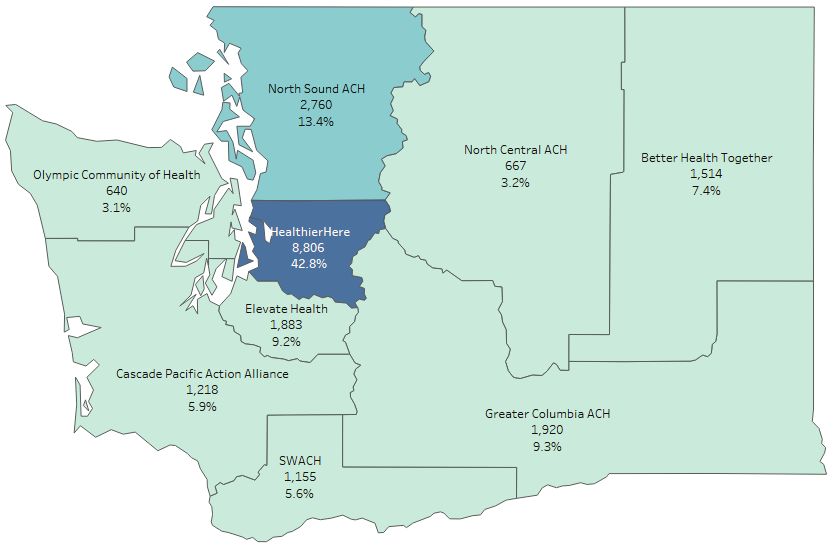
Total physician supply
After the largest increase in 2020, our state’s physician supply experienced another large increase in
2021. The state’s number of physicians in direct patient care increased by 769, from 20,563 in 2020 to
21,332 in 2021. The total number of physician licenses increased during this period, increasing by 792,
from 31,940 to 32,732 3 (Figure 1).

The difference in the total number of physicians in direct patient care and the total number of physician
license means that, in 2021, approximately 35% of physicians with a Washington license did not practice
patient care in the state. The increase in physicians in direct patient care in 2021 means that the
physician-to-population rate currently stands at 275 physicians per 100,000 population, an increase
from 269 in 2020. The increase in the physician-to-population ratio suggestions the growth in physician
supply is greater than that of the general population (Figure 2).

        Figure 1. Physician Licenses and Physicians          Figure 2. Total Practicing Physicians per
      Providing Direct Patient Care, Washington State:       100,000 Population, Washington State:
                       2020 and 2021                                      2020 and 2021

                           2020   2021
           31,940 32,732                                               269                       275

                                    20,563 21,332

          MD/DO Licenses          Direct Patient Care                  2020                      2021
                                      Physicians

Physician supply by specialty
Of the 13 specialty groups that account for the primary specialties of all practicing physicians in
Washington, the five largest specialty groups continued to be: other specialty, family medicine/general
practice, internal medicine (general), emergency medicine and anesthesiology. Each of these groups had
more than 1,250 physicians with over 5,900 in other specialty as the largest group, and each group
accounted for a share of the total physicians that ranges from 6% to 27.7% (Figure 3).

The number of physicians increased in all but three of the specialty groups. The three groups with a
decrease in physicians were internal medicine (general), emergency medicine and anesthesiology.
However, the decrease is small, below 1% each. Among the groups experiencing an increase, the

3
    The DOH physician licenses include those issued for MDs and DOs.

2020-21 Physician Supply                                                                                  3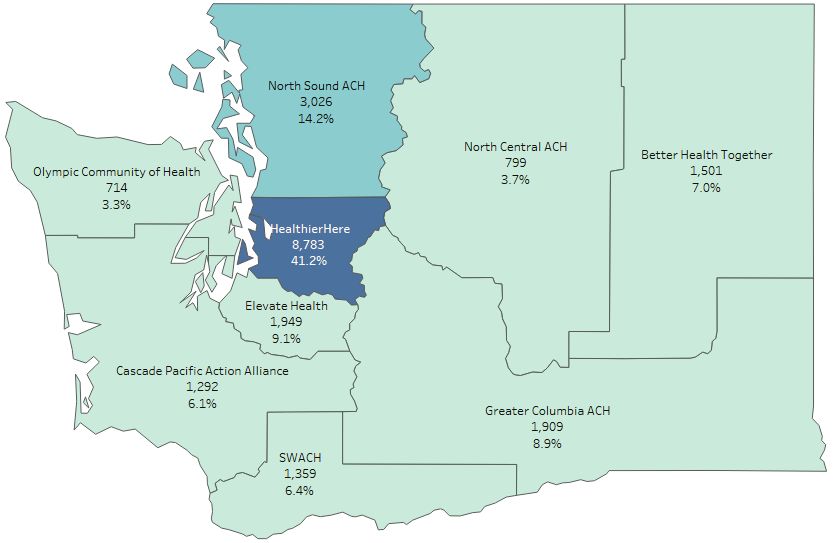
increase ranged from less than 1% to over 20%. The hospitalist group and the OB-GYN group had the
two largest percent increases, at 21.3% and 13.9%, respectively (Table 1).

                      Figure 3. Number, percent and rate (per 100,000) of physicians by Specialty,
                                             Washington: 2020 and 2021

                                                       2020        2021

                      Other Specialty                                                                   5,600; 27.2%; 73
                                                                                                           5,913; 27.7%; 76
  Family Medicine/General Practice                                              3,533; 17.2%; 46
                                                                                3,548; 16.6%; 46
        Internal Medicine (General)                                 2,410; 11.7%; 31
                                                                    2,403; 11.3%; 31
              Emergency Medicine                        1,480; 7.2%; 19
                                                        1,472; 6.9%; 19
                      Anesthesiology                  1,290; 6.3%; 17
                                                      1,279; 6.0%; 16
                             OB/Gyn                995; 4.8%; 13
                                                    1,133; 5.3%; 15
                           Radiology                1,102; 5.4%; 14
                                                    1132; 5.3%; 15
               Pediatrics (General)                963; 4.7%; 13
                                                   999; 4.7%; 13
                          Hospitalist          639; 3.1%; 8
                                                775; 3.6%; 10
                          Psychiatry            695; 3.4%; 9
                                                738; 3.5%; 10
              Orthopaedic Surgery              659; 3.2%; 9
                                               696; 3.3%; 9
                          Cardiology           611; 3.0%; 8
                                               630; 3.0%; 8
                 Surgery (General)             587; 2.9%; 8
                                               615; 2.9%; 8

                     Table 1. Physician supply changes from 2020 to 2021 by specialty: Washington

 Primary Specialty                      2020              2021               Change (N)            Change (%)
 Other Specialty                           5,600                 5,913       313                   5.6%
 Family Medicine/General Practice          3,533                 3,548       15                    0.4%
 Internal Medicine (General)               2,410                 2,403       -7                    -0.3%
 Emergency Medicine                        1,480                 1,472       -8                    -0.5%
 Anesthesiology                            1,290                 1,279       -11                   -0.8%
 OB/Gyn                                      995                 1,133       138                   13.9%
 Radiology                                 1,102                 1,132       30                    2.7%
 Pediatrics (General)                        963                   999       36                    3.7%
 Hospitalist                                 639                   775       136                   21.3%
 Psychiatry                                  695                   738       43                    6.3%
 Orthopaedic Surgery                         659                   696       37                    5.6%
 Cardiology                                  611                   630       19                    3.1%
 Surgery (General)                           587                   615       28                    4.8%
 Total                                    20,563                21,332       769                   3.7%

2020-21 Physician Supply                                                                                                  4
Supplies of primary care physicians and specialist
care physicians
Physicians can be categorized as practicing primary care or specialist care depending on their specialties.
From 2020 to 2021, the number of physicians increased in both categories. Primary care accounted for
7,015 or 33% of the total physicians in 2021. Despite the increase in the number of physicians, the 33%
in primary care is a slight decrease from the 34% (6,971) in 2020, suggesting that the increase in
specialist care physicians was larger. Indeed, while the number of primary care physicians increased by
0.6%, the number of specialist care physicians increased by 5.3% (from 13,592 to 14,317) and their share
of total physicians increased from 66% to 67%. The rate of primary care physicians per 100,000
population also dropped, though slightly, from 91 to 90. In the meantime, the supply of specialist care
physicians increased from 178 to 184 per 100,000 population, indicating its growth had a faster pace
than that of the general population (Figure 4).
Figure 4. Number, percent and rate (per 100,000) of PCPs and specialists, Washington: 2020 and 2021
2020 2021
13,592 14,317
66% 67%
178 per 100k 184 per 100k
6,971 7,015
34% 33%
91 per 100k 90 per 100k
PCP Specialist
Physician demographics
Gender. While the majority of physicians continue to be male, the share of female physicians continued
to increase in Washington. Overall, female physicians accounted for 40.4% of the physician supply in
2021, an increase of one percentage point over the previous year. Among those in primary care, female
physicians became the majority for the first time with 50.8%, increasing from 49.9% in 2020. Among
those in specialist care, the share of female physicians remained relatively low at 35.2% despite an
increase of one percentage point over the previous year.
Figure 5. Gender of total physicians, PCPs and specialists (%), Washington: 2020 and 2021
2020 2021
60.6% 65.9%
64.8%
59.6% 50.1% 50.8%
49.2% 49.9%
40.4% 35.2%
39.4%
34.1%
Total PCP Specialist Total PCP Specialist
Male Female
2020-21 Physician Supply 5Median age. There was no change in the median age from 2020 to 2021 among the physicians. Among
total physicians, the median age is 49. For primary care physicians, it is 48. For specialist physicians, it is
also 49 (Figure 6).
Figure 6. Median age of total physicians, PCPs and specialists: 2020 and 2021
49 48 49 49 48 49
Total PCP Specialist Total PCP Specialist
2020 2021
Median age of male and female physicians. The median age of male physicians overall dropped by one
year from 52 in 2020 to 51 in 2021. However, the median age of male physicians in primary care and
specialist care in 2021 remained the same (52 in primary and 51 in specialist care). The median age of
female physicians did not change from 2020 to 2021, regardless of their primary/specialist care status.
Also, female physicians overall, in primary care and in specialist care, all have a median age of 45, which
is about 6-7 years lower than the median ages of male physicians in corresponding categories (Figure 7).
Figure 7. Median age of total physicians, PCPs and specialists by gender, Washington: 2020 and 2021
52 52 51 51 52 51
45 45 45 45 45 45
Male Female Male Female Male Female Male Female Male Female Male Female
Total PCP Specialist Total PCP Specialist
2020-21 Physician Supply 6County distribution of physicians
The county distribution of the Figure 8. Number and percent of physicians by county in 2020 and 2021
state’s physicians in 2021 (numbers shown for 2021 only)
remained approximately the same
as in 2020, especially among the 2020 2021
first dozen of counties with the
King 8,783 ; 41.2%
largest numbers of physicians.
Pierce 1,949 ; 9.1%
Most of these counties had an Snohomish 1,836 ; 8.6%
increase in the number of Spokane 1,400 ; 6.6%
physicians with the exception of Clark 1,289 ; 6.0%
King, Benton and Whatcom where Benton 745 ; 3.5%
the number of physicians Whatcom 683 ; 3.2%
Thurston 683 ; 3.2%
decreased slightly. King County
Yakima 578 ; 2.7%
continued to lead the others with Kitsap 496 ; 2.3%
the largest number of physicians Chelan 434 ; 2.0%
that accounted for 41.2% of the Skagit 426 ; 2.0%
state’s total physicians. King’s Walla Walla 239 ; 1.1%
share is roughly three times Cowlitz 236 ; 1.1%
Grant 198 ; 0.9%
greater than the second largest
Lewis 193 ; 0.9%
share belonging to Pierce County Clallam 160 ; 0.7%
(9.1%). A total of 25 of the counties Okanogan 145 ; 0.7%
with the smallest shares each had Franklin 107 ; 0.5%
less than 1% of the state’s total Grays Harbor 100 ; 0.5%
physicians, accounting for a Whitman 100 ; 0.5%
Klickitat 66 ; 0.3%
combined sum of less than 10% of
Asotin 65 ; 0.3%
the state total (Figure 8). Kittitas 65 ; 0.3%
Island 63 ; 0.3%
Mason 59 ; 0.3%
Jefferson 59 ; 0.3%
Stevens 38 ; 0.2%
Pend Oreille 31 ; 0.1%
Douglas 21 ; 0.1%
Pacific 21 ; 0.1%
San Juan 19 ; 0.1%
Adams 15 ; 0.1%
Lincoln 12 ; 0.1%
Columbia 10 ; 0.0%
Ferry 5 ; 0.0%
Skamania 4 ; 0.0%
Garfield 1 ; 0.0%
Wahkiakum 0 ; 0.0%
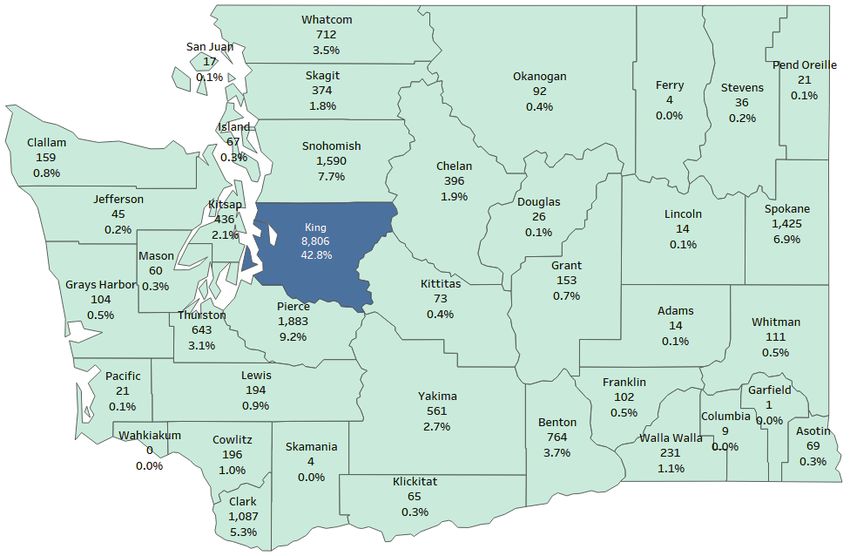
2020-21 Physician Supply 7Map 1. Number and percent of physicians: counties 2020
Map 2. Number and percent of physicians: counties 2021
2020-21 Physician Supply 8The counties with the largest Figure 9. Number physicians per 100,000 population by county:
numbers of physicians do not have 2020 and 2021
the physician supplies proportionate
2020 2021
to their populations. Take King
County, for example. It is the most 0 100 200 300 400 500 600
populous county, and it has the
Chelan
largest number of physicians. King
However, its physician-to-population Walla Walla
ratio is only the second highest Benton
Okanogan
(383). It is far lower than the highest Skagit
ratio of 532, which belongs to Chelan Whatcom
County. Chelan’s number of Klickitat
Asotin
physicians ranked 11th and its _State_ 275
population size ranked 16th in 2021. Spokane
Clark
Of the 37 counties with available Lewis
Columbia
estimates, 22 counties had an Thurston
increase in their physician-to- Pend Oreille
population ratios from 2020 to 2021. Yakima
The changes in these ratios, either Snohomish
Pierce
increases or decreases, are relatively Cowlitz
small for most counties. The Whitman
statewide rate
increases in Okanogan County and Clallam
Grant
Pend Oreille County are noticeable, Jefferson
however. Kitsap
Kittitas
The wide range of physician-to- Grays Harbor
Franklin
population ratios among the Lincoln
counties, from below 50 (Douglas San Juan
and Skamania) to above 500 Pacific
Mason
(Chelan), reveal a vast geographic
Stevens
disparity in Washington residents’ Adams
access to physician care (Figure 9). Island
Ferry
Douglas
Skamania
Garfield*
Wahkiakum*
2020-21 Physician Supply 9Map 3. Number of physicians per 100,000 population: counties, 2020
Map 4. Number of physicians per 100,000 population: counties, 2021
More data on county-level physician supplies including physician demographics and specialty details are
published in a separate report on OFM’s Health Care webpage.
2020-21 Physician Supply 10ACH distribution of physicians
An Accountable Community of Health, or ACH, is a regional coalition made up of representatives from a
variety of sectors who work together to improve population health. Each ACH represents a county or a
group of adjacent counties. The nine ACHs, with the counties in each, are: 4
1. Better Health Together (Adams, Ferry, Lincoln, Pend Oreille, Spokane and Stevens)
2. Cascade Pacific Action Alliance (Cowlitz, Grays Harbor, Lewis, Mason, Pacific, Thurston and
Wahkiakum)
3. Elevate Health (Pierce)
4. Greater Columbia ACH (Asotin, Benton, Columbia, Garfield, Franklin, Kittitas, Walla Walla,
Whitman and Yakima)
5. HealthierHere (King)
6. North Central ACH (Chelan, Douglas, Grant and Okanogan)
7. North Sound ACH (Island, San Juan, Skagit, Snohomish and Whatcom)
8. Olympic ACH (Clallam, Jefferson and Kitsap)
9. SWACH (Southwest Washington ACH) (Clark, Klickitat and Skamania)
Physician supplies increased in Figure 10. Number and percent of physicians by ACH, 2020 and 2021
six of the nine ACHs from 2020
2020 2021
to 2021. The three ACHs that
had a decrease, though small, 8,806 ; 42.8%
HealthierHere
are HealthierHere, Greater 8,783 ; 41.2%
Columbia ACH and Better 2,760 ; 13.4%
North Sound ACH
Health Together. HealthierHere 3,026 ; 14.2%
has the largest share of the
1,883 ; 9.2%
state’s total supply, at 41.2%. Elevate Health
1,949 ; 9.1%
The remaining ACHs each have
a share smaller than 15%, with Greater Columbia ACH 1,920 ; 9.3%
1,909 ; 8.9%
the smallest share of 3.7% in
North Central ACH. Better Health Together 1,514 ; 7.4%
1,501 ; 7.0%
SWACH and Cascade Pacific 1,155 ; 5.6%
SWACH
Action Alliance traded places 1,359 ; 6.4%
for the sixth and seventh largest
Cascade Pacific Action Alliance 1,218 ; 5.9%
ACHs in physician supply in the 1,292 ; 6.1%
last couple of years, with
SWACH is now the sixth largest North Central ACH 667 ; 3.2%
799 ; 3.7%
again. The rank order of the
other ACHs remained the same Olympic Community of Health 640 ; 3.1%
714 ; 3.3%
(Figure 10).
4
See https://www.hca.wa.gov/assets/program/achfactsheet.pdf.
2020-21 Physician Supply 11Map 5. Number and percent of physicians: ACH regions, 2020
Map 6. Number and percent of physicians: ACH regions, 2021
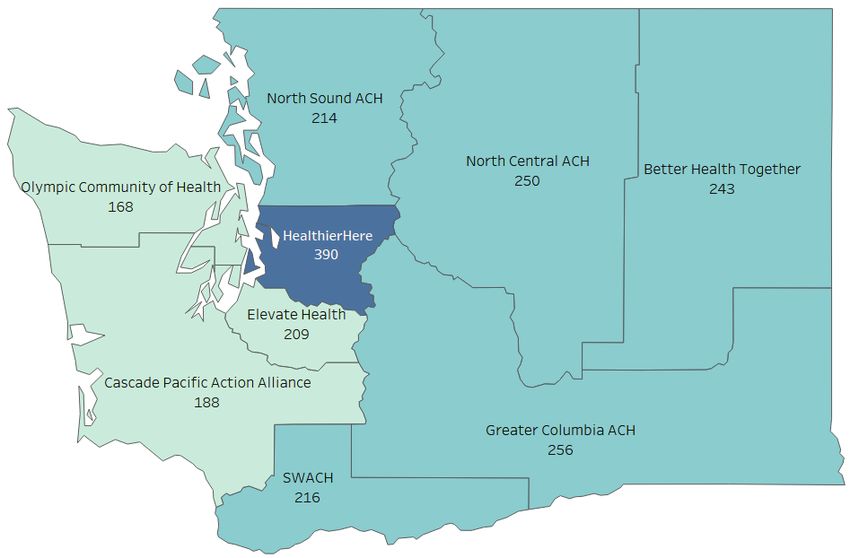
2020-21 Physician Supply 12The rank order of shares in physician supply among the ACHs does not match the ACHs’ physician-to-
population ratios, with the exception of HealthierHere that ranked first in both measures. HealthierHere
has the largest number and share of physicians and the highest ratio at 383 per 100,000 population.
HealthierHere, Greater Columbia ACH and Better Health Together each experienced a slight decrease in
their physician-to-population ratios. The other six ACHs had an increase, with the increases in North
Central ACH and SWACH particularly notable. North Central ACH’s increase from 250 to 293 moved it
from the third highest ratio to the second highest. SWACH, with a change from 216 to 248, moved up
from fifth to fourth. The difference between the highest ratio of 383 in HealthierHere and the lowest
ratio of 185 Olympic Community of Health is large, though not as striking as the difference in the highest
and lowest ratios we observed in individual counties (Figure 11).
Figure 11. Number of physicians per 100,000 population by ACH: 2020 and 2021
2020 2021
0 50 100 150 200 250 300 350 400 450
HealthierHere
North Central ACH
_State_ 275
Greater Columbia ACH
SWACH
Better Health Together
statewide rate
North Sound ACH
Elevate Health
Cascade Pacific Action
Alliance
Olympic Community of
Health
2020-21 Physician Supply 13Map 7. Number of physicians per 100,000 population: ACH regions, 2020
Map 8. Number of physicians per 100,000 population: ACH regions, 2020
We published more data on ACH-level physician supplies (including physician demographics and
specialty details) in a separate report on OFM’s Health Care webpage.
2020-21 Physician Supply 14Appendix: Data sources and method
Data sources
Network Access Report. Health insurance companies conducting business in Washington are required by
the state’s Office of the Insurance Commissioner (OIC) to file a monthly Network Access Report (NAR).
The purpose of these reports is for an insurer to demonstrate that it has an adequate supply of health
care providers in its network(s) for the intended services. The report contains records of health care
providers in contract with an insurance company’s provider network. The information on individual
providers includes name, credential, specialty and practice location(s). Starting in 2017, the state’s NARs
discontinued the previous provider specialty categories and replaced them with the Health Care
Provider Taxonomy Codes Set issued by the National Uniform Claim Committee. The NARs are publicly
available on OIC’s website. This study used the public NARs.
National Provider Identifier Registry. The National Provider Identifier (NPI) registry is a database in the
National Plan and Provider Enumeration System (NPPES) that the federal Centers for Medicare and
Medicaid Services (CMS) created. The NPI is a 10-digit unique number assigned to an individual or
organizational provider in the nation. Part of the NPI database is publicly available. The public
information for individual NPIs includes a provider’s name, NPI number, taxonomy and practice location.
The public NPI data were used for this study.
Provider License Database. Health care providers must obtain a provider license with the Washington
State Department of Health (DOH) to practice in the state. After initial licensing, providers must renew
their licenses at certain intervals depending on the professions. Physicians must renew their licenses
every two years. The provider license database includes information on the provider’s name, age, sex,
credential type, license start date, most recent renewal date and expiration date. A subset of the
provider license information is available for public search on the department’s website. However, for
this study, we used an extract file from the license database.
How we organized the data
1. Processed the June Network Access Reports for 2020 and 2021
We downloaded the NARs for June 2020 and June 2021 from OIC’s website. 5 Once we collected all
insurance companies’ reports, we combined them by year and processed each year’s data separately.
The NARs are structured in such a way that there are five blocks of rows of data and, depending on the
block, the column name and purpose may be different. For example, a column in the block for
‘individual provider information’ may be the individual NPI number, but the block for ‘organization
contract information’ may be the organization NPI number. That’s why our next step was to
‘rectangularize’ the data records by transforming the blocks of data rows into blocks of data columns so
that each row was a record for an individual provider. Our final step was to remove non-physician
records and retain only physician records.
5
If the June NAR is not available for an insurance company, then the closest earlier month of NAR available is used.
2020-21 Physician Supply 152. Matched physician records from the Network Access Reports with records in the National Provider
Identifier registry and the DOH provider license database
We matched processed physician records from the Network Access Reports with the National Provider
Identifier registry on the NPI numbers. The NPI is a unique identifier issued to health care providers. It is
required for Medicare services, but is also used by health insurance carriers. We only retained records
that matched on NPI between the two files
Next, the matched NAR-NPI records were matched with the DOH license database on the physician
credential number. In this step, we only retained matched records with non-expired licenses of June of
the selected year.
3. Recoded provider taxonomies and primary specialty assignments
The number of provider taxonomies in the NARs was too large for meaningful analyses. To reduce the
number for reporting, we constructed a file that converts provider taxonomy into 13 provider specialty
groups. We then applied the file to the NAR file to create the primary specialty field. We determined a
physician’s primary specialty by the first taxonomy code linked to that physician at a practice location. If
different insurance companies had different first taxonomy codes for this physician at that particular
location, then we assigned the physician multiple primary specialties. The physician was also assigned
multiple primary specialties if they had multiple practice locations and different first taxonomies
associated with those locations. The 13 specialty groups we adopted for this report are:
1. Anesthesiology
2. Cardiology
3. Emergency medicine
4. Family medicine/general practice
5. Hospitalist
6. Internal medicine (general)
7. OB/GYN
8. Orthopedic surgery
9. Pediatrics (general)
10. Psychiatry
11. Radiology
12. Surgery (general)
13. Other specialty
4. Final record selection
There are numerous duplicate records due to cross-carrier reporting and/or cross-plan reporting within
a carrier’s report. In the final record selection process, only one record was retained from the data field
combination of NPI, primary specialty, practice geo-coordinates and practice name. In addition, we
excluded a small number of records from the final selection because of missing data on the state of the
practice location, physician’s last name or NPI.
2020-21 Physician Supply 165. Constructed physician record weights We counted each physician as no more than one person even though the NAR data included physicians who had multiple practice locations or more than one primary specialty. To meet this requirement, we constructed ‘data weights’ and applied the weights to the physician records. Initial weight. Each physician was assigned the weight of 1, initially. If a physician was associated with more than one primary specialty, then the initial weight would be redistributed equally among the primary specialties. For example, if a physician had two primary specialties, each primary specialty would receive an initial weight of 0.5. ZIP code level weight. After we assigned the initial weights, we redistributed initial weights to a physician’s records for different ZIP codes associated with a primary specialty. To do that, we first counted the number of ZIP codes associated with a physician’s primary specialty. Then, we summed up the populations of the ZIP codes. 6 Then we calculated each ZIP code’s fraction of the total population from all associated ZIP codes. We used these fractions to distribute the initial weight into ZIP codes associated with a physician’s primary specialty. For example, suppose the initial weight for one of a physician’s two primary specialties (internal medicine) was 0.5 and the physician was associated with three ZIP codes that accounted for 70%, 20% and 10% of the total population of the three ZIP codes combined. The ZIP code with 70% of the population would receive 70% of the initial weight for the primary specialty, thus, 0.35 (i.e., 0.5x70%), the 20% ZIP code would receive a weight of 0.1 and the 10% ZIP would receive a weight of 0.05. In some cases, a physician’s primary specialty was associated with multiple locations within a ZIP code area. In that case, each location would receive an even share of the ZIP code-level weight that we previously assigned. Using the physician example above, suppose the physician’s internal medicine specialty was associated with three locations in the 70% ZIP code area. That means the final weight for each location record for this ZIP code associated with this physician’s internal medicine specialty would be 0.1167 (0.35/3). Finally, the sum associated with a physician should equal 1 and the sum for all physicians should equal our count of physicians without the weights. We can use the ZIP code level weights to analyze a single ZIP code, clusters of ZIP codes and the state. County level weight. For county-level analyses, an additional step was necessary to further distribute the physician record weight at the ZIP Code-level for ZIP codes that cross county boundaries. Similar to the approach we used to construct ZIP Code-level weight, a county’s fraction of such a ZIP code’s weight was determined by the county’s fraction of the population for that ZIP code in relation to the total population of the ZIP code. Using the same physician example from above, suppose the 20% ZIP code is associated with two counties and County A’s population fraction of the ZIP code’s total population is 70% and County B’s fraction is 30%. Then the ZIP Code-level physician record weight of 0.1 is 6 Some ZIP Codes in the original Network Access Reports do not have associated population data. These are either institution ZIP Codes (e.g., campus ZIP Code for universities) or mailbox ZIP Codes. Online ZIP Code maps were used to choose a substitute ZIP Code. The substitute ZIP Code is one that either encircles or shares the longest borderline with the ZIP Code in question. 2020-21 Physician Supply 17
redistributed into 0.07 (0.1*0.7) to County A and 0.03 (0.1*0.3) to County B. For ZIP codes whose areas
are within the boundary of a single county, the ZIP Code-level weights were then copied over to the
county-level weight.

From this process, the sum of weights of all records associated with a physician should sum to 1 and the
sum of weights of all physicians should equal the unique count of physicians without weights. The
county-level weights can be used for analyses for counties, regions consisting of counties and the state.

6. Defined terms
Physician count: The physician count is calculated by summing the physician record weights in our
analysis file. A physician can have more than one primary specialty and may practice at multiple
locations. When we weight these records, we assume each physician identified in the NARs is working at
full time equivalency (FTE). We then distribute the physician’s FTE into primary specialties, then to
practice locations in different ZIP code areas, and then into different counties when a ZIP code area
crosses county boundaries. Therefore, one physician’s FTE in a specific area can sometimes mean
several physicians each contribute a fraction to the FTE.

Primary specialty: A primary specialty is the first provider taxonomy code of a physician listed under a
health insurance carrier’s plan for a practice location in the NAR.

PCP/Specialist physicians: A PCP is a physician who provides primary care. Primary care, in general,
refers to “the provision of integrated, accessible health care services by clinicians who are accountable
for addressing a large majority of personal health care needs, developing a sustained partnership with
patients, and practicing in the context of family and community.” 7 Physicians whose practice is not
mainly in primary care are specialists. What a physician does in their practice should be used to describe
the physician as a PCP or specialist. But in reality, it is quite difficult to collect such information. Instead,
analysts generally classify physicians practicing with certain specialties as PCPs, although not all analysts
agree on the set of specialties. For this study, primary care specialties include the following: family
medicine/general practice, geriatric medicine, internal medicine (general) and pediatrics (general).

Physician rate: We calculate a physician rate as the number of physicians for a given population size of a
specific geographic area. The usual population size we use is 100,000. Although physicians in certain
specialties treat only specific groups of the population, such as physicians in pediatrics and OB/GYN, we
base the physician rate calculation on the overall population, not the population groups those physicians
generally provide care for. For this study, we calculated the physician rate as number of physicians per
100,000 population for the state, counties and Accountable Communities of Health (each consisting of
one or more counties).

7. Limitations
The Network Access Report is the main data source we used for physician supply estimates in this study.
There are two possible sources of errors that may affect data accuracy in NARs and our study estimates,
although we don’t expect either error to be large. One source is the omission of providers who are not
affiliated with any insurance networks. Often these providers include some solo practitioners, some in

7
 Donaldson MS, Yordy KD, Lohr KN, Vanselow NA, Editors. Primary Care: America's Health in a New Era.
Committee on the Future of Primary Care, Division of Health Care Services. Institute of Medicine. National
Academy Press. Washington, D.C. 1996: p. 31.

2020-21 Physician Supply                                                                                      18
small practice groups and those who work for the federal or state institutions exclusively (e.g., Veterans
Affairs hospitals, military hospitals and state hospitals). This error would undercount the physician
supply. The other source of error would overcount the physician supply. This type of error occurs when
insurance companies fail to promptly remove records from NARs for providers who no longer practice in
Washington (due to retirement or moving to another state, for example), although they maintain a state
license.

These two errors, because of their opposite effect, may reduce each other’s impact to a certain degree.
Without a perfect census of the providers practicing in Washington, though, it is impossible to precisely
quantify these two errors and their overall effect on physician supply estimates.

Another potential error may exist due to the weighting method we used. When a physician has multiple
primary specialties or multiple practice locations within a ZIP code area, we evenly distributed the initial
weight to each primary specialty or each location within that ZIP code area. In reality, physicians with
multiple specialties or multiple locations may spend disproportionately more time in one specialty or at
one location. With no weighting, however, the analyst would have to arbitrarily choose one specialty or
one location to represent the physician.

We have no doubt that these ZIP code-level and county-level weighting techniques improve our
estimation of the physician distribution when compared to an analyst arbitrarily choosing which ZIP
code area and county to assign the physician. However, the precision from these weighting schemes
remains unknown.

Yet another issue, though not necessarily a source of error, is that this study’s method does not consider
bordering states that provide services to Washington residents. For example, Clark County sits across
the Columbia River from the greater Portland area in Oregon. Some Clark residents use physician
services in the Portland area. Therefore, the actual physician supply would be larger than estimated in
this report if we had included physicians serving Washington residents in neighboring states.

2020-21 Physician Supply                                                                                  19
You can also read