2021-2022 Medicine Hat Community Housing ...
←
→
Page content transcription
If your browser does not render page correctly, please read the page content below

Service Delivery Plan
2021-2022
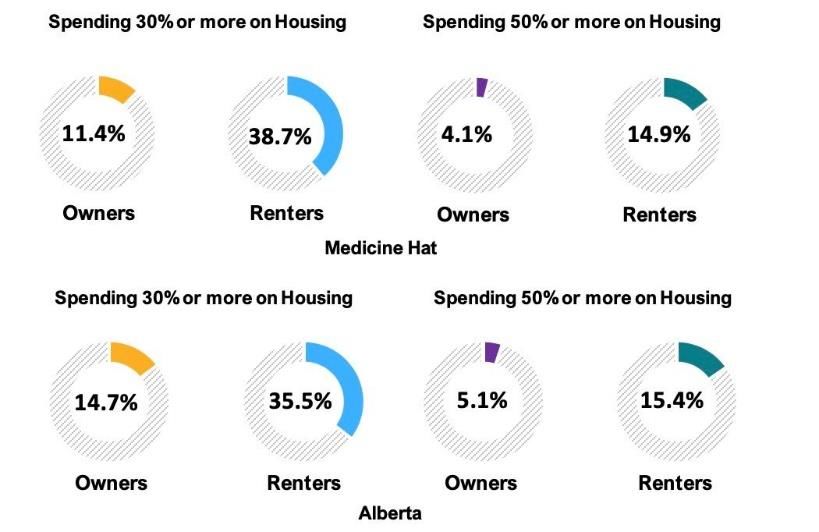
TABLE OF CONTENTS

COVID-19 RESPONSE FOR VULNERABLE POPULATIONS    3

MEDICINE HAT COMMUNITY PROFILE                  5

HOUSING COST BY HOUSEHOLD TENURE                6
HOUSEHOLD TRENDS AND PROJECTIONS                6
EMPLOYMENT                                      7
HEALTH AND MEDICAL                              7
MENTAL HEALTH                                   8
SUBSTANCE USE                                   8
CRIME & CORRECTIONS                             8
DOMESTIC VIOLENCE                               9
FOOD                                            9
RECREATION                                      9

A SYSTEMS APPROACH TO HOMELESSNESS             10

MHCHS PROFILE                                  15

CBO/CE DECISION MAKING PROCESS                 17

CBO/CE PRIORITIES                              19

PROJECT FUND ALLOCATION PLAN                   20

SCHEDULE A APPROVED PURPOSES                   22

SCHEDULE B FINANCIAL PLAN                      33

APPENDIX A CBO JOB DESCRIPTIONS                34

                                   2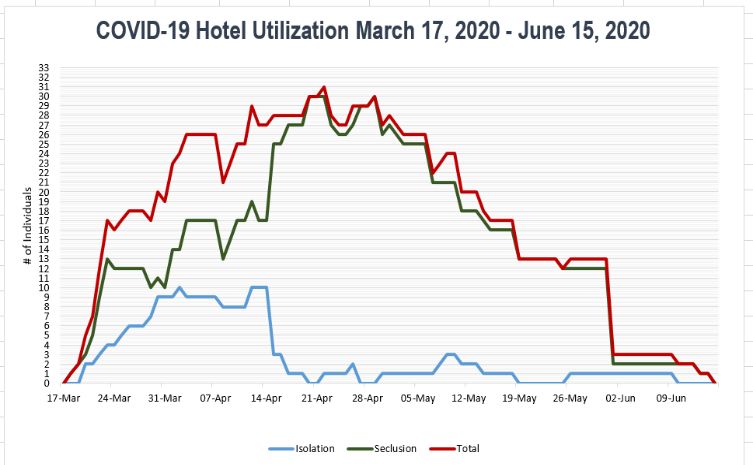
COVID-19 RESPONSE FOR VULNERABLE POPULATIONS

As of April 28, 2021, Medicine Hat South Zone has a 267.2 per 100,000 population active case rate of infection to date. The City
of Medicine Hat had 883 total cases, 182 of which are currently active and 683 of which have recovered. There have been 18
deaths so far in Medicine Hat.1
In response to the COVID-19 pandemic and its impact on the community, the CBO worked directly with AHS and community
partners to oversee and implement the Strategy for Vulnerable Populations throughout the pandemic response. The
implementation of a new day shelter, isolation units, and a social worker in the Medicine Hat Public Library were some of the
measures taken to reduce the repercussions of the pandemic. To that end, the data is being provided to provide context.
Along with the health repercussions that COVID-19 has had, the social and economic repercussions has led to an increase in
demand for services related to mental health, safety, and physical health. Between the information overload, lost sense of daily
structure and routine, collective worry for our high-risk community members, and the nature of socially distant interactions, the
demand for services will remain high. Medicine Hat has felt, and will continue to feel in coming years, the economic and social
impact of self-isolation and quarantining.
The challenges amplified by the pandemic have shown that while there are not major shortcomings in the social safety net of
Medicine Hat, there is always opportunity for improvement of the current system. As Alberta continues its “re-opening” strategy,
it will be important to monitor changes to the rates of infection, as well as impacts on other social issues including equitable
access to basic needs, community health, community wellbeing, and economic wellbeing.

                                                      By the Numbers
 1. June 15, 2020 marked the transition of the last individual from hotel for the COVID-19 response. Medicine Hat was the first
    community to initiate a coordinated community response, and the first to close out the response. The chart below provides
    an overview of utilization from March 17, 2020 to June 15, 2020.
            o 52 individuals were directly assisted through the COVID-19 community response through allocation of hotel
                rooms for isolation and/or seclusion purposes. Of the 52, 7 returned to shelter, 2 are engaging in supports to
                get housed.
            o A total of 9 hotels were used for the community response.

                                                                3
2. 2 youth accessed dedicated isolation units (not hotel)
3. Vaccination clinics were held on April 22, 23, and 29 for those identified as vulnerable in community, where a total of 37
immunizations against COVID-19 were administered. Further clinics for family violence shelters and vulnerable populations
are being scheduled.
4. From its establishment on December 18, 2020 until March 31, 2021, 345 unique participants utilized the services offered by
the McMan-operated Daytime Shelter. The McMan Daytime Shelter was accessed 4,985 times by these 345 individuals.
o 56 individuals utilized on-site connections to housing supports through Medicine Hat Community Housing and
McMan Youth Hub.
o 61 individuals utilized on-site connections to mental health and addictions supports through Medicine Hat
Recover Centre and Mobile Addictions Outreach.
o 7 individuals utilized on-site connections to medical services such as EMS and community paramedics.
o 15 individuals utilized on-site connections to cultural supports through the Medicine Hat College Cultural
Worker and HIV Community Link.
o Referral services were offered on-site as well and were utilized 157 times. Referrals were made to self-
isolation units, overnight accommodation, food security services, employment services, legal services, and
housing, income, cultural, medical, mental health, and addictions supports.
5. The McMan-operated Self-Isolation Units were established as a COVID-19 response for those experiencing
homelessness that need to isolate. From December 2, 2020 to March 31, 2021 the self-isolation units were utilized by
11 unique individuals for reasons including positive results, close contact, and being symptomatic.
o While in isolation, participants have access to supports in connecting to services. Two individuals were
referred to housing, two to medical supports, three to mental health and addictions supports, and one
individual was referred to food security services.
4MEDICINE HAT COMMUNITY PROFILE
To continue transforming a system or community, it is essential to understand the context in which it exists. The following
information provides a picture of the social landscape in Medicine Hat in comparison to Alberta and Canada as a whole. These
statistics also function as an entry point to better understanding the issues that the community experiences.
Medicine Hat is located 579km southeast of the provincial capital, approximately 293km southeast of Calgary, and 146km north
of the United States border. Medicine Hat is located on the Trans-Canada Highway, Highway 3, and the Canadian Pacific Railway
mainline. It is the major urban centre of southeast Alberta.
Medicine Hat has maintained a stable population growth. Medicine Hat’s population increased by 43% between 1996 and 2016
(compared to a 62.2% increase for Alberta) and currently stands at 67,585 people.2
Percentage Distribution of Medicine Hat versus
Medicine Hat Population Distribution Alberta Population by Age Group on March 31,
by Age and Gender on March 31, 2018 2018
45.0%
Age Group Female Male Total 40.0%
Infants: Under 1 355 364 719 35.0%
Pediatric: 1-17 6,562 6,752 13,314 % of Population 30.0%
25.0%
18-34 7,232 7,628 14,860 20.0%
35-64 13,571 13,322 26,893 15.0%
10.0%
65-79 4,516 3,985 8,502 5.0%
80 & Older 2,023 1,273 3,296 0.0%
Infants: Pediatric: 18-34 35-64 65-79 80 & Unknown
Unknown 0 0 0 Under 1 1-17 Older
Total 34,259 33,325 67,585
Medicine Hat Alberta
The largest age group in 2018, was people between 25 and 64 years old, who accounted for 39.8% of the population compared to
40.2% for Alberta. Children 17 and younger made up 20.8% of Medicine Hat’s population compared to 21.1% for Alberta, while
individuals 65 and older accounted for 17.5% of the population compared to 12.5% in Alberta.
According to Statistics Canada, Indigenous peoples living in Medicine Hat in 2016, made up 1.3% of the total population of the city.
The number of Indigenous peoples in Medicine Hat increased by
Indigenous Population: Medicine Hat and 34.7% from 590 in 2006. In comparison, Indigenous peoples made
Comparators, 2016 up 3.1% of the population in Alberta in 2016.3
4.0%
Proportion of the Population:
3.4% 3.4% The majority of residents speak English as their primary language
Registered or Treaty Indian
3.5% 3.1%
3.0% (55,705). About 5,035 have a mother tongue that is a non-official
2.5% language. However, approximately one in six citizens have
2.0%
1.3% knowledge of a non-official language even if it is not their mother
1.5%
1.0% tongue, including both Indigenous and non-Indigenous languages.4
0.5%
0.0% The top Indigenous mother-tongues are Cree, Ojibway, Oji-Cree,
Medicine Hat Lethbridge Grande Prairie Alberta and Iroquoian. The top non-indigenous mother-tongues, excluding
Geographies English, are Spanish, Mandarin, German, Tagalog, and Arabic.
5Housing Cost by Household Tenure
According to CMHC, in 2016, 9.2% of all households, 4.1% of all owners, and 23.5% of all renters in Medicine Hat are in core
housing need. This means that the housing does not meet one or more standards for housing adequacy, suitability, or affordability.
Further, to be classified as being in core housing need it means that acceptable local housing costs more than 30% of household
pre-tax income.5 Renter households generally have lower incomes compared to owner households, partly explaining the higher
percentage of renters in core housing need.
This indicates that there is a greater need for rental housing which is affordable to households with low and moderate incomes
compared to ownership housing in Medicine Hat. The graphic below shows the percentage of owners and renters in Medicine Hat
compared to Alberta, that spent more than 30% and more than 50%, respectively, of their income on shelter in 2015.
Proportion of Income Spent on Shelter by Household Tenure;
Medicine Hat and Alberta, 2015
Household Trends and Projections
While population trends and characteristics are important indicators of housing need, household characteristics are more directly
related to housing need as each household requires a housing unit. As such, it is important to understand the trends in the number,
size, type, and tenure of households in a community.
There were 26,655 households in Medicine Hat in 2016; up by 12.9% from 23,611 in 2006. In comparison, the number of households
in Alberta increased by 21.6% during the same time period. In addition, the population of Medicine Hat increased by a slightly lower
rate compared to the increase in the number of households (11.0% vs. 12.9%) suggesting that household sizes in Medicine Hat
are getting smaller.
The number of owners and renters in Medicine Hat increased at a similar rate from 2006 to 2016. Owner households increased by
12.6% while renter households increased by 13.7%. In comparison, the number of all households increased by 12.9% during the
same time period. While homeownership is the ideal for many households, a more balanced share of owners and renters indicates
a more healthy and inclusive community, however this is dependent on rental availability.
According to the Fall 2020 CMHC Rental Market Report, vacancy rates increased to 7.2% across Alberta. Medicine Hat's vacancy
rates experienced a 1.1% decrease, from 4.9% to 3.8%.6
6Medicine Hat Vacancy & Rental Rates by Date
Vacancy Rates Rental Rates
Unit Size October October October October
2019 2020 2019 2020
Bachelor ** 10.3% $683 $731 3.8% Medicine Hat
1 Bd 4.7% 3.2% $793 $815 Vacancy Rate
2 Bd 5.2% 4.1% $886 $915
3 Bd+ 0.9% 1.8% $1,075 $1,117
Total 4.9% 3.8% $863 $886
CMHC Rental Market Statistics Fall 2020, Vacancy and Availability Rates (%) in Privately
Initiated Rental Apartment Structures of Three Units and Over: Medicine Hat.
Employment
In 2020, 96.1% of businesses in Medicine Hat were considered small businesses (1-49 employees), making them a vital part of the
community and economy. Over the past year, the number of businesses in Medicine Hat decreased 1.77% with a total of 2,279
businesses in 2020 compared to 2,320 in 2019.7
The 2018 employment rate in Medicine Hat was 57.7%, with 6.1% of the working force unemployed.8 This means that of the people
that make up the working age population, 35,700 were employed, 23,900 were not in the labour force, and 3,721 were unemployed.9
In 2019, 1,270 people accessed employment insurance benefits, up from 820 in 2018.10
In the 2019 Vital Conversations Survey, one in five respondents considered job opportunity shortage as a priority, followed by
growth and diversity in business and employment opportunities. Newer areas of business include solar power, cannabis/hemp, and
breweries/distilleries.11 Before taxes, the median family income in Medicine Hat is $91,960 CAD, up from $89,710 CAD in 2017.12
While this is enough to support most individuals, Medicine Hat notably has a 15.4% rate of child poverty, among the highest for
urban centres in Alberta.13
Health and Medical
Top health concerns for Medicine Hatters include access to mental health services (counselling, support groups), ability to afford
care (medication, uninsured services), and access to health services (family physicians, specialists, etc). The South Zone for Alberta
Health Services had 7,284 staff, 1,663 volunteers, and 556 AHS physicians in 2020.14 Currently, there are six physicians in Medicine
Hat accepting new patients.15
The Alberta South Health Zone has a higher proportion of people who are inactive at 49.4% (almost half the population), compared
to 43.1% province wide. In 2015, it was found that the disease with the highest prevalence rate per 100 population in Medicine Hat
was hypertension at 20.7%, a rate similar to the rest of Alberta. Similarly, the most frequent cause of death reported between 2016
and 2018 was disease of the circulatory system.
In 2017/2018, Medicine Hat emergency rooms were utilized for 31,721 visits, 10.9% of which were for resuscitation or emergency,
38.6% of which were urgent visits, 44.2% semi-urgent visits, 5.7% non-urgent visits, and 0.6% of which were unknown. Notably,
the three most common reasons for utilizing emergency rooms in Medicine Hat included acute upper respiratory infections, mental
and behavioural disorders due to substance use, and diabetes mellitus.16
Regarding primary care, there were 13,494 unique individual home care clients, 870 people placed in continuing care, and 101,651
seasonal influenza immunizations in 2019-2020 in the Alberta South Zone. There were also 37,182 calls to Health Link, up from
previous years likely due to the COVID-19 pandemic. Throughout the South Zone, there were also 194,338 emergency department
visits. The average length of stay in acute care was 7.5 days. The Alberta South Zone also had 3,183 unique cancer patients who
cumulated 35,948 visits, up from the year before.17
7Mental Health
According to the Alberta Community Health Survey in 2018,18 the average personal wellness index in the Alberta South Zone was
79.60, almost identical to the provincial average. Twenty percent of Albertans rated their ability to “handle the day-to-day demands
in [their] life” as excellent, 45% as very good, and 25% as good. The remainder of respondents indicated fair or poor on this question.
Interestingly, the same survey found that 26.8% of Albertans felt slightly anxious or depressed (29.8% in Alberta South), and 12.4%
of Albertans felt moderately anxious or depressed (14.7% in Alberta South). In 2019-2020, the Alberta South Zone saw 2,520
mental health hospital discharges (acute care sites), a number that has consistently increased since 2014.19
The Alberta Mental Health Review Committee’s review of the mental health system in Alberta listed four areas for action: acting in
partnership to create an integrated system, acting on access by enhancing the role of primary healthcare, acting early to focus on
prevention and early intervention, and acting on system enhancements, legislation, and standards.20 The February 2019 progress
report on Valuing Mental Health: Next Steps describes work underway to improve mental health throughout the province, including
improving information sharing, testing community integration
Self-Perceived Excellent or Very Good Health 2018 models, supporting Albertans with adverse childhood
vs 2020 experiences, increasing technology-based solutions,
80% 71% 72% 71% developing a youth suicide prevention plan, developing
62% 66%
60% regulations and standards for addiction providers, exploring
60% 49%
42% funding models, and clarifying roles and responsibilities.21
40%
In April 2020, the first month of the COVID-19 pandemic, fewer
20%
Canadians, particularly women and youth, have been reporting
0% excellent or very good mental health, although overall
Youth (15-24 Women Men Elderly (65+)
Years) Canadians have been reporting better physical health. The
2018 Canadian Community Health Survey chart exemplifies the impact on mental health that COVID-19
2020 Canadian Perspectives Survey Series
has had the past year.22
Substance Use
Between January 2020 and February 2021, Medicine Hat’s EMS responded to 94 calls related to opioid use and misuse. While this
is low in comparison to other municipalities in Alberta, it is a concerning number. Further, there were 21 deaths related to drug
misuse during this same time.23 Medicine Hat has the ninth most utilized facility in Alberta for hospitalizations related to harm
associated with opioids and other drug use, accommodating 3% of all related stays in Alberta, and has the fifth highest rate of
hospitalizations related to overdose in Canada.
According to the Canadian Perspectives Survey Series, the vast majority of Canadians report that their consumption of cannabis,
alcohol, and tobacco remain unchanged during COVID-19. However, there is a minority who reported substance use increases:
14% of respondents report increased alcohol consumption, 6.5% increased cannabis use, and 3.3% increased tobacco use in the
early COVID-19 period. Unsurprisingly, there is a correlation between worse self-reported mental health and increased use of
cannabis, alcohol, and tobacco.24
Crime & Corrections
Medicine Hat has a Crime Severity Index of 85.05, lower than the provincial average of 119.07 and higher than the Canadian
average of 79.45.2526 Little data is publicly available on corrections in Medicine Hat specifically, but Canada-wide, the adult and
youth incarceration rate has declined over the past five years, including in Alberta.
In response to the COVID-19 pandemic, efforts to reduce the number of individuals currently in correctional facilities were
introduced. As such, at the end of May 2020 there was a 5% decline in adults in federal custody, and a 28% decline in adults in
provincial/territorial custody compared to March 2020. While the population of adults currently in custody has declined quickly over
8the past year, across Canada, Indigenous populations are still over-represented in custody. In 2018/2019, Indigenous adults
accounted for 31% of admissions to provincial/territorial custody and 29% of admissions to federal custody, while representing only
approximately 4.5% of the Canadian adult population. 27
Domestic Violence
It should be noted that because of the stigmatic nature of reporting domestic violence, cases often go unreported. The data available
is certainly a reflection of how often these incidents occur but cannot provide the full picture.
In 2019, there was a 7% increase in the rate of police-reported family violence in Canada compared to 2018, with a 10% increase
in reports by men and boys, and a 6% increase in reports by women and girls.28 There were 69,691 child and youth victims of
police-reported family and non-family violence in Canada, 57% of which were female and 43% of which were male. Close
acquaintances and family members were the most common perpetrators for both male and female victims, and majority of the child
and youth victims were victimized at a residential location. Almost a third of police-reported violence happened between intimate
partners in 2019. Police-reported intimate partner violence increased 6% in 2019 compared to the year before, again increasing
more for men (10%) than for women (5%). Women are overrepresented as victims of intimate partner violence, accounting for 79%
of victims.29 In 2019, 14,156 seniors were victims of violence, increasing 8% compared to the year before. One third of these seniors
were victimized by a family member. The rate of family violence was higher for senior females than senior males; however, males
experienced violence from non-family members at a rate almost double that of women.30
Some compiled and analyzed data has existed in Medicine Hat and Alberta since the advent of COVID-19. The Data2Action project,
an initiative of SHIFT, IMPACT, and Data2Action is underway to compile and analyze this data on a provincial and regional scale
in Alberta.
Food
In 2017/2018, 8.8% of Canadian households - approximately 1.8 million - experienced some moderate or severe food insecurity
due to financial constraints. Households with lone parents were found to have a prevalence of food insecurity over twice as high as
couples with children. Female lone-parent families were most likely to experience food insecurity (25.1%) followed by male lone-
parent families (16.3%) and couples with children (7.3%). Furthermore, households that rent their home experience food insecurity
much more than households that are owned, at 19.1% and 4.2% respectively. Additionally, just over one in five households that
rely on government benefits as their main source of income were found to be food insecure. Results in Alberta are similar to these
national averages. It is important to note that these numbers exclude people living on First Nations reserves, people in some remote
northern areas, and people experiencing homelessness, all of which are at high risk of food insecurity.31
The Government of Canada is currently in the process of conducting the 2020 Household Food Security Survey Module (HFSSM),
which will soon provide more up-to-date data on food insecurity in Alberta.
Recreation
Recognizing that recreational activity can include more than participating in sports, it is important to acknowledge that it is difficult
to measure the degree to which people actively participate in recreational activities. It is important to note that recreational activity,
particularly in natural environments, reduces anti-social behaviour,32 increases community quality of life and happiness,33 and serve
as a protective factor in the health and well-being of immigrant families.34 Further, research shows that cities with active-friendly
environments benefit from increased productivity, improved school performance, higher property values, and improved health and
well-being.35 One in four adults and one in two children actively participate in sport, while over 5.3 million Canadians volunteer as
coaches, officials, and organizers, making sport an important part of Canada’s social fabric as well.36 In Medicine Hat in 2017, 68%
of the population were physically active, declining from 70.6% in 2016.37
9A SYSTEMS APPROACH TO HOMELESSNESS
Alberta has over 20,000 community services in operation addressing homelessness, poverty, mental illness, addiction, domestic
violence, poor health, childhood trauma, and much more, with little to no mandate to coordinate or integrate these services at a
broad strategic level. Medicine Hat has developed some integration and coordination models over the past decade, but still has
room for growth in systems integration. When we consider the social safety net as a service to be delivered, one of the often-cited
root causes behind the persistence of social issues such as homelessness, violence, and poverty is the lack of integration among
stakeholders, policies, government, community members, agencies, and other service providers.38 Integration can exist on multiple
levels, including dimensions of structures, processes, leadership, and interpersonal collaboration.39 In the homeless serving sector,
systems are found to be most effective when there exists shared policies and protocols, shared information, and coordinated service
delivery and training.40
Taking a systems approach to social issues means that challenging the status quo and positively disrupting systems is a priority.
It requires new and innovative applications and approaches to improve efficiencies and optimize service delivery, while making
transformational changes to the way we impact community. While system planning is a recognized best practice critical to ending
homelessness, it can be exceptionally challenging to implement community wide. Based on a review of promising approaches to
system planning, several key elements have been identified as necessary to its successful implementation.41 This includes:
1. Common policies and protocols, shared information;
2. Coordinated service delivery and training;
3. Having staff with the responsibility to promote systems/service integration;
4. Creating a local interagency coordinating body;
5. Centralized authority for homeless-serving system planning & system coordination;
6. Co-locating mainstream services within homeless-serving agencies and programs;
7. Adopting and using an interagency management information system.
Medicine Hat is well known for its use of data and the coordination of services across the community because the community
recognizes that without this high level of integration across sectors, there is limited success. Planning and integration strategies
that the CBO currently operates from can be found in the Priority Section.
Did You Know?
The approximate cost of homelessness on public systems in Canada (per individual) is estimated to be between $66,000 -
$120,000 CAD annually. Miniscule in comparison, the cost of providing housing with support is only estimated to be between
$12,000 - $34,000 CAD each year.42 Demand-wise, in 2021, it was estimated 69 people were experiencing homelessness in
Medicine Hat,43 35 of which were emergency sheltered (at the Salvation Army Centre of Hope, the Medicine Hat Women’s
Shelter Society, and McMan Roots Youth Shelter) and 34 provisionally accommodated (AHS, corrections, treatment, transitional
housing). This put Medicine Hat at a rate of 11 people homeless per 10 000 population.44
Medicine Hat joined the Canadian Alliance to End Homelessness’s (CAEH) 20,000 Homes Campaign, now called Built for Zero
Canada45 in June 2015 and set a chronic46 active homeless baseline of seven people and a chronic active homeless threshold for
functional zero (three people). As of April 2021, there were three people on the chronic active homeless list, however the
community achieved the status of functional zero on numerous occasions since 2015.47 Medicine Hat is considered one of the
first cities in Canada to end homelessness at a functional zero level, largely due to its systems planning approach. The
“Functional Zero” approach describes the situation in a community where homelessness has become a manageable problem.
That is, the availability of services and resources match or exceed the demand for them from the target population.48
10Overview
To ensure that an end to homelessness is sustainable, and that our system is continuously improving to enhance our capacity to
respond to homelessness, MHCHS will continue to support community partners to engage in system planning as this dialogue
unfolds and continue maintaining the success we have collectively achieved.
The following section highlights the impact of housing first program in community from the inception of the Plan April 1, 2009 to
March 31, 2021. Of note, it does not include services, including individuals housed by non-housing first programs.
Age
10 9
1,323 Individuals Housed 162 200
328
995 Adults 303
Children 311Shelter system
Medicine Hat has three (3) shelters: The Medicine Hat Women’s Shelter Society, a 30-bed shelter that serves adults and children
experiencing family violence, The Salvation Army Centre of Hope, a 30-bed shelter that serves adults, and McMan Roots Shelter,
a 6-bed shelter that serves youth (under 18).
Historically, the adult shelter has been used by those experiencing homelessness in community as a place to reside, not for
emergency situations. This trajectory changed in Medicine Hat with the implementation of our Plan and the various services that
are offered in community; however, we are seeing the re-emergence of this trend where individuals have become accustomed to
and comfortable in shelter, thus using it as residence.
1400
Community Shelter Utilization 2008-2021
41% ↓ Shelter Utilization
compared to 2019.
1200
Indivduals Homeless
64% ↓ Shelter Utilization
1000
800
600 since 2008.
400
2021-2022 will focus on shifting all shelters to being
200
housing-focused shelters, to assist with the transition
0
2008- 2009- 2010- 2011- 2012- 2013- 2014- 2015- 2016- 2017- 2018- 2019- 2020- of people into permanent housing options, otherwise
2009 2010 2011 2012 2013 2014 2015 2016 2017 2018 2019 2020 2021
Adults 869 811 768 606 702 539 462 673 580 545 514 563 309 requiring them to use the housing allowance of their
Including Children 1147 1036 1009 780 849 709 635 890 746 678 632 704 414
income benefit on shelter.
Hostel Model
There are a number of individuals identified at the community level that, despite being offered services, continue to not engage with
the system of care. More specifically, these individuals utilize the shelter, receive income support benefits, and are making the
choice to continue utilizing public services over getting housed with supports. A hostel model would alleviate this issue with long-
term emergency shelter occupants as they would be required to use the housing allowance that forms part of their income support
benefit to stay in the shelter. Those individuals that are just passing through, or that want to engage with the system of care will not
be required to pay for the shelter but instead will be directed to the right program or service.
Further, shifting to a hostel model would alleviate some other problems associated with homelessness. Individuals might prefer
privacy and quiet surroundings to the uncertainty that comes along with a night in the emergency shelter; as such, during the
summer months they might decide to sleep outside or build encampments. Having a hostel would mean privacy and quiet as rooms
are private – only facilities are shared – which could encourage people to access this shelter instead of sleeping rough.
24/7 Shelter Model
Currently, there is an emergency shelter that is open from 7:30 pm to 7:30 am and a day shelter that is open from 7:30 am to 6:30
pm. Instead of having two different programs requiring funding and staff to run, having a 24/7 shelter could combine these two into
one effective, well-functioning shelter. It would mean individuals looking to access services no longer have to keep track of when
to go to which shelter, what the hours are, or what services are available at each shelter. Individuals will have one shelter that is
available to them at any point during the day and know that any service or resource they might need would be available to them
there (or someone would be available to direct them to where they can access what they need). The 24/7 shelter will have a
housing-focused philosophy to ensure that individuals accessing it are made aware of the supports available to them to get them
out of homelessness.
12Program Exits
The rate of exit and whether that exit is deemed successful is Exits from Housing First Program 2009-2021
an important element not only from an outcomes-based Data Review and 887
Total Exited in Period (18+) 921
perspective, but also a systems-planning perspective. The (excludes deaths)
Reported Reason for Exit # % of total Positive Negative
CBO undertakes a full review of exits from the housing first
Successfully Completed 603 65% 603 0
programs and looks for indicators that give insight into quality Unknown/Disappeared 71 8% 0 71
of delivery. Referred to Another Program 15 2% 13 2
Other 30 3% 21 9
The chart on the right shows the total number of exits from the Moved Out of Service Area 12 1% 6 6
Incarceration 31 3% 0 31
housing first program since inception in 2009. The total Death 34 4%
number of people exited from the program is 921, including Chose to Discontinue Program 125 14%
74 51
34 deaths. Of the total individuals exited, 65% graduated the Total 921 100%
717 170
81% 19%
program based on the stated definition of “graduation”.
However, a review of all exits through file review and direct follow-up with past service participants, (when possible) demonstrates
that not all exits that are initially classified as “unsuccessful” are. The chart includes the CBO’s classification of all exits from
program.
Living Arrangements of Positive Exits From Program
58%
21%
19% 81%
8%
13%
Negative Exits Subsidized Housing Market Housing
With Friends/Family Other
Graduate Rental Assistance Initiative (GRAI)
The Graduate Rental Assistance Initiative (GRAI) was developed for graduates of Housing First programs who have achieved
housing stability and require minimal financial support in order to maintain tenancy. The GRAI program is administered through the
Homeless and Housing Development Department at the Medicine Hat Community Housing Society (MHCHS). The GRAI program
is not a long-term guaranteed subsidy.
$200,000 = Amount of OSSI funds allocated for the GRAI program 2021-2022
Public System Impact
Year after year, the data from Medicine Hat confirms that it is less costly to provide appropriate housing and support to a person
experiencing homelessness than maintaining the status quo approach that relies on emergency and institutional responses. The
following charts demonstrates the impact that housing first has had on reducing public system use, and therefore the costs
associated with use.
13The chart below reflects data from 2020 to 2021; and includes systems interaction data for the 33 adults served in the housing first
programs during this time frame. Note the reduction in all utilization, versus that experience from 2009-2021.
Utilization of Public Systems in Housing First (2020-2021) n=33
Intake In Program Reduction/Increase
Days in Hospital 445 16 -96%
EMS Interactions 36 11 -69%
Days in Jail 589 75 -87%
Court Appearances 56 19 -66%
Note: The data represents 100% of individuals housed through the housing first programs and who have exited the program (successful & unsuccessfully) and those who remain in the program.
Assessments are completed with each individual at 3-month intervals and spans the duration of time they are in program.
96% ↓ days in
hospital 69% ↓ EMS
interactions 87% ↓ days in
jail 66% ↓ court
appearances
The chart below reflects data from reflects data from 2009 to 2021; and includes systems interaction data for the 995 adults served
in the housing first program to date. An increase in court appearances might appear to be a negative outcome; however, an increase
in court appearances means that individuals are being more responsible showing up to their hearings, and as such have a decrease
in jailtime.
Utilization of Public Systems in Housing First (2009-2021) n=995
Intake In Program Reduction/Increase
Days in Hospital 9,692 6,592 -32%
EMS Interactions 1,007 1,159 +15%
Days in Jail 20,100 6,704 -67%
Court Appearances 1,701 2,303 +35%
Note: The data represents 100% of individuals housed through the housing first programs and who have exited the program (successful & unsuccessfully) and those who remain I the program.
Assessments are completed with each individual at 3-month intervals and spans the duration of time they are in program.
32% ↓ days in
hospital 15% ↑ EMS
interactions 67% ↓ days in
jail 35% ↑ court
appearances
Point-in-Time Count (PiT Count)
The 2021 PiT Count was altered due to COVID-19. On April 20, 2021, Medicine Hat conducted their biennial Point-in-Time Count
(PiT) of homelessness. Using administrative data from service providers operating emergency shelter, shelter for those fleeing
family violence, transitional housing, and treatment/stabilization facilities, Medicine Hat has enumerated homelessness as follows:
14MHCHS PROFILE
The purpose of the Medicine Hat Community Housing Society is to provide access to affordable housing and supports.
Established in 1970, the Medicine Hat Community Housing Society is a charitable organization under the Societies Act, a Housing
Management Body established by Ministerial Order under the Alberta Housing Act, and the Community Based
Organization/Community Entity for Medicine Hat established to coordinate initiatives in the community dedicated to ending
homelessness.
MHCHS has two (2) core business functions:
1. Housing Programs
MHCHS has been established as a “Housing Management Body” (HMB) by Ministerial Order; a HMB is established for
the purpose of administering social housing programs for the government under the Alberta Housing Act.
2. Homelessness Initiatives
MHCHS has been established as the Community Based Organization (CBO) and Community Entity (CE) for Medicine Hat,
charged with leading and implementing the local Plan to End Homelessness. A CBO (provincial) and CE (federal) is
established for the purposes of administering funding from these respective jurisdictions, targeted to initiatives aimed at
ending homelessness.
Organizational Structure
The MHCHS Board of Directors is a governance board comprised of 11 members as described in the Ministerial Order. The Board
governs in accordance with the Society Bylaws and provides policy and planning direction to the Chief Administrative Officer (CAO).
A number of standing and working committees, which include valuable community allies with similar goals and objectives, support
the work of the MHCHS. Advocacy is also a primary function of the Board.
The CAO is responsible for conducting and overseeing all aspects of the business of the Society and reports directly to the Board
of Directors, with a staff of 32 FTE employees. The organizational chart below provides a visual of the structure.
Board of Directors
(11)
Chief Administrative
Officer
(1) Executive Assistant
Homeless and Housing Housing Programs Facility Operations
Finance Manager Outreach Manager
Development Manager Manager Manager
(3) Employees (1) Employee (9) Employees (9) Employees (5) Employees
Housing Programs
In the Housing Management Body capacity, the MHCHS manages operational budgets of roughly $5.7M, which fluctuates
depending on the priorities and programs in a given year.
15The table below provides a breakdown of the Social Housing and Affordable Housing Programs within the MHCHS property
portfolio; this includes information on units that are owned by the City of Medicine Hat, the Province of Alberta, and the Medicine
Hat Community Housing Society.
Social Housing Programs Affordable Housing Programs
Family and Special Needs Units Affordable Housing Units
City of Medicine Hat Owned 18 MHCHS Owned 85
Province of AB Owned 205 City of Medicine Hat Owned 32
Seniors Self-Contained Units 229 Transitional Units MHCHS Owned 7
Rent Supplements 386 Private Affordable 13
Permanent Supportive Housing 30
Total Social Housing Program 838 Total Affordable Housing Program 167
1,005 = total housing portfolio at March 2021
Leading the Plan to End Homelessness
Systems planning requires a different type of leadership at the community level. The Medicine Hat Community Housing Society is
the Systems Planner Organization leading the work to prevent and end homelessness in Medicine Hat. In this function, it is
recognized as the Community Based Organization (CBO) for provincially-funded homelessness initiatives and the Community Entity
(CE) for federally-funded homelessness initiatives in Medicine Hat. The function of the CBO and CE falls under the Homeless &
Housing Development Department (HHDD). As noted in the chart on the previous page, this department operates with a Department
Manager, and three staff; the Homelessness Initiatives Coordinators (please see Appendix A for Job Descriptions).
MHCHS work to end homelessness in Medicine Hat is guided by At Home in Medicine Hat: Our Plan to End Homelessness. MHCHS
works with the Community Council on Homelessness (CCH), who is the local organizing committee responsible for setting direction
for addressing homelessness in our community. It identifies priorities through a planning process, determines which projects should
be implemented to address those priorities and reports back to the larger community on the efforts made and results achieved in
preventing and reducing homelessness.
The CBO/CE has grown in its role as a steward of public funds and system planner at the community level to meet the following
key roles of a lead organization:
1) Systems Planning & Integration: Work cross-ministry to develop, implement, coordinate and evaluate the system of care
and disrupt systems when needed (Health, Justice, Education, Children’s Services, Seniors and Housing).
2) Local Decision Making: The cost savings and efficiency of this approach have been clearly demonstrated, and government
support for local autonomy in backbone entity-driven system planning along with the provision of resources and enabling
policy is critical. Community decisions about community outcomes.
3) Community Development & Leadership: Consult and engage with diverse stakeholders to support implementation; targets
capacity building initiatives, including comprehensive training and technical assistance for the sector.
4) Fund Administrator: Manages diverse funding streams to meet community priorities, compliance, program and system
performance management, evaluation, and reporting requirements to funders. Investing in services with proven integration
and sustainability.
5) Coordination of Data Management: Oversight and implementation of the shared data collection system. Analysis to help
make data-informed decisions to determine services and create system efficiencies.
Through implementation of these activities, the MHCHS has become a nimble decision-maker that uses data and available
information to effectively coordinate the Homeless-Serving System. The MHCHS has the capacity to draw on HMIS data to monitor
emerging trends in program participant needs, and program outcomes to trouble-shoot and adjust its approach in real-time. This
enables more effective use of resources and improved outcomes for program participants.
16CBO/CE DECISION MAKING PROCESS
The CBO/CE initiates many consultations in both large and intimate settings with key stakeholders in community including:
Community Council on Homelessness (CCH), individual conversations with CCH representatives, service providers, front line
workers, landlords and property management companies, the City of Medicine Hat and local MLAs. MHCHS has a reputation for
highly regarded consultative approaches and processes around housing and homelessness. This extends beyond our community
into other jurisdictions, both provincially and nationally.
The Request for Proposals (RFP) Process
For the 2021-2022 funding year, the CBO decided to evaluate existing programs and services and make funding recommendations
based off the outcome of the evaluations. It was decided that only one of the existing programs would have a decrease in funding.
The available funding has been provided through the Government of Canada’s Reaching Home (RH) Strategy – Designated
Communities, and the Government of Alberta’s Provincial Outreach Support Services Initiative (OSSI).
The Ministry of Community and Social Services through the Outreach Support Services Initiatives invests a significant amount of
funding into efforts to optimize systems and reduce the impact of homelessness in Alberta. This investment has been critical to the
systems responsiveness to vulnerable populations, with communities experiencing varying degrees of success.
In 2019, the Homelessness Partnering Strategy (HPS) was replaced by Reaching Home: Canada's Homelessness Strategy. The
Government of Canada’s Reaching Home (RH) Strategy supports communities to develop local solutions to homelessness. The
renewed RH allocates funding, with the goal of supporting communities in developing longer-term solutions to homelessness and
moving to a systems-planning approach, prioritizing Coordinated Access, reducing chronic homelessness, and preventing future
homelessness. The RH strategy recognizes the importance of Housing First principles but is also encouraging communities to
invest in prevention.
In March 2021, the Proposal Review Committee met and provided their recommendations to the Community Council on
Homelessness. These recommendations were approved on March 12, 2021 and subsequently approved by the MHCHS Board of
Directors at the March 23, 2021 meeting. There were no appeals received as part of the 2021-2022 RFP process and all
recommended services entered into contract.
Community Accomplishments & Challenges
Accomplishments
1. CBO Increase Capacity – The CBO increased its capacity by hiring three additional staff – two full-time, permanent staff
members and one full-time, temporary staff member.
2. COVID-19 Response for Vulnerable Populations – The CBO, in partnership with AHS and community partners, took
the lead in overseeing and implementing the Strategy for Vulnerable Populations throughout the pandemic response. The
establishment of both a Daytime Shelter and Self-Isolation Units made up a big part of the COVID-19 response for the
vulnerable population in Medicine Hat.
3. Systems Transformation Project – The Medicine Hat Systems Transformation Project has been expanded nationally
and internationally and received additional funding from CMHC. The outcome of this project will be to better equip housing
stakeholders with practical solutions that will support a culture of innovation by fostering partnerships, creating and
disseminating real-world data for evidence-based decision-making, and reducing the amount of replication from different
partners in the homeless-serving system.
4. Completion of Housing Strategy – The CBO completed the housing strategy, which will form the basis of goals and
funding going forward.
175. Continuation of Systems Improvements
a. Completion of Org Code Consulting Evaluation/Review – The CBO and its programs were evaluated by Org
Code Consulting, who put forth recommendations for improvement and areas to be focused on in the coming
year. Some recommendations have already been implemented while the others are in the process of being
incorporated into the CBO and programs.
b. Implementation of Org Code Consulting Recommendations: The CBO and its programs started implementing
some of the recommendations put forth by Org Code Consulting, including the renaming of Central Intake to
Housing Link and the creation of the Rapid Resolution component. Rapid Resolution is Diversion and Rapid
Rehousing merged into one program that focuses on diverting people to different services they are in need of, or
re-housing individuals as efficiently and timely as possible. Further, work is actively being done to progress
towards a 24/7 shelter and hostel model in the community, as conversations are being facilitated with the city,
CBO programs, and community partners.
Challenges
1. COVID-19 – The pandemic has created the most challenges in terms of service delivery in the past year and has
highlighted the need for continued community collaboration and integrated service delivery. Medicine Hat community
partners and systems operate with a high degree of sophistication, and thus strategies of response have been highly
effective prior to, during the height of, and will continue on to the recovery stage of COVID-19.
2. System Fatigue – There is a generalized and shared sense of “systems fatigue” and frustration among leaders and front-
line workers in the social sector, stemming from the constant burden of unmet expectations, underperforming systems,
and redundancy. Mitigation mechanisms exist, such as client advocates and over-reliance on personal and professional
connections, however clients should not have to rely on mitigation mechanisms. Unfortunately, relying on mitigation is
easier than equipping staff with the tools they need to do their work effectively. Workers need to be able to trust that the
system will do what it should do and not have to deal with the effect of it not doing so. Instead, the system should be set
up to perform in a way that removes the need for “band-aid” solutions to deeper problems. Systems fatigue is not burn-
out, however, it can understandably lead to feelings of burnout.
3. Opioid Crisis– The opioid crisis has been front and centre in our community, as is the case across Alberta. The response
from the CBO and CCH has been to support recovery focused initiatives, including a partnership with AHS for a
Recovery/Stabilization project (nine beds) to support individuals that have detoxed and awaiting treatment and those that
are transitioning out of treatment.
4. Institutional Care – Through the 2019/2020 community engagement process, it was identified that there is a need for
institutional care options for those individuals that cannot be adequately served through the existing system of care.
Typically, these individuals present with significant and unmanaged behavioral issues that impact their housing stability.
They are also typically medication non-compliant, thereby exasperating the presentation of their symptoms and
behaviours. The level of acuity and need that these individuals present with are not conducive to sustainable support under
current model of housing first, including PSH. The need for a specialized health response is required for these individuals.
18CBO/CE PRIORITIES
Based on the learnings to date, best practices research, and community input, the following key strategic directions will continue
to guide us to maintain our vision:
1. Continue the full-scale implementation of the system planning approach in Medicine Hat.
2. Create efficiencies and optimize service delivery.
3. Progress systems integration and invest in strategies that are innovative and show promising results.
4. Increase the use of technology into service delivery, monitoring, and evaluation.
5. Use data and research to improve and refine our approach.
Priorities for the 2021-2022 fiscal year:
1. Complete community engagement and operational modelling for the development of 24/7 emergency shelter and hostel.
2. Support the development of integrated community response for those with persistent mental health and addictions in
community with AHS, MHPS, and community partners.
3. Develop and support the development of housing based on Housing Strategy recommendations.
4. Actively engage with the City of Medicine Hat and community partners to continue excellence in service delivery.
5. Continue to lead COVID-19 Community Planning Response for vulnerable populations.
6. Develop and Communications Strategy including community education.
Priorities for the 2022-2023 fiscal year:
1. Continuation of delivery and execution of priorities for the 2021-2022 fiscal year
2. Transition community to 24/7 shelter and hostel model, and work towards social enterprise component.
19Project Fund Allocation Plan
1. Existing Projects to Continue
STRATEGIC SERVICE CLIENTS TO TOTAL PROJECT AMOUNT OF
PROJECT TARGET CLIENT EXISTING
AREAS OF PROJECT CLASSIFICATION PROVIDER NEW CLIENTS GRADUATE BUDGET CARRYOVER
NAME GROUP CLIENTS
INVESTMENT NAME 2021-22 REQUESTED ALLOCATED
Housing Chronic & Episodic
ICM Housing First MHWSS 36 30 15 $500,000
Supports Homeless
Chronic & Episodic
PSH PSH Program CMHA 32 20 0 $970,000
Homeless
Rent Supplement/Graduate
Homeless
Rental Assistance Initiative GRAI CBO HF Graduates 45 20 n/a $136.772 $63,228
Prevention
(GRAI)
400 assessed
------------------
Chronic & Episodic
Outreach Support, Triage, 250 Rapid
Housing Link MHCHS Homeless & those at n/a n/a $304,154
Assessment, and Diversion Resolution
imminent risk
10 Housing Loss
Prevention
Connection to Youth Hub Homeless youth and at
Outreach Support, Triage,
Long-Term Outreach McMan risk of becoming 64 150 n/a $315,774
Assessment, and Diversion
Solutions Services homeless
Adults 18+ who have
Lynx House
completed detoxification
Short-Term Supportive Housing Recovery/ McMan 5 15 n/a $280,780
program and residential
Stabilization
treatment program.
Roots Youth
Shelters McMan Homeless youth 4 30 n/a $200,000
Shelter
Addictions
Supports to Assist Other
Counseling Miywasin At risk of homelessness 75 n/a n/a $85,400
Program Activities
Program
Supports
Community
Support to Assist Other Activities CBO Service Providers n/a n/a n/a $50,000
Capacity Building
Chronic & Episodic
Centralized
Support to Assist Other Activities CBO Homeless & those at n/a 10 n/a $20,927
Support
imminent risk
Existing Projects to Continue Total Cost: $2,926,108
202. Existing projects to be discontinued
TOTAL
STRATEGIC SERVICE EXISTING CLIENTS TO AMOUNT OF
PROJECT TARGET CLIENT EXISTING PROJECT
AREAS OF PROJECT NAME PROVIDER CLIENTS TO BE GRADUATE CARRYOVER
CLASSIFICATION GROUP CLIENTS BUDGET
INVESTMENT NAME TRANSFERRED 2021-22 ALLOCATED
DISCONTINUED
Drop-in and The Salvation Homeless and at risk of
Drop-In n/a n/a n/a $70,000
Warming Centres Army homelessness
Housing Chronic and Episodic
Rapid Re-Housing Rapid Re-Housing MHCHS n/a n/a n/a $124,334
Supports Homeless
Existing Projects to be Discontinued Total Cost: $194,334
21Schedule A Approved Purposes
OUTREACH AND SUPPORT SERVICES INITIATIVE
APPROVED PURPOSE
SCHEDULE A
This is Schedule “A” to an Agreement with an Effective Date of April 1, 2021 between Her Majesty the Queen in the right of the Province of
Alberta as represented by the Minister of Community and Social Services (CSS) and Medicine Hat Community Housing Society (the
“Recipient”) and forms part of that Agreement.
Project Classification: Outreach, Triage, Assessment, Diversion
Project Name(s) and/or Service Provider(s) Name:
A. Youth Hub Outreach – McMan Youth, Family and Community Services Association
B. Housing Link – Medicine Hat Community Housing Society
Project Address(es) and/or Service Provider(s) Address:
A. #4, 941 South Railway Street SE
B. #104, 516-3rd Street SE
Approved Purpose:
A. Youth Hub Outreach – McMan Youth, Family and Community Services Association supports community-based youth aged 12-24 that are
at risk of becoming homeless due to family conflict as well as those currently homeless or staying in the youth shelter. Appropriate
housing/re-housing of the youth, as well as support to the family to promote family reunification is the focus of this program. Those
individuals requiring assessment for housing first based service interventions will be referred and/or accompanied to Housing Link for
services.
B. Housing Link – Medicine Hat Community Housing Society Outreach Department serves as the coordinated access system into housing
first programs in community. Housing Link assesses the housing and support needs of individuals and families that are homeless or at
imminent risk of becoming homeless, including those being transitioned and/or discharged into homelessness from community-based
Provincial or Federal systems/facilities, including corrections, treatment, hospital, and child welfare, using the SPDAT. Upon completion of
the assessment, a referral to the most appropriate program is made.
Rapid Resolution redirects individuals from housing first programs to more suitable, less intensive services that will meet their needs.
Individuals offered Rapid Resolution do not require the duration or intensity of existing case management services through housing first
programming. The role of the Housing Link worker is to assist individuals establish housing security through the provision of brief, client
focused, direct hands-on intervention and support.
Housing loss prevention efforts focus on providing one-time financial assistance for individuals and families who have an active Notice to
Vacate due to non-payment of rent for a one-month time period. To be eligible, the individual or family is required to have a verified 6+
month sustained rental history, do not require any case management or additional support services, and have explored other options for
rental arrears payment. Payment for rental arrears shall be paid directly to the landlord and/or property management company.
Monitoring and Evaluation:
Alberta Community and Social Services (CSS) has a mandated duty to promote strong and vibrant communities and to focus funding where it
will make a real difference. In order to assess the impact of its funding, the Ministry has adopted an outcomes-based approach requiring that
the Recipient deliver, through the Funded Project, measurable changes and/or improvements to the intended Beneficiaries of this Approved
Project. The progress must be demonstrated through evidence of the difference the interventions are making to those Beneficiaries.
Inputs:
A. Youth Hub Outreach – McMan
1. CSS funding: $315,774
2. Carryover allocation: n/a
3. CSS Addictions and Mental Health Funding: n/a
4. Other sources of funding: n/a
5. Staffing: 3.5 FTE
6. Target client group served: community based homeless youth, youth at risk of becoming homeless, and their families.
7. Efforts to Outcomes data collection: No. Excel data spreadsheets will be used for data collection.
22B. Housing Link – MHCHS
1. CSS funding: $304,154
2. Carryover allocation: n/a
3. CSS Addictions and Mental Health Funding: n/a
4. Other sources of funding: RH $391,512
5. Staffing: 4.50 FTE
6. Target client group served: All
7. Efforts to Outcomes data collection: Yes
Program Activities:
A. Youth Hub Outreach Service – McMan Youth, Family and Community Services Association
1. Outreach to community-based homeless youth, crisis sheltered youth aged 12-24.
2. Provide support to youth to promote family reunification, housing and/or rehousing.
3. Provide youth with opportunities for skill-building in areas like budgeting, tenancy skills and life-skills.
4. Appropriate case management and follow-up supports that is client centered and rooted in harm reduction.
B. Housing Link – MHCHS
1. Complete assessments (using SPDAT) for individuals seeking services in the community, at the shelters, hospital, remand, and in-
office as required.
2. Referrals to appropriate program and/or community-based supports.
3. Facilitate file and warm transfers to receiving programs.
4. Manage community waitlist for Housing First, and Rapid Re-Housing.
5. Assist individuals with diversion efforts including financial and non-financial avenues.
6. 3-month follow-up with individuals assisted through Housing Link to be housed or stabilized in their housing.
7. Advocate with landlords, and system providers (i.e. AISH, AB Works, Corrections, Health, etc.) to promote successful housing stability.
Outputs:
A. Youth Outreach Worker – McMan Youth, Family and Community Services Association
1. 150 new clients (homeless or at-risk youth) will be served by this program.
2. 70% of youth will be reunited with their immediate or extended family.
3. 100% of youth who identify family reunification as a possibility will receive at least 1 common ground session.
4. Annually, a minimum of 12 education and information sessions will be provided.
B. Housing Link – MHCHS
1. It is estimated that 400 individuals will be assessed.
2. Program will report using the ETO data collection system.
3. It is estimated that 250 individuals will be assisted through diversion efforts.
4. It is estimated that 10 individuals will be served through housing loss prevention efforts.
Outcomes (Community and Social Services Mandated):
1. Those housed through the program will remain stably housed.
2. Those persons housed in the program will show a reduction in inappropriate use of public systems.
3. Those persons accepted into the program will demonstrate improved self-sufficiency.
4. Persons accepted into the program will demonstrate engagement in mainstream services.
Outcomes (CBO Mandated):
A. Youth Hub Outreach Service – McMan
1. Youth have increased knowledge of community resources, requirements of housing stability.
2. Youth have increased ability to develop goals and a service plan specific to their needs.
3. Family reunifications will be achieved through common sessions.
B. Housing Link – MHCHS
1. At any given reporting period, 85% of those assisted will remain permanently housed.
2. Number of individual returning for service and length of time between initial interventions.
3. Persons housed in the program will have a stable income source.
23You can also read