2021 Stock Market Outlook - January 2021 - Hamlin Capital Management
←
→
Page content transcription
If your browser does not render page correctly, please read the page content below
January 2021

                               2021 Stock Market Outlook

Contact Information:
Mark Stitzer
640 Fifth Avenue, 11th Floor
NY, NY 10019
Tel: 212.752.8777
Fax: 212.752.5698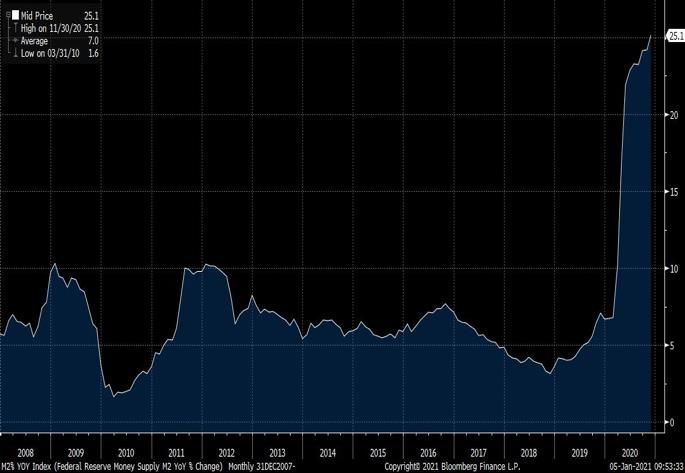
Introduction
As you know, we spend most of our time on individual security analysis. While some of these “bigger picture” musings
inform our company revenue forecasts and help us manage risk, we believe that accurately predicting what the
economy or stock market will do in a given year is all but impossible. We only share these macro thoughts to respond
to our institutional and individual clients’ frequent requests for a broader market outlook. To the extent that the
“known” risks discussed below or unexpected adverse developments send equities lower, expect us to focus on the
longer-term total return potential for a portfolio of quality, high-dividend yielding companies. With an eye on future
returns, we are likely to invest available cash in downturns and seize opportunities to swap into faster-growing
companies that meet our yield, balance sheet and return on capital criteria.

Equity Market Outlook
Ever forward-looking, stock prices are at all-time highs in the midst of Covid-related death and destruction. The prices
at the market low on March 23, 2020 anticipated three-hundred thousand pandemic-related Americans deaths, 12
million unemployed, and a 21.8% reduction in Wall Street earnings estimates for 2020. Today, trading above 22x
earnings estimates for 2021—well above the 16x average forward PE since 2000 and not far from the Dot Com Era
valuation peak—the stock market is focused on a new economic expansion. Since the 1980s, U.S. economic
expansions have lasted an average of 6.7 years during which corporate earnings have risen 65% on average from the
pre-recession peak.

Figure 1: Historical Earnings Growth During US Economic Expansions1

Applying an average 16x PE to $275/share in earnings—assuming a 70% peak-to-peak earnings advance off a base
of $161.73/share in prior peak 2019 earnings—suggest the S&P 500 Index is on its way to 4400.2 If this happens over
six years, the average expansion length, stocks will compound at a meager 3% annually. Applying an 18x multiple at
the next peak improves the compound annual growth rate to 5%. A six-year stretch of middling stock market returns
would bring the current stratospheric 13.89% 10-year SPX annual total return back to 9.29%, not far from the 9.55%
annual performance for stocks since 1928.

1
 For the EPS peak dates in years 1980, 1981 and 1989, only GAAP EPS were available. For Years 2000, 2007 and 2019, EPS is on an operating
basis. 1989 GAAP and operating earnings were nearly identical, lending integrity to the 2000 expansion EPS growth calculation.
2
 Although the median gain in earnings from prior peak through an economic expansion has been 66% since 1980, the average and median earnings
gains in the three most recent expansions have been 85.1% and 71.8%, respectively. Source Ned Davis Research; NBER.
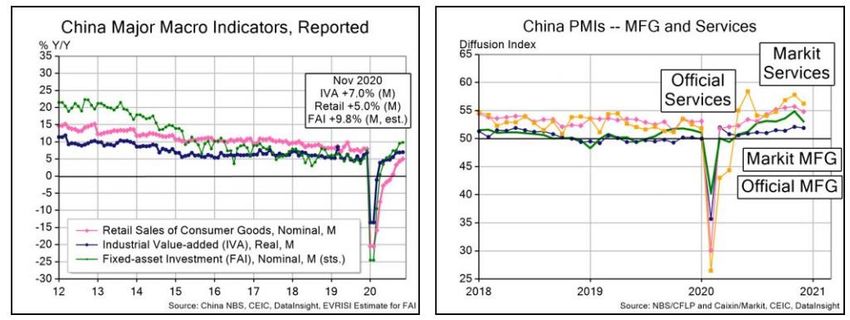
Economic & Earnings Tailwinds
The earnings growth contemplated above makes sense to us in the context of China’s experience and some visible
economic tailwinds at home. At the epicenter of the pandemic, China’s was the first economy to lock down and the
first to re-open. While the Western World’s handling of the virus was less efficient in part due to respect for individual
liberties, we believe that we will arrive at similar reduction in deaths and case counts—especially on the heels of
efficacious virus vaccine approvals. If that is the case, the charts below suggest that we should expect a rip-roaring
recovery.

Figure 2: Chinese Macroeconomic Indicators at or Above Pre-Covid Levels

Source: Evercore ISI

American consumers, representing approximately 66% of the nation’s economy, should be eager to spend as Covid
restrictions ease. We sense pent-up demand for a change of pace and scenery, and we believe that Americans can
afford to acquire discretionary items and services as consumer net worth soars to new highs. Home prices have risen
15% year-over-year and 401k account balances are at all-time records, historically reliable indicators of future
spending plans for the year ahead.3 The savings rate is also much higher than recent years, implying an ability to spend
beyond the pay check, and consumer debt levels appear generally healthy.

Figure 3: U.S. Savings Rate Remains Well Above 6.6% 20-Year Average

Source: Bloomberg

3
  Ed Hyman of Evercore ISI believes that consumer net worth leads GDP by two quarters. This econometric model suggests that the current 10.8%
increase in consumer net worth could add 1.5% to Q4 2020 GDP.
Beyond a vigorous consumer, the housing market looks strong with low mortgage rates, low inventory of homes for
sale, and healthy household formation. While only 10% of GDP, we are big believers in home building’s multiplier
effect on contractors, commodities, furniture, appliances, and data plans. It turns out that Millennials are much more
eager to wed, procreate, and buy houses than the pundits feared. Larry Mizel, CEO of home builder MDC, recently
explained, “The uncertainty surrounding Covid-19 pandemic has… in many ways increased home buying activity,
thanks to the growing importance of where and how we live. Homes increasingly serve as offices, classrooms, and
places for entertainment for the family.”4 We also remain upbeat about industrial activity as inventory levels remain
quite low relative to sales and some manufacturers decide to move production back to the United States. Finally, new
businesses are forming even faster than households. While new business formation is likely a function of Covid-
related bankruptcy filings, government payroll protection payments have clearly lifted entrepreneurial spirits well
above historic post-recession levels. Martin Mucci, CEO of payroll processor Paychex, recently said that he is seeing
“…a high 30s or 40% increase in new business start-ups. I think what you’re finding is people shifting in the pandemic
to new business opportunities…some have been laid off from other businesses and decided this is the time. Also
money is fairly easy to get ahold of at low cost.”5
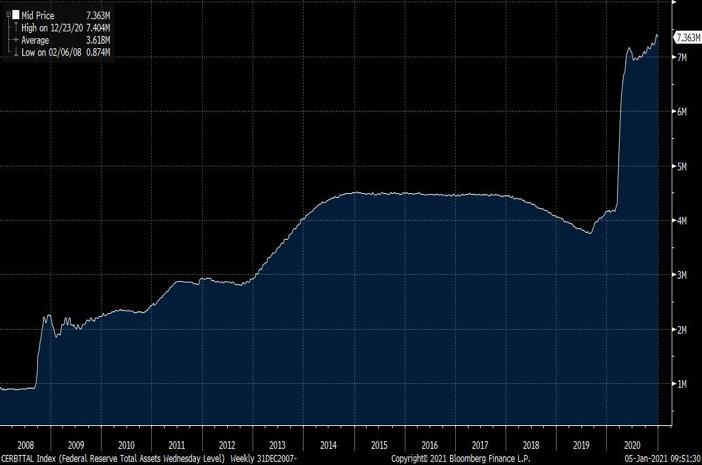
Above all else, our expectations for brisk GDP growth are anchored in the degree of monetary and fiscal policy
response around the globe. Cumulatively, we have spent 14.8% of the nation’s roughly $21 trillion annual gross
domestic product while simultaneously boosting the Federal Reserve balance sheet by $3.2 trillion through bond
buying programs. The charts below reveal the degree of stimulus relative to recent history. The money supply is
growing at a record-breaking 25% clip, more than double the growth rate following actions taken during the Global
Financial Crisis and subsequent European debt crises. These policy decisions affect the economy with a lag, likely
stimulating GDP well into 2022. There is more cash in the system to buy goods and services; more cash for companies
to invest in capital expenditures and acquisitions; and more cash for companies to return to shareholders in the form
of buybacks and dividends. Private equity firms and SPACs combined have $1.8 trillion of buy-out capacity.
Figure 4: Federal Reserve Balance Sheet and U.S. Money Supply Growth
Source: Bloomberg. Money supply shown is M2.
4
Factset. M.D.C. Holdings, Inc. Earnings Call Transcript Q3 2020, 10/29/20.
5
Factset. Paychex, Inc. Earnings Call Transcript Q2 2021, 12/23/20.Headwinds
The prospects for better business conditions discussed above alongside friendly financial conditions—rock-bottom
short-term interest rates, tight credit spreads, and a weak dollar—have stimulated investor appetites for risky assets.
Stocks and commodities are soaring. The individual investor has become especially bullish. Retail stock and option
contract volumes are elevated. The AAII bearish sentiment percent has plummeted to 21.9% from 50.0% a year ago.6
Bitcoin’s ascent, the popularity of SPACs, and the valuation of Tesla and newly public technology companies harken
back to Dot Com Era euphoria. At Hamlin, we like a wall of worry. Although approval of vaccines with better-than-
expected efficacy and stimulus bill resolution feel good, stocks tend to do better when investors are fearful. The table
below suggests that a lot of good news has been discounted. Equity price to earnings and enterprise value to EBITDA
ratios are elevated relative to history.
Figure 6: Stocks Appear Expensive Relative to Recent History
Source: Strategas, shown as of 12/18/2020.
While an uneven path towards herd immunity and Biden administration taxation proposals could disrupt investor
complacency, we are most concerned about a change in monetary policy in response to higher consumer prices. The
Federal Reserve, in adopting average inflation targeting, has effectively promised not to raise rates until inflation
reaches 3%. Money supply is growing at a nearly unprecedented 25% year-over-year clip.7 A weaker dollar should
lead to imported inflation as imported foreign goods appear more expensive,8 allowing domestic producers to raise
prices. To the extent that we bring national security-related manufacturing operations back from overseas, American
workers would be paid higher wages than Asian workers—a cost likely passed through in the form of higher prices.
Most importantly, we wonder about the impact of populist policies. On the back of cash handouts, GDP leapt 33% in
the third quarter. Seeing no evidence of negative repercussions in the financial markets, an additional $600/month
cash disbursement was signed into law two weeks ago. One easy way to address Covid-related and structural income
inequality: print and spend. Issue Treasuries to fund hand-outs to the most dis-enfranchised, spend on public work
projects like transportation-related and green infrastructure to drive employment, and pursue endless quantitative
easing to monetize the newly issued debt. We wonder how this would not be inflationary, and we think that is what
6
AAII Investor Sentiment Survey. https://www.aaii.com/sentimentsurvey. 12/31/2020.
7
Board of Governors of the Federal Reserve System (US), M2 Money Stock [M2], retrieved from FRED, Federal Reserve Bank of St. Louis;
https://fred.stlouisfed.org/series/M2, December 31, 2020.
8
The dollar has depreciated 12.8% from $102.98 on 3/20/20 to $89.84 on 12/31/20, according to the DXY Index. The DXY measures the value of
the U.S. dollar relative to a basket of top 6 currencies: EUR, JPY, GBP, CHF, CAD and SEK. Additionally, the dollar has weakened 9.7% versus
the yuan from 7.20 on 5/27/20 to 6.50 on 12/31/20.government leaders want. Should they get their way, the Fed may have to be less accommodating in the second half of 2021. Longer term, we still think that debt and demographics will hamper economic and corporate revenue growth. Elevated corporate debt levels should mean that companies eventually borrow less to buy back stock, make acquisitions, and invest in capital projects. High Federal and state debt levels could eventually lead to higher taxes, lower social security and pension payments, or both. Ironically, these structural overhangs could neutralize the inflationary pressures described above, preserving the equity-friendly Goldilocks backdrop. Should any of these headwinds materialize, the chart shown below suggests that the Hamlin equity portfolio may hold up pretty well during inevitable bouts of stock market weakness. Figure 8: Hamlin Has Outperformed in 25 of 27 Monthly Downturns of 5%+ Source: Hamlin Capital Management, Bloomberg Conclusion While tighter monetary policy in reaction to accelerating inflation is high on our list of longer-term concerns, heating up could be pleasant in the early going. Higher prices mean higher corporate revenues, and our company management teams would work hard to show operating leverage even as some of their costs escalate. Higher wages overall mean more discretionary income and more aggregate demand for goods and services. Problematic wage inflation appears unlikely with an 8.6% unemployment rate, and lower apartment and office rents could also keep the price indices at bay. We would welcome a measured walk towards a 2.5% inflation rate. Higher prices should support our company earnings while possibly capping PEs within the Tech and Internet sectors—areas to which Hamlin is less exposed than the S&P 500 Index—as discount rates adjust to higher inflation. The charts below suggest asset allocators appear to
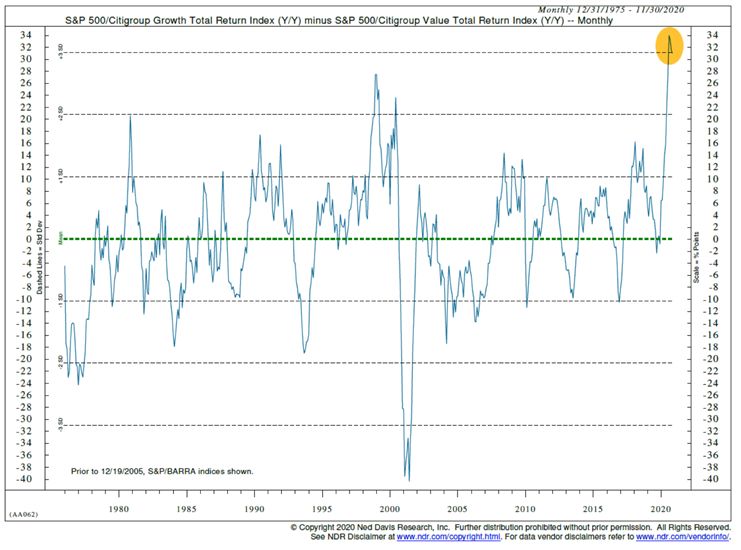
have few alternatives. Yield is scarce. Equities look better than bonds, especially with real rates likely to remain around
zero until the 10-year Treasury yield exceeds 2%. Value-oriented equities may be starting to claw-back ground relative
to the Growth stock-laden S&P 500 Index.

Figure 7: Yield is Scarce and Value Stocks are Trying to Turn

 6%

 5%

 4%

 3%

 2%

 1%

 0%
         Hamlin US Corporate         S&P 500       10 Year
          Equity  BBB Yield           Yield        Treasury
        Composite                                    Yield

             Current Yield      20 Year Average Yield

Source: Bloomberg, Hamlin Capital Management and Ned Davis Research
IMPORTANT DISCLOSURES:
PAST PERFORMANCE DOES NOT GUARANTEE FUTURE RESULTS. Investing, particularly in equities, involves
the risk of a loss of principal. Any projections, targets, or estimates in this report are forward looking statements and
are based on Hamlin Capital Management, LLC (“HCM”)’s research, analysis, and incorporate assumptions made
by HCM. All expressions of opinion are subject to change without notice and HCM undertakes no obligation to update
the statements presented herein. While HCM believes the sources of all data provided in this presentation are reliable,
HCM does not guarantee accuracy, reliability or completeness. Data is presented as of the date indicated and HCM
does undertake any duty to update the information presented here.
This document is provided for information purposes only and does not pertain to any equity security or bond product
or service and is not an offer or solicitation to buy or sell any product or service. Due to rapidly changing market
conditions and the complexity of investment decisions, supplemental information and other sources may be required
to make informed investment decisions based on your individual investment objectives and suitability specifications.
Clients should seek financial advice regarding the appropriateness of investing in any security or investment strategy
discussed or recommended in this report. Please refer to the attached Equity Only and Bond Only Composite Annual
Disclosure Presentations for further information regarding any performance results or comparisons shown in this
letter.
DEFINITIONS
- Discount rate refers to the interest rate used in discounted cash flow analysis to determine the present value
of future cash flows.
- Enterprise Value to EBITDA is a valuation measure calculated by dividing enterprise value by EBITDA
(earnings before interest, taxes, depreciation, and amortization).
- Gross Domestic Product is a monetary measure of the market value of all the final goods and services
produced in a specific time period, generally one year.
- M2 is a measure of the U.S. money stock that includes M1 (currency and coins held by the non-bank public,
checkable deposits, and travelers' checks) plus savings deposits (including money market deposit accounts),
small time deposits under $100,000, and shares in retail money market mutual funds.
- PE: The Price-to-Earnings Ratio or PE ratio is a ratio for valuing a company that measures its current share
price relative to its per-share earnings. The price-earnings ratio can be calculated as: Market Value per
Share / Earnings per Share.
- The Russell 1000 Value Index is a market capitalization-weighted index of the value segment of the 1,000
largest U.S. public companies.
- The S&P 500 Index is a market capitalization-weighted index consisting of 500 stocks chosen for market
size, liquidity, and industry group representation, with each stock’s weight in the Index proportionate to its
market value.Hamlin Capital Management, LLC
Equity Only Composite
Annual Disclosure Presentation
January 1, 2001 through September 30, 2020
Total Russell
Number Russell S&P
Firm Composit Composit Internal Composite 1000
of S&P 500 1000 500
Year Asset e Assets e Net Dispersio 3-Yr Value
Portfolio Return Value 3-Yr
s (mm) Return n St Dev 3-Yr St
s Return St Dev
(mm) Dev
*YTD
4,523 1,289 525 -8.38% 5.57% -13.35% N.A. N.A. N.A. N.A.
2020
2019 4,706 1,610 646 21.54% 31.49% 23.23% 0.55% 9.45 11.93 11.85
2018 4,253 1,504 688 -6.97% -4.38% -10.55% 0.64% 10.37 10.80 10.82
2017 4,553 1,772 683 15.84% 21.83% 10.90% 1.29% 10.27 9.92 10.20
2016 3,617 1,623 679 14.93% 11.96% 14.29% 1.26% 11.05 10.59 10.77
2015 3,186 1,373 725 -4.54% 1.38% -6.19% 0.66% 9.91 10.48 10.68
2014 3,077 1,414 704 10.93% 13.69% 10.85% 0.51% 8.57 8.97 9.20
2013 2,703 1,234 624 32.72% 32.39% 29.45% 1.04% 10.19 11.94 12.70
2012 2,029 798 480 11.03% 16.00% 14.46% 1.12% 12.39 15.09 15.51
2011 1,623 584 388 10.16% 2.11% -2.06% 0.71% 14.11 18.71 20.69
2010 1,033 191 220 20.65% 15.06% 12.88% 2.22%
2009 714 30 51 20.98% 26.46% 16.26% 2.69%
2008 584 12 30 -28.57% -37.00% -38.82% 4.45%
2007 734 18 31 3.97% 5.49% -2.65% 2.86%
2006 869 29 48 7.90% 15.79% 19.22% 5.93%
2005 716 31 42 20.80% 4.91% 4.43% 4.90%
2004 501 19 26 22.80% 10.88% 13.70% 7.67%
2003 130 8 24 30.40% 28.68% 26.74% 9.87%
2002 49 5 29 0.90% -22.06% -17.47% 6.15%
2001 21 6 34 0.99% -11.93% -100% 10.69%
* Performance represents a non-annualized partial period return ending on September 30, 2020.
Equity Only Composite consists of fully discretionary accounts that are comprised of any amount of common stocks and cash. There is no minimum account
size or time period to be included in the composite. Returns include the effect of foreign currency exchange rates. The exchange rate source for the composite
is IDSI/IDC – FT Interactive Data Corporation. The S&P 500 Index and Russell 1000 Value Index are provided as benchmarks. Benchmark returns are not
covered by the report of independent verifiers. The Russell 1000 Value Index was added retroactively on 10/1/2020.
PAST PERFORMANCE IS NOT INDICATIVE OF FUTURE RESULTS. Investing entails the risk of loss of principal. The U.S. Dollar is the currency
used to express performance. Returns are presented net of management fees and includes the reinvestment of all income. Net of fee performance was
calculated using actual management fees. The annual composite dispersion is an asset-weighted standard deviation calculated for the accounts in the
composite the entire year. Results are based on fully discretionary accounts under management, including those accounts no longer with the firm. Composite
performance is presented net of foreign dividend withholding taxes, where applicable, for the period prior to October 1, 2016, and gross of foreign dividend
withholding taxes thereafter. Composite performance accrues dividends starting October 1, 2016. The management fee schedule is as follows: 1.00% on all
assets. Actual investment advisory fees incurred by clients may vary. Composite performance is shown net of custodial fees for the period prior to January
1, 2018, and gross of custodial fees and other charges that may occur as a result of a client’s choice of service providers thereafter. Beginning 10/1/19, a
significant number of accounts in the composite are custodied with a broker that does not charge trading expenses. Accounts custodied with other brokers
may incur trading expenses which may reduce returns. As of 09/30/20 date, these accounts represent 23.45% of composite assets.
Hamlin is an independent registered investment advisory firm. Hamlin invests in fixed income and equities for separately managed accounts, as well as funds.
In January 2004, Hamlin merged with RRH Capital Management Inc. and the performance returns are linked. The firm maintains a complete list and description
of composites, which is available upon request. A copy of our current written disclosure statement discussing our advisory services and fees continues to
remain available for your review upon request.
The Equity Only Composite was created April 1, 2006. Hamlin claims compliance with the Global Investment Performance Standards (GIPS®) and has
prepared and presented this report in compliance with the GIPS standards. Hamlin has been independently verified for the periods January 1, 2001 through
December 31, 2008 by Ashland Partners & Company LLP. ACA Performance Services began verification for Hamlin on January 1, 2009 through September
30, 2020. Verification assesses whether (1) the firm has complied with all the composite construction requirements of the GIPS standards on a firm-wide basis
and (2) the firm’s policies and procedures are designed to calculate and present performance in compliance with the GIPS standards. The Equity Only
Composite has been examined for the periods beginning January 1, 2001 through September 30, 2020. The verification and performance examination reports
are available upon request. The policies for valuing portfolios, calculating performance, and preparing compliant presentations are available upon request.You can also read