2022 Annual Budget Adopted December 8, 2021 - Town of Milliken
←
→
Page content transcription
If your browser does not render page correctly, please read the page content below
2022 Annual Budget Adopted December 8, 2021
Table of Contents

          Content               Page
      Budget Message             3
       Budget Process            4
        Milliken Facts           5
      Town Clerk/Admin           6
   Community Development         7
           Finance               8
      Parks/Open Space          9-10
     Police Department          11-12
        Public Works            13-14
     Water/Wastewater            15
        Town Funds              16-18
    Board/Staff Directory        19
   Revenue/Expense Detail       20-31
                            2
TO: MAYOR AND MEMBERS OF TOWN BOARD
We hereby submit the Operating and Capital Budget for all funds for the fiscal year
beginning January 1, 2022.
The Budget represents one of the most important documents presented to the Town
Board. It is designed to reflect the goals and objectives of the Board and establishes an
action, operational and financial plan for the achievement of those goals and the delivery of
Town’s essential services. This Budget has been prepared to provide a comprehensive
overview of all Town funds and services, and to give residents a better understanding of
the Town’s operating programs. In today’s economic climate, every business and
governmental organization functions with a unique set of challenges and circumstances
based on its past decisions, current financial conditions, and the expectations established
by their customers and constituents. We believe this budget proposal reflects the same
well-planned, fiscally responsible approach to meeting these challenges that has served the
Town well for many years.
The Town’s residents deserve and insist on quality municipal services provided in a
productive, friendly, and efficient manner at the lowest possible costs. Our citizens also
need to feel confident that the Town is effectively planning for the future to ensure the
highest quality of life possible for the community. To meet this challenge, your Town Staff
and Department Directors have approached the budget process with thoughtfulness,
professionalism, and a sincere desire to meet the current and future needs of the Town.
Milliken, like many other municipalities in Colorado, is committed to providing excellent
service, maintaining the integrity of our infrastructure and property values, and
responsively attending to road repairs, public safety needs and expectations for the
provision of quality community amenities. We are also committed to maintaining a healthy
financial position so that we can be prepared for unexpected contingencies and maintain
superior credit ratings for our bonds. We continue to emphasize cost control, cost
avoidance, protection of infrastructure investments, increasing productivity through
continuous process improvements, growing our tax base through development, and
diversifying our revenues to protect our financial condition. At the same time, we are
paying attention to our human capital, our staff, and investing in them because the quality
and stability of staff dictates the quality and effectiveness of the service we provide.
In order to provide you, and other readers, a meaningful context to guide your review of
the 2022 Budget, we offer the following background and highlights:
3BUDGET PROCESS AND BASIS
The Town Budget
The Town provides a wide variety of services to 8,386 residents as per the 2020 Census.
Municipal services are financed through a variety of taxes, fees, charges for service, and
intergovernmental assistance. In order to plan for the delivery of effective services and
efficiently manage the revenues which support those services, the Town adopts a budget, or
financial plan. Direction for the budget comes from many distinct sources. State law provides
the basic legal requirements and timelines for the process. Board Goals and public input provide
the policy direction to respond to the needs of the community, and Town Staff brings its
professionalism and expertise in assessing the Town’s needs in accordance with these
directives. The fiscal year of the Town is the calendar year. The Town is required by statute to
adopt and appropriate a budget on an annual basis. The Town uses the modified accrual
accounting method for all funds except proprietary funds, which use the accrual method used
by private business.
Budget Process
The intent of the annual budget process is to provide an opportunity to reflect on the level and
effectiveness of providing for the present and future needs of the Town and then generate a
sound financial and operational plan to serve the residents of the community. As a statutory
Town, the Town of Milliken follows the State established time limits pertaining to the adoption
of the budget.
During the development of the budget, various department managers are called upon to
provide their experience and expertise in planning for, and meeting, the operational needs of
the Town. In addition, the Town Board provides guidance during preparation through goal-
setting meetings it convenes focusing on its objectives for the current year and beyond.
Revenue projections for the coming year are compiled to estimate the resources available to
provide for the Town. As a large portion of Town revenues currently come from property taxes,
the statutory limits on this revenue source are an important component of resource allocations.
Weld County provides an estimate of the Town’s valuation by the end of August and provides a
final valuation in December. The Town Staff then works to integrate the needs of required
operational service levels, the immediate goals adopted by the Board, and the future
investments required to fulfill the long-term visions adopted by the Board. The Town
Administrator’s budget recommendation is submitted to Town Board before October 15. The
recommended budget is made available for public inspection at this time. One public hearing is
held in November (for this year – November 10th). The budget and the annual appropriation
resolutions were adopted December 8, 2021.
4Milliken Facts
• Milliken was founded in 1910 and is part of Weld County, Colorado.
• Milliken is a statutory town that has a Board/Administrator form of government.
• The Town Board consists of six (6) Trustees who are elected for 4-year terms, and
a Mayor who is elected for a 4-year term.
• On November 4, 2001, voters within the Town approved the collection, retention
and expenditure of the full revenues generated by the Town commencing January
1, 2001, and subsequent years, notwithstanding the provisions of the TABOR
Amendment, which otherwise limits the growth in Town revenue.
• In 2018, voters approved a 0.5% sales and use tax continuation to fund capital
improvements. In 2006, voters approved a mill levy increase to fund a new Police
Station/Meeting House.
• Residential property is assessed at 7.15% of appraised value.
• Commercial property is assessed at 29% of appraised value.
• The Town/State has a combined sales tax rate of 5.4%.
• Milliken’s sales tax rate is 2.5% (one of the lowest in the region and in Weld County
for any community that assesses a sales tax).
• Milliken also has one of the highest mill levies.
TOWN ORGANIZATIONAL STRUCTURE
Town operations are organized into seven departments:
• Administration
• Community Development
• Finance
• Parks and Outdoors
• Police
• Public Works
• Water/Wastewater
5Administration
Mission Statement - “To provide customer service
to citizens, elected officials, and staff in the form of
information, ordinances, resolutions, minutes, and
record keeping, protecting the Town’s interest
through communication and public education.”
Departments
Town Clerk
The Town Clerk is responsible for the daily management of
Administration, Staff, Town Board and Municipal Elections.
Human Resources
This position is responsible for updating Job Descriptions,
employment advertising, scheduling interviews and
employee benefits.
Information Technology
This position is responsible for the Town’s information
services, which includes all computer systems and phone
services.
6Community
Development
Mission Statement: “To promote economic
development, quality growth, and a sense of
place for the Town of Milliken.”
Functions:
• Promote Economic Development
• Promote Infrastructure Development
• Provide Information and Data Resources
• Review and Process Land Use
Applications
• Facilitate and Coordinate Long Range
Planning
• Building Services Oversight and
Permit Processing
7Finance
Mission Statement:
“Protect the public interest through proper
custody and accounting of public funds, help
facilitate the achievement of the Town’s goals and
objectives through sound financial management,
timely financial reporting and to serve the public,
Town Board and staff efficiently and pleasantly as
valued customers.”
Functions:
• Maintain Accurate Financial Records
• Utility Billing and Payment Processing
• Safeguarding of Assets
• Grant Management
• Monitor Investments and Debt
• Collect and Record Receipts for Revenues
• Budget Preparation and Adherence to
Budgetary Restrictions
• Purchasing of Goods and Services
• Payroll
• Risk Management
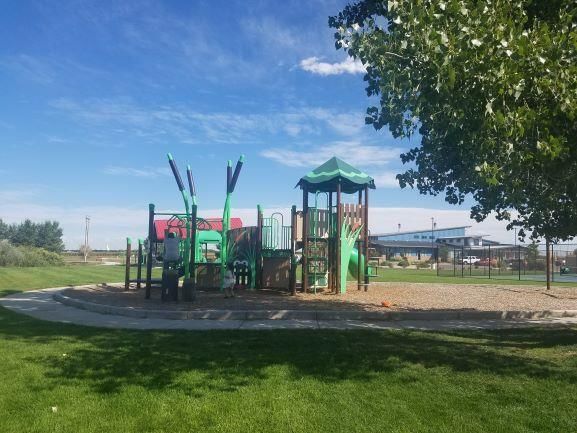
8Parks/Open Space
Department
Mission Statement – “To enrich the Quality
of life for everyone who lives, works in, or
visits Milliken through quality parks, open
spaces, and events.”
Vision Statement - We are dedicated to being established as
an essential and valued service in the community. To be
known for commitment to excellence and delivery of high-
quality recreation, services, facilities and parks.
Goals
To connect residents through parks and open spaces.
To provide residents, visitors and town personnel
opportunities to improve their health and fitness.
To offer parks, open space, and recreation amenities that
are diverse to the community.
9Parks & Open Space
Department (Continued)
West Side Parks
Mountain View Park 4.25 Acres (Non-Pot)
Fitness Park 1.02 Acres (Non-Pot)
Florence Park 1.78 Acres (Non-Pot)
FBC Park 1.53 Acres (Non-Pot)
Windmill Park .87 Acres (Potable)
East Side Parks
Ada Park .35 Acres (Potable)
Centennial Lake 13.06-7 Lake surface Acres (Non-Pot)
Sappington Park 13.37 Acres (Non-pot)
Ehrlich Park 17.6-12 Surface Acres (Non-pot)
Dog Park
South Park (open space behind Centennial Farms Subdivision) 7.5
Acres (Non-Pot) Irrigation not in use
Downtown Parks
Lola Park 2.40 Acres (Non-Pot)
Skate Park .41 Acres (Potable)
Sign Park .26 Acres (Potable)
Heritage Park .17 Acres (Non-pot)
Kids ‘n Cops Park (Non-Pot)
Right of Ways and Other
Greenbelt between Florence park and Fitness Park .80 Acres (Non-
pot)
Quentine Ave .64 Acres
Railroad ROW between Hwy. 60 and Alice
Along Hwy 60 ROW
Green Street Median
Walking Trail
Fireman Park .31 Acres
Public Works Shop .17 Acres (Potable)
10Police Department
Mission Statement – “To enhance the quality of life
within the Town by working closely with citizens in the
development and delivery of professional police
services.”
Department
Purpose
The purpose of the Police Department is to provide for the
safety and security of the community by upholding
democratic values, behaviors, and abiding by constitutional
safeguards. All officers will abide by the canon of ethics
promulgated by the International Association of Chiefs of
Police, and as adopted by the Police
Core Principles
The Department Principles and Values are the most
fundamental beliefs by which the department operates and
provides services to the community. These principles and
values serve as the foundation on which all services are
provided. The principles and values serve as guiding beacons
for determining a course of action when specific procedures
are not available.
11Police Department
(Continued)
Department Values
We respect life.
We believe in and respect Constitutional safeguards, laws
and democracy.
We will involve the community in all policing activities that
directly impact the quality of life.
We believe that while crime prevention is our primary goal,
we should vigorously pursue those who commit serious
crimes.
We are committed to treating everyone with courtesy,
respect and fairness at all times.
We are committed to managing our resources in a careful
and responsible manner.
We believe our employees are our most important assets
and will seek their input into matters that impact employee
job satisfaction and effectiveness.
We actively recruit and hire the best people; we recognize
and reward good performance; we train our people to reach
their potential.
We will maintain the highest levels of integrity and
professionalism in all our actions. We are committed to
meeting professional policing standards for the
organization.
We value diversity in the workplace and community.
The Police Department leads by example.
12Public Works Department
Mission Statement – “The town of Milliken is
dedicated to enhancing the safety, welfare and
livability of the community by providing and managing
infrastructure and service for parks and trails, streets,
water, storm water and wastewater. This mission is
achieved by several unique divisions working
together.”
Vision Statement - Our mission is to continue to be
providing effective service to enhance Milliken’s
current and future quality of life.
Goals
• Maintaining Town streets, alleys unimproved roads drainage and
storm water.
• Maintenance practices include but not limited to; crack sealing,
patching program, sidewalks and gutter pan repair, storm drain
inlet cleaning, roadway striping, ROW mowing, inspections, layouts
and surveying.
• Removing snow and ice during the winter season.
• Proving vehicle and equipment services for Town vehicles.
• Installing and maintenance of streets and roadways signage.
• Maintaining all Town facilities.
13Public Works
Department (Continued)
Overview
Maintenance
Street right-of-way infrastructure (snow plowing,
sweeping)
Buildings and equipment
Traffic devices
Parks and Open Spaces
Park operations, irrigation, maintenance
Natural resources forestry
Playgrounds
Community engagement
Water/Wastewater
Plant operations and maintenance
Bio-solids management
Technical services
Industrial source control, lab, sampling and flushing
Projects
Replace curbs and sidewalks around town
Storm-Water (repair or replace drain pans and storm
boxes)
Wastewater (repair and replace old sewer line)
Street (Patch and replace asphalt in some areas)
14Water/Wastewater
Department
Mission Statement – “We are committed to providing a safe,
reliable and regulatory compliant Water/ Wastewater Utility to
serve our citizens and preserve the environment.”
Water
W/WW Staff operate and maintain The Town of Milliken’s Reverse Osmosis Water
Treatment Plant(ROWTP). This facility includes and 0.7 million gallon per day Reverse
Osmosis (RO) system and a separate 0.31 million gallon per day Industrial Wastewater
Treatment Plant. The RO plant currently provides 200-acre feet of drinking water for the
town. The Industrial wastewater treatment plant consisting of a Frontier Water
Systems SeHAWK Bioreactor treat the RO concentrate prior to discharge to the Little
Thompson River. W/WW Staff also maintain the Town’s potable water distribution
system to supply drinking water from Central Weld, the City of Greeley as well as our
ROWTP.
Wastewater
W/WW staff operate and maintain the Milliken Water Reclamation Facility (MWRF). The
facility is a 0.7 million gallon per day activated sludge wastewater treatment plant. Staff
also maintain the Collections system and two lift stations that convey the Town’s
wastewater to the MWRF for treatment.
15Town Funds
General Fund
The primary fund for the Town is the General Fund. The General Fund revenues,
including transfers, are estimated to decrease $69,871 from $5,686,037 in the 2021
Budget to $5,616,166 in 2022. General Fund expenditures are projected to increase
$330,658 from $6,147,121 in the 2021 Budget to $6,477,779 in 2022.
Revenues
Property Tax. The Town’s Total Assessed Valuation increased 6.77% ($6,034,070) in 2021.
This increase is mostly attributable to increases in Residential values, offset by decreases
in Oil & Gas values. See the following chart with the December 2020 figures versus the
December 2021 figures from Weld County for the Town of Milliken.
Dec 2020 Dec 2021
Vacant Land 3,094,910 2,431,220
Residential 58,839,940 67,301,460
Commercial 8,387,850 8,802,700
Industrial 4,074,520 4,901,280
Agricultural 594,660 621,360
Oil & Gas 7,603,560 3,862,200
State Assessed 5,700,300 5,984,070
Minerals 823,410 1,248,930
Exempt 9,092,580 9,770,050
Total minus Exempt 89,119,150 95,153,220
Sales and Use Taxes
The Town currently imposes a 2.5% Sales Tax on all applicable sales, which is collected by
the State and remitted to the Town on a monthly basis. The base Sales Tax is 2.0%. The
additional 0.5% was added to pay for the debt issued to construct the traffic light at the
intersection of Highways 60 and 257. When this debt was paid off in 2018, the additional
0.5% was voter approved to continue indefinitely for capital projects. At 2.5%, Milliken
has one of the lowest sales tax rates in Weld County. In 2022, each 1.0% of Sales and Use
Taxes will generate approximately $512,500.
Transfers In
The General Fund receives reimbursements from the Street Fund and the Trash Fund to
cover the costs of direct labor and administration related to these activities and funded
out of General Fund resources. The amount of these reimbursements is calculated each
year based on the payroll costs of employees performing services for these funds and
any other indirect costs appropriately allocated to these activities not otherwise paid
directly out of these funds.
16Town Funds (Continued)
Special Revenue - Grants Fund
During 2021, the Town received the first tranche of the America Rescue Plan Act (ARPA) funds
and the second tranche is expected in 2022. The 2022 Budget includes the expending of these
funds, although the actual project is yet to be identified.
Street Fund
The Town receives tax revenues from the State of Colorado and Weld County for the specific
purpose of funding road projects and improvements.
Highway Users Tax Fund (HUTF)
The Town receives a portion of the revenues received by the state’s Highway Users Tax Fund
(HUTF). By far, the largest source of revenue for this fund is the motor fuel tax levied on each
gallon of fuel purchased in the state. Municipalities receive their allocation of these funds based
on the weighted combination of (1) the number of registered vehicles in the municipality (80%)
and (2) the relative number of miles of used and maintained roads within the municipality (20%).
The Town reports the road miles each year for inclusion in this calculation.
Weld County Road and Bridge Tax
This tax is levied by Weld County and divided between the county, 50% to each city/town based
on their assessed valuations. The Town receives most of these revenues prior to June, as the oil
and gas companies usually pay 100% of their taxes in April, rather than in two payments like most
residential property owners.
Capital Projects Fund
The proposed budget includes funding for capital projects. These projects include the
improvements to the Dog Park and improvements to Town Hall.
Conservation Trust Fund
Conservation Trust Funds are the portion of Lottery Proceeds constitutionally mandated to be
distributed directly to local governments, based on population, for acquiring and maintaining
parks, open space and recreational facilities. The Town receives distributions quarterly and the
budget includes a transfer of $37,500 of these funds to the Capital Projects Fund to support the
project noted above.
Impact Fees Fund
The Town assesses Impact Fees on new development and construction within the Town to help
fund the cost of providing the services and infrastructure affected by the new development.
The Town currently assesses Impact Fees for the following:
Administration Infrastructure Park Development
Police Infrastructure Public Facilities Infrastructure
Streets Trails and Open Space
17Town Funds (Continued)
Debt Service Fund
These funds are restricted for debt service payments. Current outstanding debt includes the Police
Building Bond.
PROPRIETARY FUNDS
Water Fund
The Town Board plans to raise water rates on an annual basis to avoid what has happened in prior
years by not raising rates. Operational cost will remain flat as the RO Plant assists in the reduction of
water purchased from other entities. Funding is budgeted to maintain and repair both the potable
and non-potable water systems. Funding is also provided for the installation of improvements at
Ehrlich Lake in the amount of $530,000 and the construction of a 1 million gallon finished water
storage tank in the amount of $1,700,000.
Sewer Fund
Annual rate increases are also being contemplated in order to keep up with rising costs. As the Town
continues to grow there is a potential need for either a plant expansion or an additional plant when
operational capacity of the plant reaches a certain level. The 2022 Budget includes funding for
professional services to start the analysis of one of these projects in the amount of $125,000.
Trash Collection Fund
This fund is designed primarily as a pass-through fund, as the charges are directly related to the fees
charged by the Town’s solid waste disposal contractor plus a small administrative charge, which is
reimbursed to the General Fund. Charges are projected to increase based on the number of residents
growing as well as increases from the contractor.
Storm Water Fund
This fund is designed to account for the collection of the Storm Water Utility Fee and the expenditure
for specific projects. For 2022, funding is provided to complete the Cherry Street Drainage project.
Working Document
The budget, as presented, represents the Town’s financial plan to maintain and improve existing
services, fund the goals articulated by the Town Board, and ensure adequate fund balances to
maintain a strong financial position. The Budget is a working document that guides Staff and the
Board in the care, custody, and management of the resources available to serve the needs of our
citizens and will be amended as needed at the discretion and consideration of the Board.
18Town of Milliken Board of Trustees
Mayor Elizabeth Austin
Mayor, Pro-Tem LeRon Ehrlich
Trustee Derek Granquist
Trustee Amanda Long
Trustee Linda Measner
Trustee Nichole Rodriguez
Trustee Peggy Wakeman
Town of Milliken Administration/Staff
Town Administrator Cheryl Powell
Town Clerk Caree Rinebarger
Finance Director Wade Nickerson
Community Development Director Pepper McClenahan
Streets & Facilities Director Jon Rabas
Parks Director Keith Staggs
Water/Wastewater Director Don Stonebrink
Police Chief Benito Garcia
Town Attorney Matthew Gould
Judge Teresa Ablao
192021
2020 2021 Year-End 2022
GENERAL FUND Actual Budget Estimates Budget
Beginning Fund Balance $ 3,259,755 $ 3,259,755 $ 3,259,755 $ 2,789,521
Revenues and Other Financing Sources
Property Tax 2,348,058 2,543,287 2,543,287 2,723,570
Specific Ownership Tax 121,996 145,000 145,000 145,000
Sales Tax 1,179,353 1,025,000 1,025,000 1,025,000
Use Tax (Vehicle) 508,442 600,000 600,000 600,000
Use Tax (Building) 282,073 141,856 245,025 128,960
Severance Tax 251,190 110,000 140,252 110,000
Miscellaneous Taxes 9,091 7,500 10,100 7,500
Franchise Fees 194,321 150,000 150,000 150,000
Building Permits 378,215 223,229 307,888 209,631
Other Licenses & Permits 40,434 25,200 26,251 35,700
Charges for Services 38,165 32,400 32,100 32,400
Fines & Forfeitures 69,507 75,500 65,500 75,500
Intergovernmental 303,229 111,565 100,443 116,905
Earnings on Investments 80,098 51,000 750 1,500
Miscellaneous Revenue 497,228 12,000 12,000 12,000
Royalties 59,604 175,000 35,000 35,000
Contributions 11,619 52,500 53,772 2,500
Sale of Fixed Assets 13,938 - 59,730 -
Transfers In - Streets Fund 170,000 180,000 170,000 180,000
Transfers In - Trash Fund 20,000 25,000 20,000 25,000
Total Revenues and Other Financing Sources 6,576,561 5,686,037 5,742,098 5,616,166
Expenditures and Other Financing Uses
Town Board 161,088 124,611 119,806 116,111
Municipal Court 155,864 178,014 173,114 179,947
Administration 1,066,109 1,215,178 1,228,639 1,226,891
Public Safety 1,383,373 1,559,686 1,555,250 1,733,353
Community Development 469,191 500,207 473,722 590,979
Public Works 1,693,069 854,090 954,440 945,379
Facilities Maintenance 421,383 367,761 359,661 402,733
Parks and Open Space 633,312 941,328 950,814 977,495
Senior Citizen Program 68,477 145,566 145,566 66,391
Non-Departmental 51,309 52,820 51,320 38,500
TRPR Facilities 214,116 207,860 200,000 200,000
Total Expenditures and Other Financing Uses 6,317,290 6,147,121 6,212,332 6,477,779
Excess (Deficiency) of Revenues and Other
Financing Sources Over (Under) Expenditures
and Other Financing Uses 259,271 (461,084) (470,234) (861,613)
Ending Fund Balance $ 3,519,026 $ 2,798,671 $ 2,789,521 $ 1,927,908
Miniumum Target Reserve, 20% of Operating Budget 1,263,458 1,229,424 1,242,466 1,295,556
Available Funds $ 2,255,568 $ 1,569,247 $ 1,547,055 $ 632,352
202021
2020 2021 Year-End 2022
SPECIAL REVENUE - GRANTS Actual Budget Estimates Budget
Beginning Fund Balance $ 184,916 $ 54,459 $ 54,459 $ 1,080,468
Revenues and Other Financing Sources
HMGP-Acquisition Grant 2,884 - - -
TAP Grant - Sidewalk Gaps 329,057 - - -
ARPA Grant - 1,026,009 1,026,009 726,083
Transfers In - Capital Improvements Fund 60,000 - - -
Total Revenues and Other Financing Sources 391,941 1,026,009 1,026,009 726,083
Expenditures and Other Financing Uses
HMGP-Josephine Storm Sewer 98,680 - - -
TAP Grant - Sidewalk Gaps 423,718 - - -
ARPA Grant Expenditures - - - 1,752,093
Total Expenditures and Other Financing Uses 522,398 - - 1,752,093
Excess (Deficiency) of Revenues and Other
Financing Sources Over (Under) Expenditures
and Other Financing Uses (130,457) 1,026,009 1,026,009 (1,026,010)
Ending Fund Balance $ 54,459 $ 1,080,468 $ 1,080,468 $ 54,458
212021
2020 2021 Year-End 2022
SPECIAL REVENUE - STREET FUND Actual Budget Estimates Budget
Beginning Fund Balance $ 516,454 $ 460,753 $ 460,753 $ 338,822
Revenues and Other Financing Sources
Highway Users Tax 220,954 229,890 240,467 264,655
Weld County Road and Bridge 68,484 60,000 60,000 65,000
Total Revenues and Other Financing Sources 289,438 289,890 300,467 329,655
Expenditures and Other Financing Uses
Operations 175,139 216,000 242,398 400,000
Transfers Out - General Fund 170,000 180,000 180,000 180,000
Total Expenditures and Other Financing Uses 345,139 396,000 422,398 580,000
Excess (Deficiency) of Revenues and Other
Financing Sources Over (Under) Expenditures
and Other Financing Uses (55,701) (106,110) (121,931) (250,345)
Ending Fund Balance $ 460,753 $ 354,643 $ 338,822 $ 88,477
222021
SPECIAL REVENUE - CAPITAL PROJECTS 2020 2021 Year-End 2022
(IMPROVEMENT) FUND Actual Budget Estimates Budget
Beginning Fund Balance $ 677,507 $ 1,150,315 $ 1,150,315 $ 1,553,676
Revenues and Other Financing Sources
Sales Tax 294,838 150,000 215,105 200,000
Use Tax (Vehicle) 127,123 85,000 92,000 100,000
Use Tax (Building) 78,347 35,464 61,256 32,240
State Grants - 275,200 - -
Transfers In - Conservation Trust Fund 32,500 35,050 35,000 37,500
Transfer Out - Grants Fund (60,000) - - -
Total Revenues and Other Financing Sources 472,808 580,714 403,361 369,740
Expenditures and Other Financing Uses
Capital Project - Town Hall Improvements - - - 60,000
Capital Project - Infrastructure - 700,000 - -
Capital Project - Parks - 344,000 - 19,000
Total Expenditures and Other Financing Uses - 1,044,000 - 79,000
Excess (Deficiency) of Revenues and Other
Financing Sources Over (Under) Expenditures
and Other Financing Uses 472,808 (463,286) 403,361 290,740
Ending Fund Balance $ 1,150,315 $ 687,029 $ 1,553,676 $ 1,844,416
232021
SPECIAL REVENUE - CONSERVATION 2020 2021 Year-End 2022
TRUST FUND Actual Budget Estimates Budget
Beginning Fund Balance $ 7,498 $ 14,443 $ 14,443 $ 14,443
Revenues and Other Financing Sources
Intergovernmental 39,388 35,000 35,000 37,500
Earnings on Investments 57 500 - -
Total Revenues and Other Financing Sources 39,445 35,500 35,000 37,500
Expenditures and Other Financing Uses
Transfers Out 32,500 35,050 35,000 37,500
Total Expenditures and Other Financing Uses 32,500 35,050 35,000 37,500
Excess (Deficiency) of Revenues and Other
Financing Sources Over (Under) Expenditures
and Other Financing Uses 6,945 450 - -
Ending Fund Balance $ 14,443 $ 14,893 $ 14,443 $ 14,443
242021
2020 2021 Year-End 2022
SPECIAL REVENUE - IMPACT FEES FUND Actual Budget Estimates Budget
Beginning Fund Balances
Park Development Fees 298,900 360,700 360,700 417,700
Trails and Open Space Fee 139,704 175,754 175,754 209,004
Public Facilities Infrastructure 163,302 196,777 196,777 227,652
Street Fee 492,589 793,899 793,899 983,899
Drainage Fee 157,185 191,728 191,728 151,728
Police Infrastructure 222,772 249,552 249,552 274,252
Administration Infrastructure 121,776 142,945 142,945 162,895
Other 27,037 27,343 27,343 27,393
Total Beginning Fund Balances $ 1,623,265 $ 2,138,698 $ 2,138,698 $ 2,454,524
Revenues and Other Financing Sources
Park Development Fees 61,800 33,000 57,000 39,000
Trails and Open Space Fees 36,050 19,250 33,250 22,750
Public Facilities Infrastructure Fees 33,475 17,875 30,875 21,125
Street Fees 209,000 110,000 190,000 130,000
Drainage Fees 54,075 28,875 - -
Police Infrastructure Fees 26,780 14,300 24,700 16,900
Administration Infrastructure 21,169 11,550 19,950 13,650
Intergovernmental Revenues 250,000 - - 500,000
Earnings on Investments 306 500 50 -
Total Revenues and Other Financing Sources 692,655 235,350 355,825 743,425
Expenditures and Other Financing Uses
Street Projects 157,690 - - 1,500,000
Drainage Projects 19,532 40,000 40,000 151,728
Total Expenditures and Other Financing Uses 177,222 40,000 40,000 1,651,728
Excess (Deficiency) of Revenues and Other
Financing Sources Over (Under) Expenditures
and Other Financing Uses 515,433 195,350 315,825 (908,303)
Ending Fund Balances
Park Development Fees 360,700 393,700 417,700 456,700
Trails and Open Space Fee 175,754 195,004 209,004 231,754
Public Facilities Infrastructure 196,777 214,652 227,652 248,777
Street Fee 793,899 903,899 983,899 113,899
Drainage Fee 191,728 180,603 151,728 -
Police Infrastructure 249,552 263,852 274,252 291,152
Administration Infrastructure 142,945 154,495 162,895 176,545
Other 27,343 27,843 27,393 27,393
Total Ending Fund Balances $ 2,138,698 $ 2,334,048 $ 2,454,523 $ 1,546,221
252021
2020 2021 Year-End 2022
WATER FUND Actual Budget Estimates Budget
Beginning Net Position, GAAP Basis $ 28,406,369 $ 29,696,969 $ 29,696,969 $ 30,623,903
Capital Assets, Net (26,018,356) (25,623,700) (25,411,028) (25,148,356)
Accrued Interest on Debt 14,571 14,906 14,571 14,571
Long-Term Debt 5,060,502 4,859,999 5,098,089 4,898,089
Beginning Reserves, Budgetary Basis 7,463,086 8,948,174 9,398,601 10,388,207
Operating Revenues
Charges for Services 2,597,696 2,050,000 2,235,000 2,250,000
Miscellaneous Revenue 54,435 43,000 38,220 32,000
Total Operating Revenues 2,652,131 2,093,000 2,273,220 2,282,000
Operating Expenses
Operations and Maintenance 2,078,342 2,372,159 1,967,009 4,529,778
Depreciation 437,417 412,672 412,672 412,672
Total Operating Expenses 2,515,759 2,784,831 2,379,681 4,942,450
Operating Income (Loss) 136,372 (691,831) (106,461) (2,660,450)
Non-Operating Revenues (Expenses)
Interest Income 10,190 2,250 - -
Capital Investment Fee 1,191,317 676,830 1,169,070 667,072
Supplemental Impact Fee 14,224 4,455 4,845 5,265
Grant Revenue 66,293 - - -
Raw Water Purchase Fee 18,102 - - -
Miscellaneous Revenue 34,634 18,920 32,680 22,360
Infrastructure Improvements - (200,000) (150,000) (200,000)
Interest Expense (180,532) (173,200) (173,200) (167,200)
Total Non-Operating Revenues (Expenses) 1,154,229 329,255 883,395 327,497
Excess (Deficiency) of Revenues Over/(Under)
Expenses 1,290,600 (362,576) 776,934 (2,332,953)
Difference in Accrued Interest 335 - - -
Depreciation 437,417 412,672 412,672 412,672
Principal Paid on Long-Term Debt (195,000) (200,000) (200,000) (205,000)
Ending Reserves, Budgetary Basis 8,996,438 8,798,270 10,388,207 8,262,926
Add Back Capital Assets, Net at Beginning of Year 26,018,356 25,623,700 25,411,028 25,148,356
Deduct Accrued Interest on Debt at Beginning of (14,571) (14,906) (14,571) (14,571)
Deduct Long-Term Debt at Beginning of Year (5,060,502) (4,859,999) (5,098,089) (4,898,089)
Current Year Depreciation (437,417) (412,672) (412,672) (412,672)
Current Year Difference in Accrued Interest (335) - - -
Current Year Principal Paid on Long-Term Debt 195,000 200,000 200,000 205,000
Current Year Capital Outlay - 200,000 150,000 200,000
Ending Net Position, GAAP Basis $ 29,696,969 $ 29,534,393 $ 30,623,903 $ 28,490,950
Reserves Analysis
Ending Reserves, Budgetary Basis 8,996,438 8,798,270 10,388,207 8,262,926
Miniumum Target Reserve, 25% of Operating Budget 628,940 696,208 594,920 1,235,613
Available Funds $ 8,367,498 $ 8,102,062 $ 9,793,287 $ 7,027,314
262021
2020 2021 Year-End 2022
SEWER FUND Actual Budget Estimates Budget
Beginning Net Position, GAAP Basis $ 9,771,842 $ 10,418,827 $ 10,418,827 $ 11,024,791
Capital Assets, Net (6,126,448) (5,763,189) (5,563,189) (5,363,189)
Accrued Interest on Debt 24,412 5,490 24,488 24,488
Long-Term Debt 1,787,219 1,453,823 2,109,683 1,770,822
Beginning Reserves, Budgetary Basis 5,457,025 6,114,951 6,989,809 7,456,912
Operating Revenues
Charges for Services 1,301,937 1,325,000 1,345,000 1,350,000
Miscellaneous Revenue 28,884 30,500 30,500 30,500
Total Operating Revenues 1,330,821 1,355,500 1,375,500 1,380,500
Operating Expenses
Operations and Maintenance 698,826 903,851 777,286 927,185
Capital Outlay - 25,000 25,000 58,010
Depreciation 363,258 375,000 375,000 375,000
Total Operating Expenses 1,062,084 1,303,851 1,177,286 1,360,195
Operating Income (Loss) 268,736 51,649 198,214 20,305
Non-Operating Revenues (Expenses)
Interest Income 5,264 1,500 - -
Tap Fees 408,679 250,525 432,725 232,305
Miscellaneous Revenue 16,971 9,735 16,815 11,505
Infrastructure Improvements - (150,000) (150,000) (250,000)
Interest Expense (52,666) (66,790) (66,790) (55,985)
Total Non-Operating Revenues (Expenses) 378,248 44,970 232,750 (62,175)
Excess (Deficiency) of Revenues Over (Under)
Expenses 646,985 96,619 430,964 (41,870)
Difference in Accrued Interest (4,405) - - -
Depreciation 363,258 375,000 375,000 375,000
Principal Paid on Long-Term Debt (333,396) (338,861) (338,861) (344,327)
Ending Reserves, Budgetary Basis 6,129,467 6,247,709 7,456,912 7,445,715
Add Back Capital Assets, Net at Beginning of Year 6,126,448 5,763,189 5,563,189 5,363,189
Deduct Accrued Interest at Beginning of Year (24,412) (5,490) (24,488) (24,488)
Deduct Long-Term Debt at Beginning of Year (1,787,219) (1,453,823) (2,109,683) (1,770,822)
Current Year Depreciation (363,258) (375,000) (375,000) (375,000)
Current Year Difference in Accrued Interest 4,405 - - -
Current Year Principal Paid on Long-Term Debt 333,396 338,861 338,861 344,327
Current Year Capital Outlay - 175,000 175,000 308,010
Ending Net Position, GAAP Basis $ 10,418,827 $ 10,690,446 $ 11,024,791 $ 11,290,931
Reserves Analysis
Ending Reserves, Budgetary Basis 6,129,467 6,247,709 7,456,912 7,445,715
Miniumum Target Reserve, 25% of Operating Budget 265,521 325,963 294,322 340,049
Available Funds $ 5,863,946 $ 5,921,746 $ 7,162,590 $ 7,105,666
272021
2020 2021 Year-End 2022
TRASH COLLECTION FUND Actual Budget Estimates Budget
Beginning Net Position $ 60,552 $ 74,194 $ 74,194 $ 52,994
Operating Revenues
Customer Revenues 578,270 665,000 605,000 665,000
Miscellaneous Fees 2,420 - 5,000 5,000
Total Operating Revenues 580,690 665,000 610,000 670,000
Operating Expenses
Operations 547,059 620,400 606,200 621,200
Transfers Out 20,000 25,000 25,000 25,000
Total Operating Expenses 567,059 645,400 631,200 646,200
Operating Income (Loss) 13,631 19,600 (21,200) 23,800
Non-Operating Revenues (Expenses)
Interest Income 11 - - -
Total Non-Operating Revenues (Expenses) 11 - - -
Excess (Deficiency) of Revenues Over (Under)
Expenses 13,642 19,600 (21,200) 23,800
Ending Net Position $ 74,194 $ 93,794 $ 52,994 $ 76,794
Reserves Analysis
Ending Reserves, Budgetary Basis 74,194 93,794 52,994 76,794
Miniumum Target Reserve, 25% of Operating Budget 141,765 161,350 157,800 161,550
Available Funds $ (67,571) $ (67,556) $ (104,806) $ (84,756)
282021
2020 2021 Year-End 2022
STORMWATER FUND Actual Budget Estimates Budget
Beginning Net Position, GAAP Basis $ 2,855,179 $ 2,944,851 $ 2,944,851 $ 3,086,024
Capital Assets, Net (2,479,054) (2,396,419) (2,396,419) (2,313,419)
Beginning Reserves, Budgetary Basis 376,125 548,432 548,432 772,605
Operating Revenues
Customer Revenues 172,236 170,000 174,298 175,000
Miscellaneous Revenue - - - -
Total Operating Revenues 172,236 170,000 174,298 175,000
Operating Expenses
Operations and Maintenance - - - 50,000
Capital Outlay - - - 508,272
Depreciation 82,635 83,000 83,000 83,000
Total Operating Expenses 82,635 83,000 83,000 641,272
Operating Income (Loss) 89,601 87,000 91,298 (466,272)
Non-Operating Revenues (Expenses)
Drainage Impact Fees - 49,875 49,875 34,125
Interest Income 71 - - -
Total Non-Operating Revenues (Expenses) 71 49,875 49,875 34,125
Excess (Deficiency) of Revenues Over (Under)
Expenses 89,672 136,875 141,173 (432,147)
Depreciation 82,635 83,000 83,000 83,000
Ending Reserves, Budgetary Basis 548,432 768,307 772,605 423,458
Add Back Capital Assets, Net at Beginning of Year 2,479,054 2,396,419 2,396,419 2,313,419
Depreciation (82,635) (83,000) (83,000) (83,000)
Ending Net Position, GAAP Basis $ 2,944,851 $ 3,081,726 $ 3,086,024 $ 2,653,877
Reserves Analysis
Ending Reserves, Budgetary Basis 548,432 768,307 772,605 423,458
Miniumum Target Reserve, 25% of Operating Budget 20,659 20,750 20,750 160,318
Available Funds $ 527,773 $ 747,557 $ 751,855 $ 263,140
292021
2020 2021 Year-End 2022
DEBT SERVICE FUND Actual Budget Estimates Budget
Beginning Fund Balance $ 1,114,206 $ 1,163,502 $ 1,163,502 $ 1,211,091
Revenues
Property Taxes 220,933 219,780 221,389 174,035
Earnings on Investments 1,213 500 - -
Total Revenues 222,146 220,280 221,389 174,035
Expenditures
Administration 400 400 400 400
Debt Service
Principal 135,000 140,000 140,000 150,000
Interest 37,450 33,400 33,400 29,200
Total Expenditures 172,850 173,800 173,800 179,600
Excess (Deficiency) of Revenues Over (Under)
Expenditures 49,296 46,480 47,589 (5,565)
Ending Fund Balance $ 1,163,502 $ 1,209,982 $ 1,211,091 $ 1,205,526
302021
MILLIKEN HOUSING 2020 2021 Year-End 2022
AUTHORITY FUND Actual Budget Estimates Budget
Beginning Fund Balance $ 1,843,863 $ 1,877,849 $ 1,877,849 $ 1,908,299
Revenues
Contribution from Town of Milliken 30,000 20,000 20,000 -
Interest Income 11,754 11,000 11,000 11,000
Total Revenues 41,754 31,000 31,000 11,000
Expenditures
Operating 7,768 20,000 550 20,000
Total Expenditures 7,768 20,000 550 20,000
Excess (Deficiency) of Revenues
Over (Under) Expenditures 33,986 11,000 30,450 (9,000)
Ending Fund Balance $ 1,877,849 $ 1,888,849 $ 1,908,299 $ 1,899,299
31You can also read