Presentation of Q4 2017 results 22 February 2018 - Solstad ...

Page created by Jean Hernandez
 
CONTINUE READING
Presentation of Q4 2017 results 22 February 2018 - Solstad ...
Presentation of Q4 2017 results
22 February 2018
Presentation of Q4 2017 results 22 February 2018 - Solstad ...
Quarter highlights
•   Drop in revenues and EBITDA largely            REVENUES PER QUARTER – NOKm
    driven by seasonal lower activity
                                                              1 444   1 516

•   Realization of merger synergies – cost-out        1 158                   1 167
    target increased
     •   Continuous focus on cutting costs, and
         increase efficiency
     •   Operating costs expected to come down
         further in 2018                               Q1      Q2     Q3       Q4

•   Solid order intake during quarters – new
    awards of MNOK ~700                            ADJ. EBITDA PER QUARTER – NOKm
                                                                       384

•   Improved outlook, signs of increased
    activity across all vessel segments                                       210
     •   Activity in both UK and NCS                           135
         North Sea on the rise                          92

•   Project to spin-off non-core fleet initiated       Q1      Q2     Q3      Q4
     •   No transaction concluded so far
                                                                                      2
Presentation of Q4 2017 results 22 February 2018 - Solstad ...
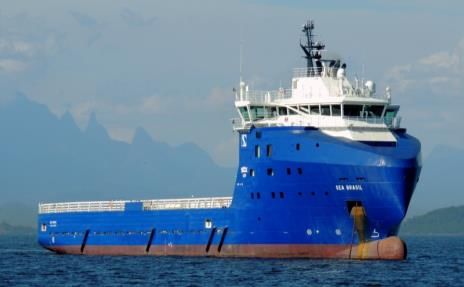
Q4 2017 in numbers – Income statement

•   Total operating income as presented in the income statement is net of
     •   Excess values from freight contracts (ref. note 3 in 4Q Financial report)
     •   income from Joint Ventures.

                                                                                     3
Presentation of Q4 2017 results 22 February 2018 - Solstad ...
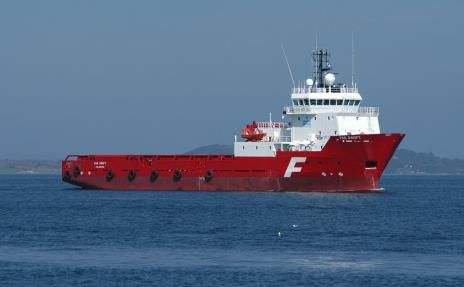
Q4 2017 in numbers – Balance sheet

                                     4
Presentation of Q4 2017 results 22 February 2018 - Solstad ...
Q4 2017 in numbers – Cash flow
CASH FLOW Q3’17-Q4’17
                                                   COMMENTS
NOKm
                                                   •   Company’s overall cash
                                                       position of reduced over the
 Cash, end Q3’17          2 114
                                                       quarter by MNOK 238 to
                                                       MNOK 1,875 from MNOK
                                                       2,114
 CF Ops.                               276

                                                   •   Net cash flow from
 CF Inv.                                     54        operations positive MNOK
                                                       276

 Installments/new debt                       165
                                                   •   Net cash flow from
                                                       investments negative MNOK
                                                       54
 Net interest payments            349

                                                   •   Net interest paid MNOK
 Changes in FX rates              53                   349, and net installments
                                                       paid were MNOK 164

 Cash, end Q4’18         1 875

                                                                                      5
Net interest bearing debt

NET INTEREST BEARING DEBT
NOK bln.                    COMMENTS
                             •   Net MNOK 165 installments paid during 4Q 2017
                             •   Cash reduced by MNOK 238

Q2’17        28.4            •   Negative currency effect of MNOK 482
                             •   NIBD increased from NOK bln 26.9 to 27.3

                             •   Total interest bearing debt of NOK bln 31.2 for the
Q3’17        26.9                Group
                             •   NOK bln 13.2 held by Solstad Farstad ASA
                             •   NOK bln 18.0 held by non-recourse subsidiaries

Q4’17        27.3

                                                                                       6
Merger synergies – target increased to
NOKm 700-800 end of 2018
  •   Detailed synergy assessment run in parallel with integration process
  •   Revised top down view of potential of NOKm 700-800
  •   Plan for synergy realization currently being implemented

 POTENTIAL SPLIT IN THREE BROAD                                               NEW COST RUN-RATE TARGETED FROM
 AREAS                                                                                    4Q 2018

  SYNERGY SPLIT                                                              SAVINGS POTENTIAL OVER TIME
  Allocation by category; run rate                                           Run rate
                                                                                                                 Target annualized
                                                                                                                 run rate NOKm
                                                                                                                 ~700-800

                                                                                                Realized by
                                                                                                  Q4’17
                                                      Admin.                                                       Yet to be realized
                                                      Crew                                                         Realized by Q4’17
                                                      Vessel OPEX
                                                                                       Run-rate cost synergies

NOTE: Based on execution date, timing of P&L effect not considered; Based on current activity level

                                                                                                                                     7
Merger synergies case study: Reduced vessel OPEX

CONTEXT                         EXAMPLES OF VESSEL OPEX REDUCTIONS

•   Vessel OPEX reduced
                                REFERENCE               -28%
    over time, largely driven
    by new crew composition     CASE #1:
    and negotiations with key   2007 built
                                PSV operating     100
    suppliers                                                  72
                                UKCS, &
•   Focus on continuous         International
    improvements, and                            2016          2018
    re-thinking traditional
    ways to operate
                                                        -14%
                                REFERENCE
                                CASE #2:
                                2008 built        100          86
                                PSV operating
                                Australia
                                                 2016          2018

                                                                      8
Solid backlog situation
BACKLOG
                                                 COMMENTS
NOK bln.
  Aquaculture    AHTS & PSV International        • Total contract backlog of
  Subsea         AHTS & PSV Strategic regions      NOKbln. ~9.3 as per February
                                                   2018 (incl 50% of JV backlog)
   3 213                                         • NOKbln. ~3.2 in firm contract
    42                                             backlog Feb to Dec 2018
                                                 • Aquaculture has total backlog
                                                   of NOKbln 1.4 (of which 50%
   1 646        2 178                              included in SolstadFarstad
                 82                                backlog)

                            1 283
    243         1 357
                             117         1 016
                                          117
                 74          865
   1 282
                                          741
                602
                            299           158
   2018         2019         2020         2021

                                                                                   9
Q4’17 contract awards in excess of MNOK 700,
positive outlook for Spring/Summer 2018
SELECTED CONTRACT AWARDS DURING Q4’18                    KEY OBSERVATIONS

                                                         •   Early signs of
                                                             recovery in selected
                                                             regions
                                                         •   Increased number of
                                                             tenders, with
                                                             improved terms and
                             Normand Commander 5+3           attractive contract
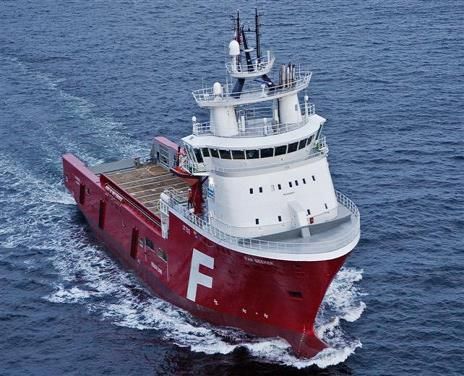
   Sea Brasil 2 years firm
   contract with Statoil     years firm option with          lengths
   Brasil                    Bahia Grande in Argentina   •   Subsea construction
                                                             late cyclical, however
                                                             recent awards in
                                                             adjacent oil service
                                                             sectors indicate uptick
                                                             in activity

   FAR Seeker 1 year + 14    FAR Swift with 1 year
   months with Woodside      contract extension with
   Energy in Australia       Petrobras in Brazil

                                                                                    10
Segment in details
                                                                                    AHTS          PSV           CSV   Wellboats       Harvest vessels

                                                                                         SUBSEA
                           AHTS & PSV                      AHTS & PSV
                                                                                         CONSTRUCTION &                   DESS AQUACULTURE
                           STRATEGIC REGIONS               INTERNATIONAL
                                                                                         RENEWABLE ENERGY

               TOTAL #                     34                       17                       1                                0
               VESSELS                    32                             31                                32                 0
FLEET STATUS

               IN                        25                    2                             1                                0
               OPERATION                21                          18                                20                      0

                                   9                                15                       0                                0
               IN LAY-UP           11                              13                            12                           0

                               0                               0                             0                                         4
               NEWBUILDS       0                               0                             0                                    1

SEGMENT                    •   Norway: Expect              •   UK - expect increased     •   SURF: Probably               •   Actively bidding on
OUTLOOK                        increased activity in           demand in 2018,               another year until we            new opportunities in a
                               2018, based on more             particularly for PSV's.       see a meaningful                 growing market
                               rigs drilling, especially   •   SE - Asia / Africa /          activity increase.
                               in summer season                Med - slightly            •   IMR: Might pick up
                           •   Brazil: Steady activity.        increased activity, but       already this year due
                               Further growth                  massive oversupply of         to combination of
                               expected. High                  vessels.                      accumulated
                               barriers of entry to                                          maintenance and
                               this market                                                   improved cashflow for
                           •   Australia: Steady                                             oil companies
                               activity. High barriers                                   •   Offshore wind: Steady,
                               of entry to this market                                       high activity expected

                                                                                                                                                   11
Thank you!

             12
You can also read