3 March 2020 Economic Development - EDD Presentation on the - DTI
←
→
Page content transcription
If your browser does not render page correctly, please read the page content below
EDD Presentation on the
   3rd Quarter 2019/20
   Presentation to the Portfolio Committee
          Economic Development
              3 March 2020
The report covers the period from 1 October 2019 to 31
       December 2019 unless otherwise stated.

                                                         1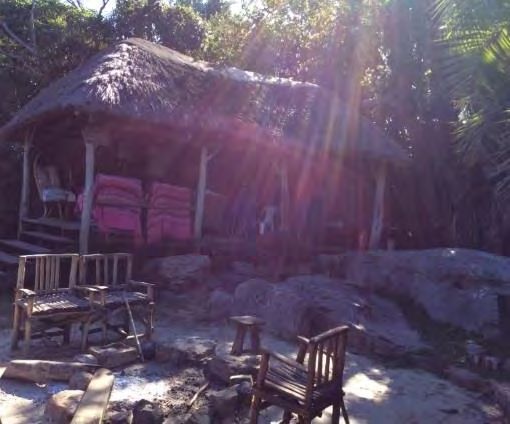
Contents

A. Economic and employment overview
B. Highlights from the Department’s report for
   the quarter:
  1.   Clean Audit Opinion
  2.   Update: Export Tax on Scrap Metal as a measure for
       promoting beneficiation
  3.   National Township and Village Economies Framework
  4.   Budget Facility for Infrastructure
  5.   Update: National Macro Organization of Government: PICC
C. Report on KPIs
D. Report on Human Resources
E. Report on Finances
                                                            2
A. Products targeted
      EDD has 183 products for the year, but in Q3:
KPI   Target        Achieved
  1            1          1

  2            1          1
                                   16 KPIs
  3            1          2

  4            0          0

  5            1          3

  6            1          6
                                   43 products planned
  7            2          1

  8            16         18

  9            1          1

 10            7          10       54 products achieved
 11            1          0

 12            1          1

 13            4          6        78% of allocated
 14

 15
               2

               1
                          2

                          1
                                   budget spent
 16            3          1                           3
A: ECONOMIC AND
EMPLOYMENT OVERVIEW

  • Economic context
  • Employment review

                        4
Economic context
The GDP result for Q3 2019/2020 will be released on March the 3rd at 11:30.
• The global economy grew by 2.9% in 2019, its lowest growth rate since
2009.
• South Africa’s growth rate remained low at an estimated 0.4% for the
calendar year
• South Africa’s GDP forecasts for 2020 and 2021 have been revised
downwards by the Reserve Bank to1.2% and 1.6% respectively.
2017 2018 2019 2020(f) 2021(f)
Global economy 3.8 3.6 2.9 3.3 3.4
Advanced economies 2.4 2.2 1.7 1.6 1.6
Emerging markets and developing economies 4.6
4.8 4.5 3.7 4.4
Sub-Saharan Africa 2.9 3.2 3.3 3.5 3.5
Brazil 1.1 1.3 1.2 2.2 2.3
Russia 1.6 2.3 1.1 1.9 2.0
India 7.2 6.8 4.8 5.8 6.5
China 6.8 6.6 6.1 6.0 5.8
South Africa 1.4 0.8 0.4 1.2 1.6 5Trade in 2019
• South Africa’s exports in 2019 totalled R 1 302 billion, and
imports totalled 1 272 billion; the trade balance was positive
at R 31 bn
• SA’s top 3 exports were platinum, cars and iron ore, and our
top 3 imports were oil, cars and mobile phones
• SA’s top 3 export destinations were China, Germany and the
USA and our top 3 sources of imports were also China,
Germany and the USA
• In 2019, South Africa was the world’s largest exporter of
platinum, ferro-alloys, manganese and chromium, the second
largest exporter of citrus fruit, the third largest exporter of iron
ore, and the sixth largest of coal
6Labour market in Q3 2019/2020
Unemployment rate for the quarter was 29.1%, unchanged from the previous quarter
Main Results for the Quarter
• Labour force increased by 38 000, to 23 146 000.
• 45 000 jobs were added in the fourth quarter, taking total jobs to 16 420 000
• Number of unemployed decreased by 8 000 to 6 726 000
Main Results for the 12 months ending December 2019
• Labour force increased by 478 000, to 23 146 000, but the number of jobs decreased by 108 000,
to 16 420 000
• Number of unemployed has increased by 587 000, to 6 726 000
• As a result, the unemployment rate increased from 27.1% to 29.1%
Youth Labour Market
• This quarter, 61 000 jobs were created for youth (15-64); however, youth jobs have decreased by
172 000 over the last twelve months.
• Number of unemployed youth decreased by 15 000 this quarter, but is 371 000 more than 12
months ago.
• Youth unemployment rate is now 41.5%, compared to 38.7% a year ago.
7Jobs by Industry
• In the last quarter, government (113 000), business • Over the last year, government (168 000), transport
services (76 000) and transport (36 000) were the (46 000) and agriculture (36 000) have been the
main job creators. main job creators
• The largest job losses have occurred in construction
• The largest job losses occurred in trade (159 000), (131 000), trade (70 000) and manufacturing
manufacturing (39 000) and the utilities (14 000). (46 000).
Jobs by Industry for the Quarter Jobs by Industry for the 12 months ending
December 2019
Change (‘000) % Change Change % Change
(‘000)
Government 113 000 3.1 Government 168 000 4.6
Business Services 76 000 3.0 Transport 46 000 4.7
Transport 36 000 3.7 Agriculture 36 000 4.2
Construction 12 000 0.9 Mining -8 000 -1.8
Mining 11 000 2.5 Utilities -14 000 -10.5
Agriculture 6 000 0.6 Business Services -43 000 -1.7
Private Households 0 0 Private Households - 46 000 -3.5
Utilities - 14 000 -10.2
Manufacturing -46 000 -2.6
Manufacturing -39 000 -2.2
Trade -70 000 -2.1
Trade -159 000 -4.7
8Jobs by Province
• In the last quarter, Gauteng create the most • In the last year, North West (19 000), KZN
jobs (38 000), followed by North West (32 (16 000) and Northern Cape (13 000) saw
000) and Western Cape (24 000). the most jobs created
• The most jobs were lost in Limpopo • Limpopo (77 000), Gauteng (65 000) and
(35 000), Eastern Cape (18 000) and KZN Free State (21 000) have lost the most jobs
(10 000). Jobs by Province for the 12 months to
Jobs by Province for the Quarter December 2019
Change (‘000) % Change Change (‘000) % Change
Gauteng 38 0.7
North West 19 2.0
North West 32 3.4 KZN 16 0.6
Western Cape 24 1.0 Northern Cape 13 4.1
Northern Cape 13 4.2 Eastern Cape 9 0.7
Mpumalanga 11 0.9 Mpumalanga -1 -0.1
Free State -10 --1.2 Western Cape -3 -0.1
KZN -10 --0.4 Free State -21 -2.7
Eastern Cape -18 -1.3 Gauteng -65 -1.3
Limpopo -35 -2.5 Limpopo -77 -5.2
9B. HIGHLIGHTS FROM
DEPARTMENT’S REPORT
1. Clean Audit Opinion
2. Update: Export Tax on Scrap Metal as a measure for promoting
beneficiation
3. National Township and Village Economies Framework
4. Budget Facility for Infrastructure
5. Update: National Macro Organization of Government: PICC
10Focus 1/5: Clean Audit KPI 1
• Clean Audit Opinion obtained for second consecutive year for 2018/2019
after 2017/2018
• The department received Certificate of Excellence from AGSA for
achieving a Clean Audit Opinion in terms of the PFMA
11Focus 2/5: Update Export Tax as a measure for promoting beneficiation
• Historical PPS operational periods are that:
– Initially implemented for a 5 year period: September 2013 to September
2018
– Extended for 9 months: October 2018 to June 2019
– Extended for 9 months: June 2019 to March 2020
• The current Price Preference System (PPS) introduced in 2013 to restrict
exporting of Scrap Metal will be extended until Export Duty is introduced
• Work to finalise implementation of an Export Tax on Scrap Metal
commenced and picked up pace in Q3
• According to Minister of Finance the “…proposed export taxes will apply to
ferrous metals at the rate of R1 000 per tonne, aluminium at R3 000 per
tonne, red metals at R8 426 per tonne, and other waste and scrap metals at
R1 000 per tonne…Consultation will begin today (26 Feb 2020), to be
concluded by the end of May 2020, for consideration in the annual tax bills.”
(Budget Review 2020, National Treasury, 26 Feb 2020, p43) – Annual
Taxation Laws Amendment Bill (TLAB)
• The initial consultation process was conducted by ITAC through a gazette in
October 2019
• The effective date of implementation of the tax will depend on Parliamentary
tax process during the 2020 calendar year.
12Focus 3/5: Village and Township KPI 2: National Township and Rural Economies Framework
• EDD is coordinating the development of National Township and Rural
Economies Development Framework and also designing:
• A Social Economy Policy Framework which will be finalized in the coming
financial year
• A multi-party Task Team was formed and guided by the Office of the Deputy
President and the National Planning Commission to drive the coordination process
for township and rural economy development
• Some of the strategies, below, to be implemented with other stakeholders, for
instance
• SEZs and Industrial Parks will be
• Integrated into local economies, and also
• Work with local universities to strengthen R&D on local economies
• Grocery Retail Market Inquiry remedial actions made by the Competition
Commission
• The framework will
• assist in tracking available niches in the value-chains of CTFL and
Poultry, target unserved/underserved markets in these sectors
• nullify badly run by-laws not promoting competitiveness, in the local
economies
13Focus 4/5: BFI KPI 9: Infrastructure strategic decisions
Budget Facility for Infrastructure Bid Window 3
• Previously EDD reported to Parliament about the Budget Facility for
Infrastructure (BFI) window 1 and 2 platform for applications for funding
infrastructure
• As directed by Cabinet, NT is working jointly with the Presidential
Infrastructure Coordinating Commission (PICC) secretariat, DPME and EDD
to establish the BFI
• Aim of BFI is to support quality public investments through robust project
appraisal, effective project development and execution to ensure
• sustainable financing arrangements beyond the MTEF
• Joint Technical Committee (JTC) is a multi- stakeholder committee comprising
of senior officials from NT, PICC, and DPME
• manages detailed technical assessment process and makes
recommendations to budget authorities (MTEC) and political decision
makers (MINCOMBUD)
• Window 3 between March and May 2019
• 42 applications were received for funding with a combined value of R99.1bn
covering Agriculture, Water and Sanitation, Education, Broadband, Transport,
Health, and Industrial Development sectors
14Focus 4/5: BFI KPI 9: Infrastructure strategic decisions (Conti)
BFI Bid Window 3: Quarter 3
No of Projects Decision taken
5 Supported and recommended for funding
2 Not supported for funding
18 Recommended for further consideration through consultation with
applicants to establish priority and further clarity
1. Gauteng Schools Programme
2. Klipfontein Hospital
3. Tygerberg Hospital
4. Coega project (Gas to power)
5. Coega project (Return effluent scheme)
15Focus 4/5: BFI Some lessons learnt from the BFI
The BFI will help address:
1. Weaknesses in planning and project identification, due to an inadequate link
with asset management and spatial plans, poor intergovernmental coordination and
a lack of planning expertise and capacity. A general lack of collaboration results in
“go it alone” mentality.
2. No formalised authorisation environment whereby projects are approved per
stage at clearly defined decision gates (SIPDM) so that it can progress along the
cycle without informal changes to decisions and unnecessary delays.
3. Project preparation processes are incomplete and of poor quality. Preparation
activities are constrained by poor system design, limited project management
knowledge and capacity, and insufficient project preparation skills, which results in
infrastructure projects being delayed, with only a few projects reaching a stage
where they are ready to be funded. This is further indicated by the way projects are
presented for funding, often proposing biased solutions, over-optimistic forecasts
and/or inaccurate information.
16Focus 5/5: Update NMOG Infrastructure: PICC
• Following the Presidential announcement to merge EDD + dti under
the NMOG process:
– Work has commenced to move the PICC Technical capability to
DPW&I and alignment with DBSA
• The EDD supported the human resourcing of the roll-out of national
priority infrastructure and made available human resources to
support the Presidency in its responsibility to establish the
Infrastructure Fund
• A number of key interactions between EDD and DPW&I decision
makers were held during the quarter
• Agreement on modalities of the takeover of Technical Unit by
DPWI+I reached
– and to support Infrastructure Fund under Presidency, and in turn
DBSA
17A. Products targeted
EDD has 183 products for the year, but in Q3:
KPI Target Achieved
1 1 1
2 1 1
16 KPIs
3 1 2
4 0 0
5 1 3
6 1 6
43 products planned
7 2 1
8 16 18
9 1 1
10 7 10 54 products achieved
11 1 0
12 1 1
13 4 6 78% of allocated
14
15
2
1
2
1
budget spent
16 3 1 18Programme 1: Administration
Strategic Objective 1: To ensure good governance in the administration of the
Department
Key Performance Indicators
KPI 1 : Audit Opinion obtained in respect of the previous financial year
Clean Audit obtained for the fiscal year 2018/19
against a target of an unqualified audit (see
Focus Area 1/5)
19Programme 2: Growth Path and Social Dialogue
Strategic Objective 2: Coordinate jobs drivers and implementation of the New
Growth Path economic strategy in support of the National Development Plan
Key Performance Indicators
KPI 2: Analytical and public policy advocacy
KPI 3: NGP jobs drivers and coordination structures
KPI 6: Support to provinces
20Public Policy Advocacy
Number of analytical and public advocacy reports KPI 2
1. Report on National Township and Village Economies Development
Framework (see Focus Area 3/5)
21NGP Jobs Drivers
NGP jobs drivers and coordination structures
KPI 3
1. Report on establishing Gauteng Biofuels Coordination Forum
2. Report on strategic support to Amadiba Coastal Communities
Development Association Trust
22NGP Jobs Drivers
NGP jobs drivers and coordination structures
KPI 3
TORs for Gauteng Biofuels Coordination Forum
Secretariat • EDD
• Coordinate the economic activities within the biofuels value
chain in collaboration with key stakeholders (small scale
Purpose producers, government departments, state-owned entities
and interested buyers)
• Develop understanding of the biofuels value chains and
finding innovative ways for employment creation in the
industry
Scope • Identify viable projects and opportunities
• Facilitate participation and networking of key stakeholders
• Develop and action plan
Composition • Government, Academia, research entitles and industry
23NGP Jobs Drivers
NGP jobs drivers and coordination structures
KPI 3
Report on strategic support to Amadiba Coastal Communities
Development Association Trust
• Amadiba Coastal Communities Development Association (ACCODA) Trust
approached EDD to discuss agriculture and tourism development issues
• ACCODA is the community trust is in partnership with the Eastern Cape
Parks and Tourism, EC Department of Land and EC Department of Economic
Development, Environment and Tourism.
• Situated in the Wild Coast, Mtentu campsite and lodge is owned by ACCODA
Trust
• Had an impasse around environmental approval required for planned
renovation and refurbishment at the lodge.
• EDD facilitated that ACCODA Trust submit new documents to be to DEDEA
• Original application was in 2017
• DEDEA approved application Dec 2019
24Provinces
Support provided to provinces
KPI 6
1. 5 Provincial Support
2. Technical MinMec
25Provinces
KPI 6
Number of reports on support provided to provinces
5 Reports on support to provinces Technical MinMEC: 28 Nov 2019
• Entities in support: IDC, sefa, SEDA,
NEF, CIPC, SARS, NYDA, Provincial Key areas discussed:
Economic Development Departments, • National Framework for
National Departments - eg Dept of
Township and Informal
Small Business, Department of
Agriculture Forestry and Fisheries etc. settlements (See Focus Area
• On average attendance: 100
3/5)
individuals/SMMEs • Resolution on implementation
• Work done: better understand
of the Social Policy
challenges faced by SMMEs, • Local procurement as an
registration of companies, information instrument of inclusion
on funding processes, tax processes • Draft MTSF – Cluster Report
(registration/clearances), business • Re-imagined Industrial
plan development, youth Strategy- Cluster Report
empowerment initiatives
26Programme 2: Growth Path and Social Dialogue
Strategic Objective 3: Facilitate social dialogue and implementation of social
accords
Key Performance Indicators
KPI 4: Implementation of the green economy accord
KPI 5: Employment and entrepreneurship for black women and youth
KPI 7: Social dialogue interventions to save and create jobs & reports on
implementation of Social Accords
27Women and Youth
Number of reports on black women and youth with access to employment and
KPI 5
entrepreneurship opportunities
1. Report on assistance to women and youth owned cooperatives
in Dr Pixley ka Isaka Seme Local Municipality
2. Report on Limpopo SMME support with SABS services
3. Report on Limpopo SMME support with Sanral
28Women and Youth
Number of reports on black women and youth with access to employment and
KPI 5
entrepreneurship opportunities
Report on assistance to women and youth owned cooperatives in Dr Pixley ka
Isaka Seme Local Municipality, Mpumalanga
• EDD helped revive the projects:
• Toilet Paper Manufacturing Premises
• Cooperative currently in training through SEDA: Business plan, mentoring, financial
management
Kagiso Mokgalaka 29yr old Bcom Graduate: Nora Elle Pty Ltd in Lebowakgomo
• Manufactures tru-comfort toilet papers and range from 1Ply 500 sheets, 2Ply 350
sheets from recycled materials. Wants to expand
• EDD arranged for SABS Auditors to conduct a gap analysis report on requirements
to meet the SABS standards
Stephen Mametsa: Tsoga O Phakgame (Pty Ltd) in Driekop
• EDD contacted SANRAL and ensured that they fast-racked the process of
connecting the electricity to the new building
• Youth-owned laundry - employs about 50 staff
29Social accords
KPI 7
Number of reports on social dialogue interventions to save and create jobs and reports
on implementation of social accords
Public Policy Advocacy Work
1. Report on session with CEO’s of businesses trading in Africa
30Social accords
Social accords
KPI 7
Number
Number of of reports
reports ondialogue
on social socialinterventions
dialoguetointerventions cont-
save and create jobs and reports
on implementation of social accords
Public Policy
Report Advocacy
on support to CEOsWork
on businesses trading in Africa
• Report focuses on an engagement with • The dti’s Trade Invest Africa Unit
CEO’s of businesses trading in Africa
was also invited to address issues
• Engagement highlighted export
opportunities and discussed solutions raised by companies
towards challenges faced by businesses • Some of key resolutions are as
in exporting to Africa follows:
• EDD produced a consolidated Africa trade - Companies were advised to
sheet which reported on South Africa’s contact the dti for trade
trade position with other African countries
on a number of commodities missions and were
• Report showed that South Africa’s exports subsequently linked with
deteriorated over the years and its trade country representatives in the
position with other African countries is targeted countries for exports
increasingly being threatened - ITAC to be engaged on tariff
• EDD shared the report with CEO’s of 60 support for local businesses
companies trading in Africa requesting
them to engage with the report and - CEOs or representatives to
respond on any areas of assistance be invited to 2020 sessions
• Companies responded and were invited to involving private sector on
participate in a session Master Plans.
31Programme 3: Investment, Competition & Trade
Strategic Objective 4: Coordinate infrastructure development and strengthen its
positive impact on the economy and citizens
Key Performance Indicator
KPI 8: Quarterly Cabinet-level progress reports of infrastructure SIPs
KPI 9: Quarterly Cabinet-level progress reports of infrastructure SIPs
KPI 10: Infrastructure projects evaluated, unblocked, fast tracked or facilitated
KPI 12: PICC meetings held and facilitated
KPI 13: Coordination actions to drive implementation of SIP 5 of the National
Infrastructure Plan
32Infrastructure Cabinet Reports: SIPs
Progress reports to Cabinet on the 18 Strategic Integrated projects KPI 8
(SIPs)
Work Completed: Cabinet Level Reports
• 18 Construction Update Reports were prepared for Cabinet which
provided information on financial, employment, localisation and
construction activities; and identified progress and actions that Cabinet
needed to consider to ensure the infrastructure build programme was
implemented and able to boost jobs and growth.
Note: Implementation of the projects and operational responsibility,
funding and reporting remains with the relevant line Departments.
33Cabinet and PICC strategic Decisions
Number of cabinet and PICC strategic decisions on infrastructure KPI 9
implemented
1. Action minute on the Technical Evaluations of the Budget Facility
for Infrastructure (BFI) window 3 applications (See Focus)
34PICC meetings facilitated
Number of PICC meetings held and facilitated
KPI 10
Work completed: PICC meetings held and facilitated
• During the quarter, EDD provided technical, secretariat and coordinating support
for the hosting of PICC structures through the PICC Unit. These structures
prepared and finalised the submissions discussed in the meetings held.
PICC held ten meetings supported by the EDD
22nd October 2019 • Tirisano Trustees meeting
24th October 2019 • SIP 1 Steercom
1st November and 6th
• SIP Coordinators Forum [2]
December 2019
7th November 2019 • PICC SIP 3 Programme Committee
5th December 2019 • PICC meeting Office of the President
6th December 2019 • Meeting with PICC Secretariat, Minister De Lille
8th November 2019 • SIP2 Steercom
9th December 2019 • PICC secretariat meeting with DBSA
Sep - Dec 2019 • PICC Infrastructure Fund Meetings 35Localisation
Initiatives to increase localisation in the infrastructure and KPI 12
industrialisation programmes
1. Report on the funding to establishment of Green Ship
Recycling Facility In Saldanha Bay IDZ
36Localisation
Initiatives to increase localisation in the infrastructure and KPI 12
industrialisation programmes
Report on the funding to establishment of Green Ship Recycling Facility
In Saldanha Bay IDZ
• Sector is strategic because SA:
• produces world-class boats and ships.
• Ship and boatbuilding sector is backed by a rich
supply chain of manufacturers, technicians,
fabricators, installers and system integrators
• has extensive maintenance and repair facilities; a
strong skills base; lower labour costs than many
Western countries, and a strategic location.
• Saldanhha Bay IDZ (SBIDZ) is earmarked as an Oil, Gas
and Marine Repair Services Cluster Hub, focusing on Scrap metal will be
oilfield logistics, and ship repair and engineering services generated and help to
with the aim to create SA’s first free-zone port increase capacity in
• On 21 October 2020, IDC approved for the participation South Africa value chain
in a bankability feasibility study and shareholder's – links to work on Export
agreement Duty on Scrap Metal
37Investment and infrastructure
Investment and Infrastructure projects evaluated, unblocked, fast
KPI 13
tracked or facilitated or assessments completed
1. Action minute on unblocking of flora permit and land use
application for Soetwater wind farm
2. Action minute on fast-tracking appeal decision process for
SANRAL’s N3 project
3. Action Minute on unblocking of the acquisition process of
relocation of Arbeidsgenot Primary School in the Free State
4. Action Minute on fast-taking remedial works at Zimbengwini
Senior Primary School
5. Action minute on facilitation of product development and testing
of beauty products owned by a youth black woman
6. Action minute on the unblocking of approved funding from
Employment Creation Fund for Job Creation Trust
38Investment and infrastructure
Investment and Infrastructure projects evaluated, unblocked, fast
KPI 13
tracked or facilitated or assessments completed
1. Flora Permit: Flora permit from the Northern Cape Department of
Environment and Nature Conservation for Soetwater Wind Farm
2. SANRAL N3: confirmation and finalisation of Environmental Authorization
3. Arbeidsgenot Primary School, Free State: approval of acquisition of
relocation site
4. Zimbengwini Senior Primary School, Eastern Cape: appointment of
replacement contractor for remedial work on unsafe school structures
5. Youth black female pharmacist: accessed R59 823 under the SEDA
Technology Programme for product testing
6. Employment Creation Fund for Job Creation Trust: facilitation of R12m
payout
– Unblocking efforts contribute to ensuring practical realisation of
economic value-chains
39Programme 3: Investment, Competition & Trade
Strategic Objective 5: Promote productive investment, industrial financing and
entrepreneurship for jobs and inclusive growth
Key Performance Indicators
KPI 14: Initiatives to increase localisation in the infrastructure and industrialisation
programmes
KPI 15: Investment initiatives facilitated, fast tracked and /or unblocked
40Industrial Finance
Report on the level and impact of industrial finance by DFIs and KPI 14
departments including on township enterprises
1. Report on the commitment progress by CCBSA Mintirho Fund
2. Report on Evaluation of IDC-managed funds
41Industrial Finance
Report on the level and impact of industrial finance by DFIs and KPI 14
departments including on township enterprises
Report on the commitment progress by CCBSA Mintirho Fund
• Once-a-Year Report outlines the impact of the Coca-Cola Bottling South Africa
(CCBSA) Mintirho R400milllion Fund which was established as public interest
condition in the approval of the CCBSA Merger.
• EDD sit on foundation advisory board
• Report
– provides update on some of the objectives and deliverables of the fund
– R219million disbursed up to reporting period
• creating 826 jobs of which 471 were women
– 1 543 new outlets qualified to received new coolers
• 8 091 that was reported in December 2018 bring the total participating
outlets with CCBSA coolers now at 9 161
42Industrial Finance
Report on the level and impact of industrial finance by DFIs and KPI 14
government departments
Report of IDC funding/investment in Q3 2019/20
IDC funds approved and disbursed
Q3 2019/20 Q3 2018/19 %
Approvals R3.915.3 billion R3 186.6 billion 19% increase
Disbursements R3.666.8 billion R3 126.00 billion 15% increase
Q2 2019/20
Approvals R6 116.2 billion
Disbursements R3 672.4 billion
IDC approvals and jobs Q3
R’milion Jobs
Black Empowered 1 850.2 3277
businesses
Black Industrialists 410.8 219
Youth-empowered 262.9 220
businesses
Women-empowered 127.0 91
43
businessesIndustrial Finance
Report on the level and impact of industrial finance by DFIs and KPI 14
departments
IDC Funding by provinces for 2019/20 : Quarter 3
IDC Funding approved (gross) per Province
R million Jobs created / saved
Northern Cape 1 600.8 3922
Limpopo 1077.2 2708
Gauteng 622.2 200
KwaZulu-Natal 240.8 376
Western Cape 239.0 60
Eastern Cape 91.6 79
Mpumalanga 26.7 5
Free State 9.0 -
North West 8.0 -
SA Total 3 915.3 7350
Rest of Africa - -
Gross Total 3 915.3 7350
Source: IDC and EDD calculations 44Improve performance: IDC
Ministerial or departmental oversight engagements with the IDC held
KPI 15
Record of Engagement on:
- Amendment to the Downstream Steel Industry
Competitiveness Fund (DSICF)
45Downstream Steel Industry Competitiveness Fund (DSICF)
Problem of the fund identified and reported in Q2 as follows:
• The uptake on the DSICF has been less satisfactory due to its stringent application criteria, particularly
as it relates to BBBEE. The pricing was also considered too high.
Solution in Q3:
• Amendments were made in the
• Qualifying criteria:
• Sector
• Regional focus
• Type of enterprise
• Due Diligence
• BEE Requirement
• Maximum Investment size and term
• Pricing
• All funding up to the first R30 million will be priced at the lower of (i) the prevailing prime
interested rate (as quoted by the South African Reserve Bank), or (ii) the IDC risk-based
pricing less the current scheme subsidy of 1.5%, for large or medium-sized businesses, or
2%, for small businesses, as the case may be; and
• All funding in excess of the first R30 million should be priced at the current scheme subsidy
of 1.5%, for large or medium-sized businesses, or 2%, for small businesses, as the case
may be.
4
6Programme 3: Investment, Competition & Trade
Strategic Objective 6: Promote competition, trade and economic regulation in
support of job creation, industrialisation and economic inclusion
Key Performance Indicators
KPI 16: Work of the economic regulators
47Quarterly Oversight
Oversight meetings and reports KPI 16
1. Meetings and Reports
48Quarterly Oversight
Oversight meetings and reports KPI 16
Meetings and Reports
• Analysis of the 2nd Quarterly Reports of the Competition
Commission, Competition Tribunal and ITAC in November
2019
• Quarterly entities meeting on 10 December 2019
– Competition Commission, Competition Tribunal and
ITAC received Clean Audit Opinion
49D. REPORT ON HUMAN
RESOURCES
50EDD Personnel Expenditure by Programme for Q3
Programme Total Personnel Training Professional Personnel Average
expenditu expenditure expenditure and special expenditure personnel
re (R’000) (R’000) (R’000) services as a % of cost per
expenditure total employee
(R’000) expenditure (R’000)
Administration
16 177 9 383 156 1 337 58.0% 180
Growth Path
and Social 8 225 7 784 - - 94.6% 324
Dialogue
Investment,
Competition & 3 033 2 843 - - 93.7% 150
Trade
Total 27 435 20 010 156 1 337 72.9% 211
Political Office Bearers are excluded
51Gender Equity
The Department has exceeded the target of 50% in the filled and
funded posts overall.
SMS Male Female Total
Headcount 15 15 30
Percentage 50% 50% 100%
Non-SMS Male Female Total
Headcount 21 44 65
Percentage 32% 68% 100%
EDD Male Female Total
Headcount 36 59 95
Percentage 38% 62% 100%
Political Office Bearers are excluded
52People with disabilities
• The Department has achieved the national target for people with
disabilities of 2%
Male Female Total
Staff with disabilities 1 2 3
Total staff 36 59 95
2.7% 3% 3%
53E. REPORT ON FINANCIALS
54Summary of expenditure for Q3
As at 31 December 2019 the department spent R770.5 million out of an adjusted
allocation of R989.6 million i.e. 78% of the total allocated budget.
Of the R770.5 million spent, transfers to entities made up R675.4 million and
R95.1 million was spent directly by the Department
As at 31 December 2019 expenditure excluding transfers amounted to R95.1
million (Core R32.8 million, Support R62.3 million) out of an allocated budget
of R141.4 million i.e. 67% of the baseline allocation.
The department achieved a total expenditure of 96% (R770.5 million) of the Q3
targeted spent of R798.9 million
The following tables reflect the expenditure against the budget per programme
and per economic classification.
Reasons for Variances:
Compensation of employees: Spending less than projected due to
resignations
Goods and services: Spending more than projected due to increased legal
service cases.
Transfers and Subsidies: Spending less than projections due to non-
payment of penalties by construction companies.
55Cumulative Financial Performance per Programme: Q3
Programmes 2019/20 YTD Variance Spent
Budget actual
Expenditure
R’000 R’000 R’000 %
Administration 85 014 62 190 22 824 73%
Growth Path and Social Dialogue 36 335 24 110 12 225 66%
Investment, Competition and Trade 19 803 8 835 10 968 45%
Transfers and Subsidies 848 491 675 365 173 126 80%
Total including Transfers 989 643 770 500 219 143 78%
Total excluding Transfers 141 152 95 135 46 017 67%
56Cumulative Financial Performance per Programme: Q3
Expenditure per 2019/20 YTD Variance Spent
Economic Classification Budget actual
Expenditure
R’000 R’000 R’000 %
Compensation of
Employees 95 943 63 192 32 751 66%
Goods and Services 44 463 31 447 13 016 71%
Transfers to Entities 848 241 675 285 172 956 80%
Households 250 80 170 32%
Payment of Capital Assets 746 496 250 66%
Total including Transfers 989 643 770 500 219 143 %
Total excluding transfers 46 017 %
141 152 95 135
to entities
57Quarter 3: Transfers to Entities
Q3
Q3 Amount
ENTITIES Amount Transferred
Budgeted to Entities Variance Spent
R’000 R’000 R’000 %
Competition Commission 221 578 221 578 - 100
Competition Tribunal 36 172 36 172 - 100
ITAC 80 196 80 196 - 100
IDC:
- Sefa 181 089 181 089 - 100
- PICC 60 000 60 000 - 100
- Steel Development Fund 35 000 35 000 - 100
- Tirisano Construction Fund 82 000 61 250 20 750 75
Total 696 035 675 285 - 97
58SIYABONGA
59You can also read