30 Gillinbin Creek CATCHMENT MANAGEMENT AREA REPORT - Reef Catchments
←
→
Page content transcription
If your browser does not render page correctly, please read the page content below
WATER QUALITY IMPROVEMENT PLAN 2014 - 2021

CATCHMENT MANAGEMENT AREA REPORT

          30 Gillinbin Creek
Gillinbin Creek: MAP 1
                                                                                                                             Cape
                                                                                SUBCATCHMENT LANDUSECreek

                                                                                                                                    GREENHILL
                                                                                                                                          !

Rocky Dam Creek

                                                                             ILBILBIE
                                                                         !

                                                 Marion Creek

                                                                                        Gillinbin
                                                                                         Creek

Key to land use
   National park or reserve
   Grazing or forestry
   Crop land (cane and horticulture)
   Intensive use (rural residential, transport corridors)
                                                                                                    West Hill Creek
   Urban
   Dam or reservoir
   Wetland

      Town                          Sugar mill
      Highway                      Fish monitoring site
      Catchment boundary           WQ monitoring site
      Aquaculture                  WQ baseline monitoring site
      Weir/dam                 Riparian Vegetation
      Sewage treatment plant       Inadequate riparian vegetation

      Drinking water               Riparian vegetation

      Boat ramp
                                                   Data:
  0          1      2      3        State of Queensland (Department of
                                     Science, Information Technology,                                              CARMILA
                                       Innovation and the Arts) 2014                                           !
             Kilometres
WATER QUALITY IMPROVEMENT PLAN 2014 - 2021

     CATCHMENT MANAGEMENT AREA REPORT

L
                                30 Gillinbin Creek

                                [ Gillinbin Creek Ecosystem Health Rating
                                   Very Good        Good       Moderate    Poor       Very Poo r

                                                           VG

                                                                    G                       The Gillinbin Creek freshwater
          [ FRESHWATER
          Ecosystem Health
                                                                   M
                                                                                  G
                                                                                       [    ecosystem received an overall
                                                                                            score of Good.

                                                                                        [
                                               VP          P                                       Gillinbin Creek drains from the
                                                                                                   Connors Range into the marine and
                                                                                                   estuarine Four Mile Beach Wetlands
                                                                                                   system just south of Yarrawanga Point.
                                                                                                   The catchment area extends down
                                                                                                   the coast along a rocky shore and well
                     [ Total Area by Landuse                                                       developed sand beach. The inshore
                                                                                                   waters are recognised as an important
                       Urban and                    Horticulture                                   fish habitat area supporting regionally
                       Intensive Uses               and Cropping
                                                                                                   significant seagrass beds that are
                         0 ha                        11 ha                                         critical to sustaining local dugong and
                                                                          Sugarcane                turtle populations. Extensive clearing
                                                                          Production               for agricultural production has the
    Wetlands and
    Waterways                                                              546 ha                  capacity to impact on the hydrology
     575 ha                                                                                        of the wetlands and water quality
                                                                                                   entering the site, as well as impacting
                                                                                                   on fish community abundance and
                                                                                                   diversity.
                                                                                                   Management practices that reduce
                                                                                                   atrazine and diuron loads continue to
                                                                                                   be a priority for cane and horticulture
    National Parks                                                                                 production. Grazing management
    and Reserves                                                                                   practices that reduce total suspended
     146 ha                                                                                        sediment can be addressed through
                                                                                                   improved grazing management
                                                                            Grazing and            practices for event water quality.
                                                                            Forestry
                                                                                                   All system repair actions that support
                                                                              11836 ha             an improvement in fish communities
                                                                                                   are the highest priority. Future
               Total hectares Gillinbin Creek                                                      management efforts will also focus
                     13114 ha                                                                      on protecting and improving the
                                                                                                   coastal wetland extent and condition
                                                                                                   to support regeneration of inshore
                                                                                                   seagrass beds.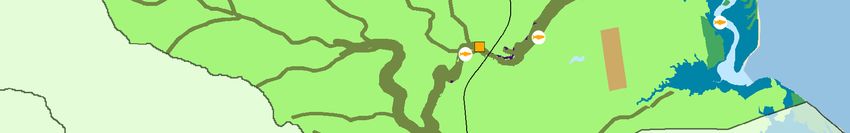
[
                   Ecosystem HEALTH

                   Table 1
                              [    Subcatchment Freshwater Ecosystem Health Indicator Score:
                                   Current Condition 2014 and Target 2021

                              Fish Community          Event Water       Ambient                               Riparian              Barriers to
                                   Health               Quality        Water Quality        Flow             Vegetation             Migration

                                  Current Target      Current Target   Current Target    Current Target     Current Target        Current Target
                                  2014 2021           2014 2021            2014 2021     2014 2021           2014 2021             2014 2021

   [ Gillinbin Creek               M        G          M        G          G         G    G        G          G      VG            VG      VG

                                                                       Very Good         Good          Moderate        Poor           Very Poo r

       Table 1: OVERVIEW

   This index presents the indicators chosen to assess the condition of freshwater ecosystem health. The index uses a
   combination of monitored data and expert opinion to provide a score for the current condition of fish community health,
   event water quality, ambient water quality, flow, riparian vegetation, and barriers to migration for each of the region’s 33
   catchment management areas. The table also presents the target for each indicator to be reached by 2021.

                   Table 2
                              [    Event Freshwater Quality: Current Condition, Targets and Objectives

              Key Pollutant                     Current Condition      Target 2021        Objective 2050             Action              Pollutant Source

                                                             GILLINBIN CREEK SUBCATCHMENT

Dissolved Inorganic Nitrogen μg/L                      43                      42                42                MEDIUM                          CIU

Particulate Nitrogen μg/L                             152                      152               152                  LOW                        CIUG

Filterable Reactive Phosphorus μg/L                     3                       3                  3                  LOW                          CIU

Particulate Phosphorus μg/L                            37                      37                37                   LOW                        CIUG

Total Suspended Sediment mg/L                          66                      66                66                   LOW                        CIUG

Ametryn μg/L
Table 3
[ Action Targets: Ecosystem Health Management
L = Low, M = Moderate, H = High
Condition Planned
Activities to Effort $ Cost
2014 2021
Gillinbin Creek
Table 3: OVERVIEW
Barriers 0 0 L $0
This table presents the on-
(number)
ground management actions
Riparian Vegetation determined to be required to
Management 1357 ha 20 ha H $254,400 improve ecosystem health,
(hectares) including the removal of
barriers to fish migration,
Bank and establishment of riparian
bed stabilisation n/a 9 H
(kilometres)
$901,200 vegetation, bank stabilisation,
and in-stream habitat works.
The table displays the current
In-stream Habitat condition for each component,
Works n/a 2 H $45,000 as well as the planned activities
(number)
to be completed by 2021, the
level of effort required and
Total Cost = $ 1,200,600 associated costs.
Table 4: OVERVIEW
The table below displays the current level of management practices for
Sugarcane/Horticulture, Grazing, and Urban within D, C, B and A Management
Framework classifications at 2014. The table also presents the level of voluntary
adoption of management practices required to meet 2021 objectives and their
associated costs.
Table 4
[ Agriculture ABCD Adoption Targets
2014 Adoption % 2021 Adoption % Total Cost
Land Use
$ ‘000s
D C B A D C B A
GILLINBIN CREEK SUBCATCHMENT
Soil 11% 31% 53% 5% 10% 30% 55% 5% 3
Cane &
Horticulture Nutrient 12% 23% 60% 5% 10% 20% 65% 5% 11
Herbicide 9% 29% 57% 5% 5% 30% 60% 5% 6
Grazing Soil 25% 40% 30% 5% 20% 40% 35% 5% 136
D Dated practice C Common practice B Best practice A Cutting-edge practiceYou can also read