51 7th International Verification Methods Workshop - Annalen der Meteorologie - DWD
←
→
Page content transcription
If your browser does not render page correctly, please read the page content below
Annalen der Meteorologie                    51
 7th International Verification Methods
 Workshop

 03. - 11. May 2017
 in Berlin, Germany

 Programme and Abstracts

Offenbach am Main 2017
Selbstverlag des Deutschen Wetterdienstes

Annalen der Meteorologie                                                     51
7th International Verification Methods
Workshop

03. - 11. May 2017
in Berlin, Germany

Programme and Abstracts

   World Meteorological                World Weather Research   World Climate Research
   Organisation (WMO)                   Programme (WWRP)         Programme (WCRP)

Offenbach am Main 2017
Selbstverlag des Deutschen Wetterdienstes
Conference papers online:
www.dwd.de/EN/ourservices/pbfb_verlag_annalen/annalen.html

Workshop homepage:
www.7thverificationworkshop.de/index.html

ISSN der Online-Ausgabe:   2194-5934
ISSN der Druckausgabe:     0072-4122

ISBN der Online-Ausgabe:    978-3-88148-495-4
ISBN der Druck-Ausgabe:     978-3-88148-496-1

Nutzungsbedingungen:
Dieses Dokument steht unter folgender Creative Commons-Lizenz:

Sie dürfen das Werk bzw. den Inhalt unter folgenden Bedingungen vervielfältigen, verbreiten und öffentlich zugänglich
machen: Sie müssen den Namen des Autors/Rechteinhabers in der von ihm festgelegten Weise nennen. Dieses Werk
bzw. dieser Inhalt darf nicht für kommerzielle Zwecke verwendet werden und es darf nicht bearbeitet, abgewandelt oder
in anderer Weise verändert werden. Mit der Verwendung dieses Dokumentes erkennen Sie die Nutzungsbedingungen an.

Die in dieser Publikation veröffentlichten Texte werden allein von ihren jeweiligen Autoren verantwortet; die darin zum
Ausdruck gebrachte Meinung entspricht nicht notwendig der Meinung des Herausgebers (Deutscher Wetterdienst).

Herausgeber und Verlag:		                   Redaktion:				                              Druck und Bindung:

Deutscher Wetterdienst			                   Martin Göber				                            Druckerei des BMVI
Fachinformationsstelle und 		               Deutscher Wetterdienst			                   Robert-Schumann-Platz 1
Deutsche Meteorologische Bibliothek         Forschung und Entwicklung		                 53175 Bonn
Frankfurter Straße 135			                   Frankfurter Str. 135
63067 Offenbach am Main			                  63067 Offenbach am Main
www.dwd.de/bibliothek			                    Martin.Goeber@dwd.de
bibliothek@dwd.de
Foreword
“Forecast verification methods across time and space scales“
On behalf of the organising committee of the 7th International Verification Methods Workshop we would like
to welcome you in Berlin, Capital of Germany, a place of an eventful history, of great cultural treasures, scien-
tific discoveries and technological inventions, a city with a vibrant life and a diverse and tolerant population.
After Boulder, Montreal, Reading, Helsinki, Melbourne and New Delhi the Seventh in the very successful
series of verification methods workshops has returned to Europe, to bring together almost 40 students and about
80 presenters from 35 countries from all continents from national and private weather services, from universi-
ties and research institutions and intergovernmental organisations to teach and learn and discuss and enjoy the
growing multitude of methods of verification of weather forecasts and warnings, climate predictions, and their
applications.
The workshop starts with a tutorial on forecast verification methods (May 3 - 6) with lectures and hands-on
laboratory sessions using the R statistical language. It will be hosted by the Max-Planck-Institute for Human
Development.
The workshop continues with the science conference (May 8 - 11) including keynote talks along with contribu-
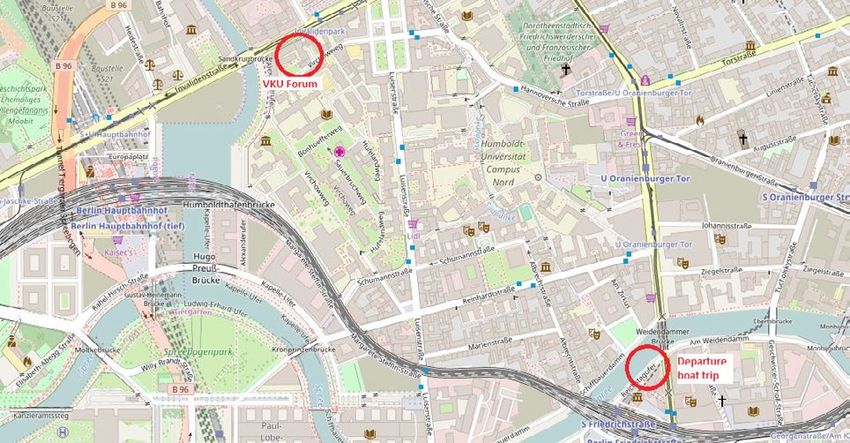
ted presentations and posters. This will take place in the „VKU Forum“ in Berlin-Mitte.
The workshop has been organised by the WMO Joint Working Group on forecast Verification Research, jointly
with the Free University of Berlin, the Max-Planck-Institute for Human Development, the Hans-Ertel-Centre
for Weather Research (HErZ) and the German Weather Service DWD.
In this booklet you will find the schedule of the science conference, the abstracts of the talks and posters, a
description of the venue, how to get lunch at the university canteen (the „Mensa“) and how to find the way to
the start of the conference dinner - a boat trip through the city of Berlin!
We forecast days of great talks, posters, discussions, spirits, food and weather - please verify!
Martin Göber
34
Content

1. Venue.................................................................................................................... 6
  1.1 Tutorial Venue.......................................................................................................................... 6
  1.2 Conference Venue.................................................................................................................... 7

2. Public Transport................................................................................................. 9
3. Lunch................................................................................................................. 10
4. Ice Breaker/Conference Dinner ...................................................................... 11
5. Timetable........................................................................................................... 12
6. Oral Presentations............................................................................................ 19
7. Poster Presentations.......................................................................................... 45

                                                                                                                                                   5
1. Venue
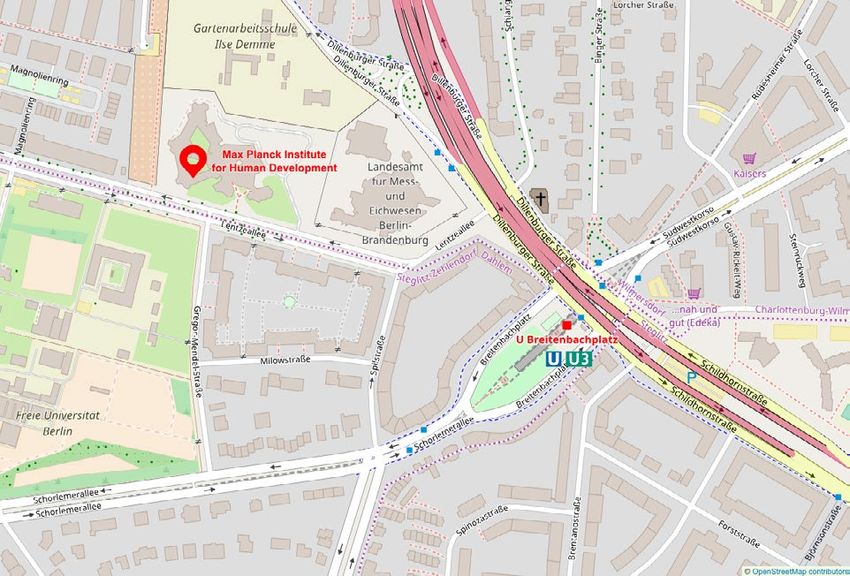
1.1 Tutorial Venue
The tutorial will take place at the
Max-Planck-Institute for Human Development (MPIB)
Lentzeallee 94
D-14195 Berlin
The MPIB is a 5-minute walk from the underground station Breitenbachplatz.
Public Transport
From station Zoologischer Garten:
Take the underground (U-Bahn) line U9 going to Rathaus Steglitz. At the subway station Spichernstraße get off
and change to the subway line U3 going to Krumme Lanke and get off at Breitenbachplatz station.
The MPIB is a 5-minute walk from Breitenbachplatz (see map).
61.2 Conference Venue
The conference will take place at the
VKU Forum
Invalidenstraße 91
D-10115 Berlin
Public Transport
Arriving by plane
From Tegel Airport:
Take the Bus TXL in direction S+U Berlin Hauptbahnhof and get of at the stop Invalidenpark which is just in
front of VKU Forum (about 20 minutes).
From Schönefeld Airport:
Take either the regional train (Regionalbahn) RB7 in direction Dessau, RB14 in direction Nauen or RB19 in
direction S+U Gesundbrunnen Bhf and get of at the stop S+U Berlin Hauptbahnhof. Than take any of the op-
tions listed below!
7Arriving by train
From Berlin-Hauptbahnhof (main railway station):
Take one of the following services and get of at the stop Invalidenpark (about 2 minutes)
• Tram M5 in direction Zingster Straße
• Tram M8 in direction Ahrensfelde/Stadtgrenze
• Tram M10 in direction S+U Warschauer Straße
• Bus 123 in direction Robert-Koch-Platz
• Bus 142 in direction S Ostbahnhof
• Bus 147 in direction S Ostbahnhof
• Bus 245 in direction Robert-Koch-Platz
Otherwise, it is a 5-10 minutes walk from Berlin-Hauptbahnhof (see map). From the exit “Europaplatz” turn
right and follow „Invalidenstraße“ for about 600 m.
From station Zoologischer Garten:
Take Bus 245 or the commuter train (S-Bahn) S5 in direction Hoppegarten or S75 in direction Wartenberg to
Berlin-Hauptbahnhof, then take one of the services above.
82. Public Transport
For all information about public transport in Berlin by commuter train (S-Bahn), underground (U-Bahn), Tram
and Bus with journey planner, citymap, routemap, ticket and traffic information see http://www.vbb.de/en/
index.html. A (copyrighted) map of the city trains and underground can be found here, which you might
find useful to download: http://images.vbb.de/assets/downloads/file/1193159.pdf. The city of Berlin and the
surrounding suburbs have been organized into three tariff zones A, B and C. You can buy tickets for the com-
bined zones AB, BC or ABC, as needed. Normally you need Berlin AB.
Adults pay regular fare. The different forms of tickets are: single – day – weekly.
Ticket Berlin AB Prices
Single ticket 2,80 €
Single ticket 4-trip-ticket 9,00 €
Day ticket 7,00 €
7-Day-ticket 30,00 €
Single Tickets must be validated immediately on starting travel. These tickets are not transferable after the
journey has been started. They are valid for a maximum of two hours. Within the two-hour validity of the Sin-
gle Ticket you may change trains/buses etc. or interrupt your journey as often as you wish. Return trips (back
to the starting point) and round trips (journeys that take a different route from the outbound journey) are not
permitted. Single tickets are available also as 4-trip-ticket.
Day tickets must be validated on starting travel. They are not transferable after the journey has been started.
With a Day ticket you can travel as often as you want on the day printed on the ticket or from validation of the
ticket on starting your journey until 3.00 a.m. on the following day.
7-Day-Tickets must be validated before starting your first journey. The 7-Day-Ticket is valid for seven
consecutive calendar days. Validity begins on the first day of the validity period printed on the ticket or from
the time of validation and ends on the seventh calendar day, at midnight. For example, from validation at 9.30
a.m. on a Tuesday until midnight on the following Monday. The Ticket is transferable and can also be used from
other persons.
Tickets can be purchased conveniently at one of the many sales points or at the ticket machines that can be
found at all stations, transfer points, and inside the trams or directly from the bus driver. Please do not forget
to validate your ticket before starting your journey! Ticket validation machines are located on all platforms
at the S-Bahn and U-Bahn stations and in case of trams and buses inside the vehicles.
It is not necessary to validate tickets that are purchased directly from the driver in buses. Please board buses
through the forward door; pre-purchased tickets must be displayed to the driver upon entry.
Arriving at Berlin’s airports
Airport Tegel
Bus connections to Berlin city centre direction
Express bus TXL Alexanderplatz (city center east)
Express bus X9 S + U Zoologischer Garten (city center west)
Bus 109 S + U Zoologischer Garten
Bus 128 U Osloer Straße
Airport Schönefeld
The Airport Express – just 28 minutes from Central Station to Schönefeld Airport. Specially marked
regional train lines RE7 and RB14 run daily every 30 minutes (5am - 11pm) between several city
stations and the airport. Local public transport tickets are accepted on these trains. The journey is
within fare zone ABC.
S-Bahn: Lines S45 and S9
Buses: SXF1, X7, 162, 163, 171, N60, N70
93. Lunch A lunch opportunity at the university canteen “Mensa Nord”, 7 minutes walk from the conference venue (see map conference venue) What to eat? The daily menu you can check before at: https://www.studentenwerk-berlin.de/en/mensen/speiseplan/hu_nord/index.html How to pay? You can make cashless payments with the MensaCard. The MensaCard is a rechargeable smart card on which only the amount and card number are stored. Personal data such as names, frequency of use or personal preferences for certain foods are not stored at any point. The MensaCard for use during the conference days will be handed out at the conference registration on Monday. PLEASE have 10 EURO available, it is pre-loaded with an amount of 8,45 EURO (1,55 EURO deposit, paid back at return). Please give the MensaCard back at the registration desk when leaving the conference. Place the card flat on the reading area of the card reader at the checkout after choosing your meal. The balance is shown at the top of the display. The amount to be deducted is shown at the bottom of the display. After deduction of the debit amount shown at the bottom, the new card balance is shown at the top of the display. How are MensaCards recharged? Cards are recharged at the recharging terminals set up for this purpose. They can be recharged by inserting bank notes with a value of 5, 10, 20 or 50 euro. The amount inserted is shown on the display. After inserting the money, hold the card directly in front of the card reader and wait until the new balance is shown. When it appears, the card has been successfully recharged. At facilities without a recharging terminal, you can recharge your MensaCard at the checkouts. How can I check the balance on the card? Hold the card in front of the card reader of a recharging terminal. The balance is shown on the display. Before choosing your meal, please check the balance on your MensaCard. How can I return the card to receive the deposit? The cards are simply returned at the last checkout at the respective checkout, and the credit balance and deposit are paid out. 10
4. Ice Breaker/Conference Dinner

There will be two parties during the conference: the ice breaker party at the end of the program on Monday at
the venue and the conference dinner in the evening of Wednesday (see Boat trip).

Boat-trip
The conference dinner in the evening of Wednesday, May 10, will be combined with a boat trip underneath the
bridges of the Spree passing by the sights of Berlin.

Departure landing stage:         Friedrichstraße (address: Reichstagufer 18, in front of the Tränenpalast, north
				                             of the train station Friedrichstraße)

Departure: 			                   7 pm (boarding starts 25 min. prior to departure)
Return: 			                      11 pm

Please don’t forget the ticket for the dinner, which will be handed out to you at the registration.

Public transport

From Invalidenpark (VKU)
BUS 147 in direction S Ostbahnhof        → S/U Friedrichstraße

From U Naturkundemuseum
Take one of the following services and get of at the stop S/U Friedrichstraße

  •   U         U6 in direction U Alt-Mariendorf
  •   Tram      12 in direction Mitte, Am Kupfergraben

Otherwise, it is a 25-30 minutes walk from VKU (1,5 km). From the exit VKU turn right and follow "Invaliden-
straße" for about 200 m. Turn right into “Hannoversche Straße”, after 500 m turn right into “Friedrichstraße”,
after 700 m on the other side of the river “Spree”, right from the “Weidendammer Brücke” you will see the
landing stage (“Bruno Winkler”).
                                                                                                              11
5. Timetable
Sessions
HIW Verification of high impact weather and extremes
META Meta-verification, properties of verification methods
OBS UNC Observation uncertainty
USR VAL User-oriented verification and estimation of forecast value
PROB ENS Methods for verification of probability and ensemble forecasts
SPATIAL Spatial verification methods and verification approaches
OPS SOFT Software and measures used to evaluate operational predictions, including
verification methods used to justify upgrades to operational models.
S2S Sub-seasonal to seasonal
CLIM Climate
MISC Verification studies
Time Session Title First Name Surname Organization Country
Monday
10:00-11:00 Registration
Poster
hanging
11:00-11:20 Welcome
remarks
11:20-12:00 HIW Verification for High Beth Ebert Bureau of Australia
key-note Impact Weather Meteorology
12:00-12:20 HIW Verification of Petra Friederichs Meteorological Germany
extremes based on Institute,
extreme value theory University of
Bonn
12:20-12:40 HIW Verification of Maxime Taillardat CNRM/Météo- France
extremes using France
proper scoring rules
and extreme value
theory
12:40-14:00 lunch
14:00-14:20 HIW Exploring the Brian Golding Met Office UK
forecasting and
warning value chain
in HIWeather
14:20-14:40 HIW Development of Hong Guan SRG at EMC/ United
verification NCEP/NWS/ States
methodology for NOAA
extreme weather
forecasts
12Time Session Title First Name Surname Organization Country
14:40-15:00 HIW Forecaster‘s Sebastian Lerch Heidelberg Germany
Dilemma: Extreme Institute for
Events and Theoretical
Forecast Evaluation Studies and
Karlsruhe
Institute of
Technology
15:00-15:40 USR Economic Assess- Jeff Lazo National Center USA
key note ment of Hydro-Met of Atmospheric
Services and Research
Products: A Value
Chain Approach
15:40-16:00 coffee break
16:00-16:20 USR A user-oriented Maria Tesini Arpae-SIMC Italy
verification Stefania
methodology for
wind forecast.
16:20-16:40 USR User-oriented Beth Ebert Bureau of Australia
evaluation of fire Meteorology
spread predictions
16:40-17:00 USR Develop a user William Wang Australian Australia
oriented forecast (Xiang- Bureau of
verification metric dong) Meteorology
17:00-17:20 USR The final approach? Michael Sharpe Met Office UK
Verification of
Terminal Aerodrome
Forecasts
17:20-17:40 USR Displaying the Ve- Jadran Jurkovi Croatia Control Croatia
rification Results of Ltd
Terminal
Aerodrome Forecasts
for Thunderstorms
and Visibility
17:40-18:00 Discussion Facilitators: Beth
HIW & Ebert, Jeff Lazo,
USR Brian Golding
18:00-22:00 Ice breaker
13Time Session Title First Name Surname Organization Country
Tuesday
8:20-9:00 META Forecast verification Chris Ferro Exeter UK
key note using scoring rules University
9:00-9:20 META Proper and equitable Zied Ben ECMWF UK
scores: a resolved Bouallegue
dilemma
9:20-9:40 META The generalized Roger Harbord Met Office UK
discrimination score:
connections,
corrections and
potential applications
9:40-10:00 META Decomposition and Fanglin Yang Environmen- USA
Attribution of tal Modeling
Forecast Errors Center, Natio-
nal Centers for
Environmental
Prediction
10:00-10:40 coffee break
10:40-11:00 META Murphy diagrams Alexander Jordan Heidelberg Germany
Institute for
Theoretical
Studies
11:00-11:20 META Verification of Tim Bullock Meteorological Canada
Multi-Valued Service of
Forecasts Canada
11:20-11:40 ENS Ensemble Sabrina Wahl Hans-Ertel- Germany
verification: Old Centre for
scores, new Weather Re-
perspectives search / Uni-
versity of Bonn
11:40-12:00 ENS Increasing the Jan Keller Hans-Ertel- Germany
usability of analysis Centre for
rank histograms Weather Re-
search / Deut-
scher Wetter-
dienst
12:00-12:20 ENS Another look at Åke Johansson Swedish Me- Sweden
spread and skill teorological
and Hydrolo-
gical Institute
(SMHI)
12:20-12:40 Discussion Facilitators: Chris
META ENS Ferro, Barb Brown,
Chiara Marsigli
12:40-14:00 lunch
14Time Session Title First Name Surname Organization Country
14:00-14:20 ENS-spatial The development of Yuejian Zhu Environmen- U. S. A
probabilistic forecast tal Modeling
verification across Center, NCEP/
the scales NWS/NOAA
14:20-14:40 ENS-spatial Generating and Craig Schwartz National Center USA
verifying of Atmospheric
probabilistic forecasts Research
from convection-
allowing ensembles
using neighborhood
approaches: A review
and recommenda-
tions
14:40-15:00 ENS-spatial Benefit of an Marion Mitter- Met Office UK
ensemble over a maier
deterministic forecast
at km-scale
15:00-15:20 OPS- The difficulty of Alan Geer ECMWF UK
inference verifying small
improvements in
forecast quality
15:20-15:40 OPS- Methods for Elizabeth Weather- University of USA
inference Identifying Small head Colorado
Improvements in
Forecasts
15:40-16:00 Discussion Facilitators: Chris
ENS Ferro, Marion
inference Mittermaier,
Chiara Marsigli
16:00-16:20 coffee break
16:00-18:00 poster all
session
15Time Session Title First Name Surname Organization Country
Wednesday
8:30-8:40 intro verif The verification Beth Ebert Bureau of Australia
challenge challenge Meteorology
8:40-9:20 Key note: Verification of Helge Goessing Alfred Wege- Germany
verification user-relevant ner Institute
challenge contours with the
winner Integrated Ice Edge
Error and the Spatial
Probability Score
9:20-9:40 SPATIAL Verification of Barbara Casati Meteorologi- Canada
sea-ice prediction by cal Research
using distance Division,
measures Environment
and Climate
Change Canada
9:40-10:00 SPATIAL Comparing distance Eric Gilleland National Center U.S.A.
methods for spatial for Atmosphe-
verification ric Research
10:00-10:40 coffee break
10:40-11:00 SPATIAL Estimating the Gregor Skok Faculty of Slovenia
displacement in Mathematics
precipitation and Physics,
forecasts using the University
Fractions Skill Score of Ljubljana,
Ljubljana, Slo-
venia
11:00-11:20 SPATIAL A multi-model, Stefano Mariani ISPRA - Italy
multi-analysis study Institute for
to asses the capability Environmental
of CRA analysis for Protection and
QPF spatial Research
verification in the
MesoVICT
framework
11:20-11:40 SPATIAL Evaluation of Extra- Tara Jensen National Center USA
Tropical Cyclones for Atmosphe-
Using a Feature- ric Research/
Relative Method Research Ap-
plications Lab
11:40-12:00 SPATIAL Methods for Barbara Brown NCAR United
Evaluation of Cloud States
Predictions
12:00-12:20 SPATIAL Grid-based spatial Johannes Jenkner UBIMET Austria
verifications versus GmbH
point-based
verifications with the
application to precipi-
tation and clouds
16Time Session Title First Name Surname Organization Country
12:20-12:40 Discussion Facilitators: Manfred
SPATIAL Dorninger, Eric Gil-
leland, Barb Brown
12:40-14:00 lunch
14:00-14:20 SOFT-ops- A Unified Approach Tara Jensen National Center USA
spatial to Verification for Atmosphe-
ric Research/
Research Ap-
plications Lab
14:20-14:40 OBS UNC Evaluating Thomas Haiden ECMWF United
representativeness Kingdom
errors in verification
against Arctic
surface observations
14:40-15:00 OBS UNC Spatial verification Sabine Radano- LSCE France
of ensemble forecasts vics
with SAL and the
role of observation
uncertainty
15:00-15:20 OBS UNC Considering Manfred Dorninger University of Austria
observation uncer- Vienna
tainty for verification
of forecast ensembles
15:20-15:40 OBS UNC Impact of gridded Marion Mitter- Met Office UK
truth resolution on maier
spatial verification
scores“
15:40-16:00 Discussion Facilitators: Thomas
OBS UNC Haiden, Manfred
Dorninger, Marion
Mittermaier
16:00-16:20 coffee break
16:20-18:00 tutorial
project
presentation
19:00- Conference all
23:00 Dinner:
Boat trip
17Time Session Title First Name Surname Organization Country
Thursday
8:20-9:00 CLIM Drift in Decadal Henning Rust Freie Germany
key note Prediction: a Universität
Particular Challenge Berlin
for Verification
9:00-9:20 CLIM Freva - Freie Univ Christopher Kadow Freie Germany
Evaluation System Universität
Framework for Berlin
Scientific
Infrastructures in
Earth System
Modeling
9:20-9:40 CLIM Joint uncertainty Omar Bellprat Earth Sciences, Spain
assessment of models Barcelona Su-
and observations in percomputing
verification of clima- Centre (BSC)
te predictions.
9:40-10:00 CLIM Useful evaluations Caspar Ammann National Center United
of variability and for Atmosphe- States
change in simulated ric Research
climate for impact
studies
10:00-10:40 coffee break
10:40-11:20 S2S Sub-seasonal to Frederic Vitart ECMWF United
key note seasonal forecast Kingdom
Verification
11:20-11:40 S2S Evaluation and Jonas Bhend Federal Office Switzer-
Quality Control of Meteorology land
for the Copernicus and Climatolo-
Seasonal Forecast gy MeteoSwiss
Systems
11:40-12:00 S2S Evaluating Sub- Gloria Recalde Department of United
seasonal hindcast Earth and Pla- States
using an objective netary Science,
regionalization ap- Johns Hopkins
proach University
12:00-12:20 Discussion Facilitators: Caio
CLIM S2S Coelho, Frederic Vit-
art, Henning Rust
12:20-13:00 Workshop
wrap-up
discussion
13:00-onwards lunch and networking
186. Oral Presentations
HIW-1 KEY NOTE: Verification for High Impact Weather
AUTHORS: Ebert, Beth.
Presenting author e-mail: beth.ebert.@bom.gov.au; Affiliation (all authors): Bureau of Meteorology, Mel-
bourne, Australia
ABSTRACT: Timely and accurate forecasts for high impact weather can prompt people to take protective ac-
tion. Understanding the forecast quality is critical to using it effectively, so high impact weather forecasts must
be verified in ways that are meaningful to users in the public, emergency management, government, industry,
and other sectors. In 2016 WMO kicked off a 10-year High Impact Weather (HIWeather) project to improve
forecasts on timescales of minutes to weeks and enhance their utility in social, economic and environmental
applications. HIWeather activities are focused around five weather hazards: urban flood, wildfire, localised
extreme wind, disruptive winter weather, and urban heat waves and air pollution. Forecasts and warnings for
these types of extreme events usually depend on numerical weather prediction at lead times beyond a few hours
and nowcasts at shorter time ranges, with ensemble and probabilistic approaches often used to account for fore-
cast uncertainty. While this reflects scientific best practice it immediately throws up a challenge for verifying
individual events where people want to know whether or not the (probabilistic) forecast was correct. Good ob-
servational data for extreme events may be hard to obtain and often contain significant uncertainties in timing,
location, and magnitude. New verification approaches are being developed to explicitly account for uncertainty
in the observations. High impact weather verification has tended to use the same statistical approaches that
are used for everyday weather forecasts. Categorical extreme dependency scores show better behaviour for
rare extreme events than traditional threat and skill scores and are coming into common use, especially for
assessing competing forecast systems. Spatial verification approaches are also widely used for high resolution
forecasts to give credit to close forecasts. To make verification more meaningful for users outside the weather
community, new scores have been proposed that are more relevant to the way people make their decisions. As
we move toward predicting hazard impacts such as storm damage, poor health outcomes, etc., an important
topic of research will be how best to collect and use new types of observations, including from social media,
in verification. This talk will highlight challenges that come with verifying forecasts for high impact weather.
It will describe some of the activities being undertaken in the HIWeather project, and show examples of new
verification approaches that are being applied to evaluate forecasts of weather hazards.
HIW-2: Verification of extremes based on extreme value theory
AUTHORS: Friederichs, Petra; Wahl, Sabrina.
Presenting author e-mail: pfried@uni-bonn.de; Affiliation (all authors): Meteorological Institute, University of
Bonn, Bonn, Germany
ABSTRACT: Extremes are per definition rare events, and thus standard verification approaches often provide
only degenerated measures in the limit of extremes. This is partially due to different convergence rates of the
respective measures. Extreme value theory (EVT) provides a limit law for extremes, and thus a methodology
to mathematically describe the behavior of extremes in a quite universal way. Chris Ferro (2007) makes use of
limit laws in EVT to provide estimates of entries in the contingency table in case of extremes. We follow this
line and explore verification approaches using EVT for univariate, multivariate or spatial extremes.
19HIW-3: Verification of extremes using proper scoring rules and extreme value theory AUTHORS: Taillardat, Maxime; Fougères, Anne-Laure; Naveau, Philippe; Mestre, Olivier. Presenting author e-mail: maxime.taillardat@meteo.fr; Affiliation (all authors): CNRM/Météo-France, Lyon, France ABSTRACT: In meteorology, quantitative verification of extremes is quite difficult. Hedging or weighting strategies can be employed, especially with some versions of the Continuous Ranked Probability Score (CRPS), but it can lead to improper or degenerative scores. We propose here to assess verification of extremes focu- sing on CRPS‘s distribution. Studying the behaviour of the CRPS for extreme events and using extreme value theory, we make a link between extreme values of the CRPS and the CRPS for extreme events. We exhibit a new quantity for the verification of extreme events, based on the CRPS, which can be estimated by leveraging extreme value theory. HIW-4: Exploring the forecasting and warning value chain in HIWeather AUTHORS: Golding, Brian. Presenting author e-mail: brian.golding@metoffice.gov.uk; Affiliation (all authors): Met Office, Exeter, UK ABSTRACT: The WMO High Impact Weather (HIWeather) project has been established to promote research in areas of physical and social science that will improve forecasting and warning systems for weather-related hazards. The end result of any warning system is that a population of warning recipients makes a set of deci- sions that may reduce suffering and economic loss. It is increasingly important that forecasting and warning systems can demonstrate that investment will lead to increased value, in terms of reduced suffering and loss. In this talk, I will explore the nature of the forecasting and warning system; the relationship between skill and value; where and why value is gained and lost; and what sorts of measurements might contribute in an end-to- end assessment of the value chain. Examples will be given of candidate metrics at each stage of the value chain, emphasising the challenges in obtaining validation data, in achieving statistical significance and in relating the scores to each other. 20
HIW-5: Development of verification methodology for extreme weather forecasts

AUTHORS: Guan, Hong; Zhu, Yuejian.

Presenting author e-mail: hong.guan@noaa.gov; Affiliation (all authors): SRG at EMC/NCEP/NWS/NOAA,
College Park, United States

ABSTRACT: In past years, the forecast skill has been improved significantly from many areas. Those are ob-
servation system, data assimilation, numerical modeling, and ensemble forecasting. Today, ensemble forecast
routinely provides essential information on the probability of specific events. A predictive skill now extends in
some case beyond 10 days, with an increasing capability to give early warning of severe weather events many
days ahead. One of North American Ensemble Forecast System (NAEFS) applications is producing anomaly
forecast (ANF) from bias corrected NCEP and CMC‘s global ensemble forecasts and analysis climatology since
2006. Later on, the extreme forecast index (EFI) has been introduced to predict extreme weather events those
based on raw ensemble forecast and model climatology. Although the extreme weather forecast products, such
as ANF and EFI, have been generated in real time daily operation, and the applications are widely used in many
areas, the verification of the products has been a challenge. Without valuable verification tool, the performance
of these products is still uncertain, especially for ensemble upgrade. In this work, we develop a verification me-
thod to evaluate the relative ability of the ANF and EFI in predicting extreme events. In this study, we quantify
the relationship between ANF and EFI and find the equivalent threshold values for identifying extreme events
from the two algorithms. Then we establish binary contingency table based on the selected threshold values for
different applications to calculate statistic scores, such as hit rate, false alarm rate, frequency bias and equitable
thresh score for each product. Finally, a previous developed visualization tool (performance diagram) is used to
identify relatively better extreme weather forecast products. The verification methodology has been applied to
examine extreme cold and extreme precipitation forecasts, the results will be presented as well.

HIW-6: Forecaster‘s Dilemma: Extreme Events and Forecast Evaluation

AUTHORS: Lerch, Sebastian; Thorarinsdottir, Thordis L.; Ravazzolo, Francesco; Gneiting, Tilmann.

Presenting author e-mail: Sebastian.Lerch@h-its.org; Affiliation (all authors): Heidelberg Institute for Theore-
tical Studies and Karlsruhe Institute of Technology, Karlsruhe, Germany

ABSTRACT: In public discussions of the quality of forecasts, attention typically focuses on the predictive
performance in cases of extreme events. However, the restriction of conventional forecast evaluation methods
to subsets of extreme observations has unexpected and undesired effects, and is bound to discredit skillful
forecasts when the signal-to-noise ratio in the data generating process is low. Conditioning on outcomes is
incompatible with the theoretical assumptions of established forecast evaluation methods, thereby confronting
forecasters with what we refer to as the forecaster‘s dilemma. For probabilistic forecasts, proper weighted sco-
ring rules have been proposed as decision-theoretically justifiable alternatives for forecast evaluation with an
emphasis on extreme events. Using theoretical arguments, simulation experiments, and a case study on proba-
bilistic wind speed forecasts, we illustrate and discuss the forecaster‘s dilemma along with potential remedies.

                                                                                                                   21
USR VAL-1 KEY NOTE: Economic Assessment of Hydro-Met Services and Products: A Value Chain Approach AUTHORS: Lazo, Jeffrey K.. Presenting author e-mail: lazo@ucar.edu; Affiliation (all authors): Societal Impacts Program, National Center for Atmospheric Research, Boulder, United States ABSTRACT: As many in the forecast verification community already know, weather related hazards such as typhoons, floods, heat waves, droughts, and tornadoes cause billions of dollars of damage and affect millions worldwide in both developed and developing countries. Between 2004 and 2013 an annual average of 127 me- teorological, 32 climatological, and 192 hydrological disasters affected an average of 191 million people each year, and caused an average annual $122 Billion dollars of damages (Guha et al 2015). “Day-to-day“ events (not considered “disasters“) likely have an even larger aggregate impact on society and affect virtually everyone on the planet in some manner every year “ if not every day! While not all (or perhaps even most) of the impacts can be avoided or mitigated, with appropriate information systems and processes there are undoubtedly significant societal benefits of geo-spatial information on weather, water, and climate. Developing a better understanding of the socio-economic value of hydro-met information is the focus of some recent efforts (WMO 2015). In this talk I’ll present the concept of the “Weather Information Value Chain“ as a tool for understanding the creation of value from hydromet information as well as explicating the difficulties of valuation and opportunities for va- lue enhancement. Building on the information value chain concept, I offer that economics as a study of human behavior and decision making can help in understanding the weather related decision making process and thus enhance product development, communication approaches, and ultimately decision making to increase societal value. I’ll discuss the relationship between forecast verification and economic benefit analysis and the develo- ping concept of user-relevant verification. This topic will hopefully provide grounds for further discussion with the verification community as it is truly a concept in progress! Time permitting, I’ll present several examples of valuation of hydromet information in the context of a “value chain“ including a study on research to improve forecasting for utility scale solar power generation (Haupt et al. 2016). Finally I’ll briefly note some factors re- lated to explication through the value chain model including (1) alternative methods for characterization of the information value process (Lazo et al 2016), (2) the significant opportunity for the application of concepts from behavioral economics for better understanding responses to hydro-met information, (3) the context, concept, and measurement of vulnerability and resilience within which the Weather Information Value Chain is embed- ded, and (4) ethical frameworks that could be more explicitly articulated in the process of value assessment as well as in decision-making for improving weather information processes. 22
USR VAL-2: A user-oriented verification methodology for wind forecast.

AUTHORS: Tesini, Maria Stefania.

Presenting author e-mail: mstesini@arpae.it; Affiliation (all authors): Arpae-SIMC, Bologna, Italy

ABSTRACT: The 10-m wind is a weather parameter characterized by strong dependence on orographic and
topographic details and high temporal variability. Therefore the verification of wind forecast requires a metho-
dology taking into account these features. On top, any verification method should be tailored for the specific
purpose defined by the user of that forecast, being the developer of the model, the forecaster in the operational
room or the stakeholder for a practical application. In this work, the 10-m wind predicted by the COSMO model
run at 7 and 2.8 km over Italy (COSMO-I7 and COSMO-I2 suites respectively) is verified for its use in fore-
casting the possible occurrence of sea storms over the Adriatic Sea. For this purpose, verification is performed
over a set of coastal stations. A novel summary-plot of the scores derived from the contingency table is here
presented, denominated “Performance Rose“. In a wind-rose plot, the observed wind frequency is represented
subdivided into the usual 8 sectors. In additions to this, the scores for each sector (i.e. for each direction) are also
represented: the Frequency Bias by the colour of the wind-rose “petal“, the Probability of Detection, the Threat
Score and the Success Ratio by symbols on the appropriate scale (from 0 to 1 for all of them) plotted in the ra-
dial axes. The verification is performed on each station point separately to take into account the dependence of
the low-level wind on the topography. It is also possible to aggregate the forecast issued by the model within a
radius as predictor of the wind on the same point, in order to increase the statistical robustness of the estimate.
The high temporal variability of the parameter can be also taken into account by performing the verification
on appropriate time intervals, considering the prevailing wind speed and direction in each interval. The per-
formance of this verification methodology is shown on selected periods, including different kinds of weather
events, focusing on the information which can be derived from this approach.

                                                                                                                     23
USR VAL-3: User-oriented evaluation of fire spread predictions AUTHORS: Beth Ebert1, Chris Bridge2, Nathan Faggian2, Barbara Brown3, Paul Fox-Hughes1, Howard Jacobs2, Stuart Matthews4, Greg Esnouf5 Presenting author e-mail: beth.ebert@bom.gov.au; Affiliations: 1Research and Development Branch, Bureau of Meteorology, Australia, 2Weather Forecasting Branch, Bureau of Meteorology, Australia, 3Research Appli- cations Laboratory, National Center for Atmospheric Research, USA, 4New South Wales Rural Fire Service, Australia, 5Australasian Fire and Emergency Service Authorities Council, Australi ABSTRACT: Fire and land management agencies in Australia and elsewhere increasingly rely on physical and empirical fire spread models to provide decision support and risk modelling capability for incident management and planned fuel reduction activities. However, it is widely acknowledged that fire spread modelling is subject to numerous shortcomings including limitations in the underlying equations that relate the rate of fire spread to the fuel state, weather conditions and topography. Moreover, there are significant uncertainties in the ignition, fuel and weather inputs required to drive the models. Fire behaviour analysts (FBANs), the main users of fire models, need information to help decide which model(s) to use and how much confidence to place in their out- put. The Bureau of Meteorology is collaborating with regional fire services, universities, and NCAR to develop an evaluation framework to help FBANs make informed choices on fire spread models. A generic software framework enables different fire spread models to be installed and run in a consistent way. We gathered reliable observations of burned areas for a number of wildfire events from around Australia to verify model predictions of fire area, spread rate and direction, which are amongst the variables of greatest interest to FBANs. We ran the models using the best operational weather and ignition inputs, as well as inputs with realistic levels of uncer- tainty applied. An early finding was the large sensitivity of some models to small deviations in ignition location, which led the NSW Rural Fire Service to change the way they ran the fire model in operations. Communicating the accuracy and the sensitivity of the models to users in a concise yet understandable way has been challenging given the multi-dimensional nature of the evaluation. We have found a way to display accuracy and sensitivity together using an enhanced Hinton (matrix) diagram that portrays accuracy using color and sensitivity using boxes of different size. Categorical performance diagrams are used to inter-compare the performance of diffe- rent models. Continuous consultation with the end-users has been a critical component of this effort, producing an evaluation which will maximize value for decision makers. 24
USR VAL-4: Develop a user oriented forecast verification metric

AUTHORS: Wang, William (Xiangdong); Watkins, Andrew; Jones, David.

Presenting author e-mail: William.Wang@hotmail.com; Affiliation (all authors): Australian Bureau of Meteo-
rology, Melbourne, Australia

ABSTRACT: Climate Information Services (CIS) of the Bureau of Meteorology has been issuing the national
seasonal ‚above median‘ probability outlooks for rainfall and maximum and minimum temperature public eve-
ry month (http://www.bom.gov.au/climate/outlooks). Verification of these outlooks is considered a key aspect
of the service. The Bureau calculates a number of verification metrics for these probability forecasts, including
LEPS, Brier Score and ROC score. However, these metrics have been found to be difficult to communicate
and interpret. Instead, percent-consistent (PC) is used to show the skill of forecasts. But a critical issue of PC
is it doesn‘t consider the magnitude of the actual outcome. A skilful forecast model is expected to capture the
significant and predictable part of the variation, and such capability is not assessed by PC or the other metrics
mentioned above. To keep the simplicity of PC but tackle the issue and improve the effectiveness of this metric,
the so called “weighted percent consistency (WPC)“ is designed in this paper. The paper has then approved that
observed anomaly above climatological median is the most appropriate weighting element among the general
statistics, such as deciles, percentage (for rainfall only), anomaly from climatological mean etc. The paper also
demonstrated that WPC satisfies the general rules of skill metric, and it is robust, intuitive and easy to calculate.
Reference skill is 0.5, below 0.5 represents no skill, and the skill for perfect forecast is 1.

USR VAL-5: The final approach ? Verification of Terminal Aerodrome Forecasts

AUTHORS: Sharpe, Michael; Bysouth, Clare.

Presenting author e-mail: michael.sharpe@metoffice.gov.uk; Affiliation (all authors): Met Office, Exeter, UK

ABSTRACT: Terminal Aerodrome Forecasts (TAFs) are a widely accepted international form of aviation
forecast used for airport and flight planning procedures at all major airports; these abbreviated text forecasts
contain probabilistic, deterministic and temporal uncertainty terms which make verification challenging. This
presentation outlines a new verification approach which adopts the WMO definition of each TAF abbreviation,
matching the observations to the forecast as closely as these definitions allow. Then the performance is measu-
red using a novel multi-category reliability table approach; an analysis of the visibility component to TAFs is
used to demonstrate that this methodology performs well when compared with existing verification approaches
in a variety of different test cases which have been chosen to illustrate scenarios that are important to forecast
correctly. (Additional comment: we have also submitted this for the verification challenge.)

                                                                                                                  25
USR VAL-6: Displaying the Verification Results of Terminal Aerodrome Forecasts for Thunderstorms and Visibility AUTHORS: Jurkovic, Jadran; Pasaric, Zoran; Kos, Igor. Presenting author e-mail: jadran.jurkovic@crocontrol.hr; Affiliation (all authors): Croatia Control Ltd, Velika Gorica, Croatia ABSTRACT: As part of a quality management system, ICAO Annex 3 requires verification of forecasts. Ter- minal Aerodrome Forecast (TAF) is important in decision making during the flight planning process. Verifica- tion procedures are not standardized but one of the leading approaches is proposed by Mahringer (2008). It is based on verifying the best and worst conditions for each hour, between observed and forecast states. Data used for verification are TAF forecasts and observed reports (METAR) which are issued half-hourly. The occurrence of a verified event is rather rare owing to three reasons; because the forecast is for a given point, the verification time period is just one hour and aviation requirements usually refer to high impact weather. At Croatian airports the occurrence of thunderstorms is about 1-2% in terms of hours yearly, hence thunderstorm can be regarded as a rare event. Therefore, for comparing results the diagram with bias and tetrachoric correlation coefficient (TCC) is used. Together with climatological probability, this triplet fully describes contingency tables (Juras and Pasaric, 2006). Moreover, it is suggested that TCC is a good measure of association of a contingency table for rare events. When verifying visibility, a multi categorical contingency table with class limits arising from criteria for groups of changes in a TAF forecast is calculated. Consequently, instead of TCC, the polychoric correlation coefficient (PCC) is used. Bases on this approach, several applied diag rams which reveal verifi- cation results to users are shown. META-1 KEY NOTE: Generating and verifying probabilistic forecasts from convection-allowing en- sembles using neighborhood approaches: A review and recommendations AUTHORS: Ferro, Chris A.T.. Presenting author e-mail: C.A.T.Ferro@exeter.co.uk; Affiliation (all authors): University of Exeter , Exeter, UK ABSTRACT: The performance of forecasts is multifaceted, but it is often useful to summarise performance with a single measure, and scoring rules are a good way to do this. We revise the notion of a proper scoring rule and other, related types of scoring rule. We discuss the interpretation of scoring rules and how they measure different aspects of forecast performance, such as calibration and sharpness. We also describe how to make inferences using scoring rules, for example to compare the performance of two forecasters. 26
META-2: Proper and equitable scores: a resolved dilemma

AUTHORS: Ben Bouallegue, Zied.

Presenting author e-mail: zied.benbouallegue@ecmwf.int; Affiliation (all authors): ECMWF, Reading, UK

ABSTRACT: Propriety and equitability are desirable properties of scoring rules, that is functions dedicated
to the evaluation of probabilistic forecasts. On one side, the use of proper scores is required in order not to en-
courage hedging, so the expected verification results are optimised when the forecaster expressed his/her true
belief. On the other side, the use of equitable scores ensures that all non skilful forecasts have the same expected
verification results. However, propriety and equitability have been considered so far as incompatible proper-
ties. In a general framework for the definition of user oriented scores, it is shown that a family of scores that
are simultaneously proper and equitable can be defined by making a simple assumption about the relationship
between users‘ risk aversion and frequency of occurrence the events of interest. These so-called diagonal scores
are compared and related to common verification measures to illustrate their astonishing statistical properties.
Moreover, an interpretation of the diagonal scores in terms of forecast value for vulnerable users is proposed for
a simplified communication of the derived verification results.

META-3: The generalized discrimination score: connections, corrections and potential applications

AUTHORS: Harbord, Roger.

Presenting author e-mail: roger.harbord@metoffice.gov.uk; Affiliation (all authors): Met Office, Exeter, UK

ABSTRACT: The generalized discrimination score was introduced by Simon Mason and Andreas Weigel in
2009 (Mon. Weather Rev. 137:331-349) as a non-parametric measure of forecast discrimination with a reaso-
nably straightforward interpretation, applicable to all scales of measurement of observations and to both deter-
ministic and probabilistic forecasts. They extended its definition to ensemble forecasts in 2011 (Mon. Weather
Rev. 139:3069-3074). We briefly summarise these papers and clarify connections between this score and similar
metrics previously published in the statistical literature: for deterministic forecasts it is a simple rescaling of
Somers‘ D, which may be thought of as a generalization of the area under the receiver operating characteristic
(ROC) curve beyond dichotomous outcomes. We unify the many formulations provided by Mason and Weigel
for the various combinations of observation and forecast type. We find that they make an unwarranted assump-
tion of independence in their formulation of the score for probabilistic forecasts, including ensemble forecasts.
Although removing this assumption appears to make little difference to the score in practice, it suggests a simp-
ler and faster algorithm for ensemble forecasts that scales better with ensemble size. We apply the score to some
example deterministic, ensemble and percentile forecasts to illustrate its potential use in seamless verification
of the post-processing chain for assessing the gain or loss in discrimination provided by each step of the chain.

                                                                                                                 27
META-4: Decomposition and Attribution of Forecast Errors AUTHORS: Yang, Fanglin. Presenting author e-mail: Fanglin.Yang@noaa.gov; Affiliation (all authors): Environmental Modeling Center, National Centers for Environmental Prediction, College Park, Maryland, USA ABSTRACT: Root-Mean-Square Error (RMSE) has long been used as a performance metric for evaluating climate and weather forecast models. In this presentation it will be shown analytically that RMSE at times misrepresents model performance. A decomposition technique is proposed to describe more precisely RMSE distributions. Conventional RMSE can be decomposed into Error of Mean Difference (Em) and Error of Patter Variation (Ep). Ep is unbiased and can be used as an objective measure of model performance only if the an- omalous pattern correlation (R) between forecast and analysis approaches to one. If R is small, Ep is biased and favors smoother forecasts that have smaller variances. Ep normalized by analysis variance is still biased and favors forecasts with smaller variance if anomalous pattern correlation is not perfect. A comprehensive evaluation of model errors should include Anomalous Pattern Correlation, Ratio of Forecast Variance to Ana- lysis Variance, Error of Mean Difference, and Error of Pattern Variation. NCEP Global Forecast Systems with different configurations will be used to demonstrate the decomposition technique, which will be applied to both scalar variables and vector winds. At the end, the advantage and limitation of using data assimilation analysis increments to diagnose model biases will be discussed. META-5: Murphy diagrams AUTHORS: Jordan, Alexander; Ehm, Werner; Gneiting, Tilmann; Krüger, Fabian. Presenting author e-mail: alexander.jordan@h-its.org; Affiliation (all authors): Heidelberg Institute for Theore- tical Studies, Heidelberg, Germany ABSTRACT: When is a forecast system preferable over another, irrespective of the (consistent or proper) sco- ring function being used? As it turns out, in the case of probability forecasts for a binary event, and also in the cases of expectation (mean) and quantile forecasts for real-valued variables, the consistent scoring functions admit mixture representations in terms of easily interpretable elementary members. The elementary scoring functions form a linearly parameterized family, where the linear parameter corresponds to a threshold in a decision-making problem. Therefore, we can plot the empirical scores of competing forecast systems as a func- tion of relevant threshold values. We call this type of display a Murphy diagram, in honor of Allan H. Murphy. Murphy diagrams offer simple checks of whether a forecast dominates another, in the sense that it is preferable under any consistent scoring function, and permit detailed comparisons of the relative merits of competing fore- cast systems. In my presentation, I will sketch the underlying theory and illustrate the use of Murphy diagrams in meteorological and economic case studies. 28
META-6: Verification of Multi-Valued Forecasts

AUTHORS: Bullock, Tim; Shum, Nelson.

Presenting author e-mail: Timothy.Bullock@canada.ca; Affiliation (all authors): Meteorological Service of
Canada, Halifax, Canada

ABSTRACT: Some weather forecasts predict physical quantities which assume multiple values during a time
interval and/or over a region of interest. Such forecasts must necessarily be multiple-valued as well, otherwise
they could not accurately predict those quantities. In other cases, forecast values are organized into categories
which are not mutually-exclusive. In still others, there is a large discrepancy between the precision of forecast
and observed categories. In each of these instances, application of traditional, single-valued verification me-
thods (i.e. comparing one forecast value with one observed value) may entail significant loss of information,
which can compromise the validity or usefulness of conclusions obtained from the analysis of performance. By
relaxing the requirement that forecasts and observations be single-valued, it is possible to preserve the informati
on content of both forecasts and observations, thereby offering additional insights into the performance of the
aforementioned forecast systems. Insofar as a multi-valued forecast system could be considered as a generali-
zation of a single-valued system, the verification metrics for a multi-valued forecast system might also be vie-
wed as generalizations of their single-valued counterparts. A selection of metrics is proposed for multi-valued
verification (MVV). Application of the MVV approach is then demonstrated for forecasts of a few weather
variables from public and marine forecast bulletins issued routinely by the Meteorological Service of Canada.

PROB ENS-1: Ensemble verification: Old scores, new perspectives

AUTHORS: Wahl, Sabrina; Friederichs, Petra; Keller, Jan D..

Presenting author e-mail: wahl@uni-bonn.de; Affiliation (all authors): Hans-Ertle-Centre for Weather Re-
search / University of Bonn, Bonn, Germany

ABSTRACT: The recently derived decomposition of the quantile score into uncertainty, resolution and re-
liability (Bentzien and Friederichs, 2014) can be generalized to a decomposition of the continuous ranked
probability score (CRPS). This decomposition reveals detailed insights into ensemble performance in terms of
calibration and information content. We utilize this framework to investigate the performance of raw ensemble
forecasts, i.e. without further translation of the ensemble members into probabilistic predictions. Such an eva-
luation is of particular interest for developers and designers of ensemble prediction systems. We further present
a novel graphical exploration of the forecast attributes.

                                                                                                                29
PROB ENS-2: Increasing the usability of analysis rank histograms AUTHORS: Keller, Jan; Wahl, Sabrina. Presenting author e-mail: jkeller@uni-bonn.de; Affiliation (all authors): Hans-Ertel-Centre for Weather Re- search / Deutscher Wetterdienst, Offenbach, Germany ABSTRACT: An analysis rank histogram (ARH) is a popular tool for evaluating probabilistic data sets com- prising multiple realizations of an observed parameter, i.e., an ensemble. By looking at the ARH one can determine the calibration of an ensemble, i.e., how well does the ensemble represent the observed variability. A flat ARH is usually a sign for the ensemble to be reliable while the often encountered U-shaped histogram indicates un under-dispersiveness of the ensemble, i.e., the variability is too small. The evaluation of ensemble performance using ARHs is generally done by averaging over large data sets of forecasts and observations for multiple locations and time steps. Depending on the application, a stratification of calibration with respect to geographic regions and/or specific time periods may be desirable. However, if one is interested in the spatial distribution or the temporal evolution of ensemble calibration, it would be difficult to visually assess the infor- mation of a lot of ARH plots or to put them into a journal publication. The beta score provides a simple approach to tackle this problem. Using a parametric approximation of the ARH to a beta distribution, the score allows for the description of the histogram shape with a single value. We show examples of ARHs and the corresponding beta scores to confirm the validity of the approximation. We than compare reliability assessments for different ensemble forecasts using beta score time series as well as map plots. We will further show results for a covari- ance evaluation of these forecasts using ARH-based beta scores. PROB ENS-3: Another look at spread and skill AUTHORS: Johansson, Åke. Presenting author e-mail: Ake.Johansson@smhi.se; Affiliation (all authors): Swedish Meteorological and Hy- drological Institute (SMHI), Norrköping, Sweden ABSTRACT: The relationship between spread and skill is an important indicator of the quality of an ensemble prediction system. Arguments are given that suggests that an alternative to the commonly used spread-skill condition is needed to properly address the true relationship between spread and skill. Such a relationship is derived and given the name U.UI spread-skill condition. Its properties are described both analytically and geo- metrically and the relationship to the commonly used condition is demonstrated and discussed. It is argued that it would provide not only a more appropriate and sharper tool to assess the spread-skill relationship, but also that it indicates how to improve upon the present design of an EPS. In particular, the presently prevalent practice of centering the perturbed ensemble members around the control analysis should be abandoned in favor of a methodology that constructs equally likely ensemble members with the same quality as the control member. A recent experiment with a limited area ensemble prediction system is used to quantify the differences in percei- ved quality that is obtained by employing the two different spread-skill conditions. The differences are found to be substantial. 30
You can also read