A cross sectional analysis of the association between physical activity, depression, and all cause mortality in Americans over 50 years old
←
→
Page content transcription
If your browser does not render page correctly, please read the page content below
www.nature.com/scientificreports
OPEN A cross‑sectional analysis
of the association between physical
activity, depression, and all‑cause
mortality in Americans
over 50 years old
Jose Luis Perez‑Lasierra1,2,3, Belén Moreno‑Franco4,5,6,8*, Alejandro González‑Agüero1,2,3,
Elena Lobo4,5,7 & Jose A. Casajus1,2,3
Depression is estimated to be the second leading cause of disability in the United States and is
associated with a 52% increased risk of death. Lifestyle components may have an important role
in depression pathogenesis. The aims of this study were to analyze the association of meeting the
physical activity (PA) recommendation guidelines and depression, and to analyze the all-cause
mortality risk of the joint association of PA and depression. This cross-sectional study included 7201
participants from the 2007–2014 National Health and Nutrition Examination Survey aged ≥ 50 years
and linked to National Death Index records through December 31, 2015. Depression was defined
as a score ≥ 10 using the Patient Health Questionnaire (PHQ-9). PA was self-reported, and total PA
was used to classify participants as more active (≥ 600 MET-min/week) or less active (< 600 MET-min/
week). The odds ratios for depression were examined according to be more active or less active. The
hazard ratios (HR) for the association of PA level and depression status with all-cause mortality were
examined. Being more active was associated with reduced odds for depression. Compared with less
active participants with depression, those who were more active and having depression had HR 0.45
(95% CI 0.22, 0.91, p = 0.026) for all-cause mortality. Being more active is associated with lower odds
for depression and seems to be a protective factor against the increased all-cause mortality risk due to
depression.
Depression is a common mental disorder affecting more than 264 million people w orldwide1. In the United
States, it is estimated to be the second cause of disability2, with an increasing trend in non-institutionalized
population, mainly in older p eople3.
People suffering from depression usually show different neurovegetative, neurocognitive, and emotional
symptoms4. Among them are low levels of mood, anhedonia, feelings of worthlessness or guilt, fatigue or loss of
energy, disruptive appetite, sleep disturbance, and difficulty to think or c oncentrate4, which frequently lead to
decreased quality of life, disability, suicide ideation, or even suicide a ttempts5,6.
Lifestyle components may have an important role in depression pathogenesis. Unhealthy behaviors such as
sedentarism, physical inactivity, poor diet, or substance abuse have been associated with a significantly higher
epression7,8, contrary to the protective effect of a healthy lifestyle8. Physical activity (PA), defined as
risk of d
any bodily movement produced by skeletal muscles that requires energy expenditure9, is a cornerstone in the
primary prevention of chronic diseases, including depression8,10,11. Moreover, evidence also suggests that PA is a
recognized strategy in secondary p revention12 and that PA plays a significant role concerning late-life depression
1
Department of Physiatry and Nursing, Universidad de Zaragoza, 50009 Zaragoza, Spain. 2GENUD (Growth,
Exercise, Nutrition and Development) Research Group, 50009 Zaragoza, Spain. 3EXERNET Red de Investigación
en Ejercicio Físico y Salud, Zaragoza, Spain. 4Department of Microbiology, Pediatrics, Radiology and Public
Health, Universidad de Zaragoza, 50009 Zaragoza, Spain. 5Instituto de Investigación Sanitaria Aragón, Hospital
Universitario Miguel Servet, 50009 Zaragoza, Spain. 6CIBERCV Instituto de Salud Carlos III, 28029 Madrid,
Spain. 7CIBERSAM Instituto de Salud Carlos III, 28029 Madrid, Spain. 8Preventive Medicine and Public Health,
Universidad de Zaragoza, C/Domingo Miral s/n, 50009 Zaragoza, Spain. *email: mbmoreno@unizar.es
Scientific Reports | (2022) 12:2264 | https://doi.org/10.1038/s41598-022-05563-7 1
Vol.:(0123456789)www.nature.com/scientificreports/
consequences, such as s uicide13. Biological theories about the antidepressant mechanisms of PA are mainly
based on the improvement of neuroplasticity, and in the reduction of inflammation and oxidative stress, while
psychosocial theories are based on the improvement of self-esteem, social support, and self-efficacy14.
Although the benefits of PA against depression are well d ocumented8,10,11, few studies have analyzed whether
9
compliance with PA r ecommendations is enough to obtain a preventive effect against d epression10. Furthermore,
those studies are mainly focused on young or middle-aged women, health care workers, or college s tudents10,
and only two studies are focused on older p eople15,16. On the contrary, the protective effect of complying with PA
recommendations against all-cause mortality in the general population is widely k nown9,17. Evidence also sug-
gests that depression is associated, by itself, with a higher mortality risk, reaching a 52% increased risk of d eath18.
Despite the evidence of these associations with mortality, to our knowledge, no study has analyzed the all-cause
mortality risk of the joint association of PA and depression in older adults. Therefore, the purpose of this study
was to analyze the association of meeting the PA recommendations and depression and to analyze the all-cause
mortality risk of the joint association of PA and depression in non-institutionalized, older American adults.
Methods
Study design and population. The National Health and Nutrition Examination Survey (NHANES), con-
ducted by the National Center for Health Statistics (NCHS), is an annual national cross-sectional survey of a
representative sample of non-institutionalized United States population. The survey uses a stratified, multistage
sample design to randomly select approximately 7000 residents across the country each year. Participation in the
survey is confidential and voluntary. Public-use linked mortality files from the National Death Index (NDI) are
available for continuous NHANES 1999–2014, providing mortality data from the date of survey participation
through December 31, 2015.
The present study used data from 4 cross-sectional NHANES waves conducted from 2007 to 2014 and their
linked mortality files. Details about linkage of NHANES data with NDI records have been published e lsewhere19.
For this analysis, sample was reduced to participants ≥ 50 years old who were followed up for mortality out-
comes ≥ 12 months after the enrollment in the study to minimize bias from reverse causation (n = 10,908). Par-
ticipants with missing data on PA (n = 2523), depression (n = 811), and other covariables (n = 373) were excluded,
so the final sample included 7201 participants.
All participants provided written informed consent, and all methods were carried out in accordance with
relevant guidelines and regulations. The Ethics Review Board of the NCHS approved measurement procedures,
data collection, and posting of the data online for public use.
Definition and assessment of depression. Depression was assessed by means of the Patient Health
Questionnaire-9 (PHQ-9), a widely-used self-report depression screener that consists of 9 items to assess depres-
sive symptoms over the last 2 weeks20. The PHQ-9 score can range from 0 to 27, since each of the 9 items can
be scored from 0 (not at all) to 3 (nearly every day)20. Scores ≥ 10 represent clinically significant depressive
symptoms21, so for this study, depression has been defined as score ≥ 10 in the PHQ-9. This is a common cut-
point that has been used in previous studies22 and maximized combined sensitivity and specificity23.
Assessment of physical activity. PA was assessed by interview using the Global Physical Activity Ques-
tionnaire (GPAQ) created by the World Health Organization (WHO)24. This questionnaire analyzes the usual
PA performed in a typical week in 3 different domains (PA at work/domestic, PA in transport/travel, and PA in
leisure time), as long as it has been carried out in continuous periods of 10 min. The questionnaire also considers
the intensity at which it has been performed (moderate or vigorous). The total metabolic equivalent per minute
per week (MET-min/week) was calculated following the GPAQ p rotocol25.
9
Based on PA recommendation guidelines by the WHO , the subjects were classified into two different groups.
Those who performed at least 150 min of moderate to vigorous PA (≥ 600 MET-min/week) and met the PA
recommendations for adults compose the more-active group, and those who performed less than 150 min of
moderate to vigorous PA (< 600 MET-min/week) and thus did not meet the recommendations, composed the
less-active group.
Mortality. Survival time was counted from the date of survey participation to the date of death or the end
of the study follow-up period (December, 31, 2015), whichever came first. In this study all-cause mortality was
used as the main outcome for mortality, classifying participants as alive or deceased.
Assessment of additional covariates. Demographic, lifestyle, anthropometric, and health data were
obtained and used to adjust the results of regression models. The selection of these specific variables was based
on their possible confounding role in the associations analyzed6,26.
Demographics included age (50–59; 60–69; 70–79; ≥ 80), sex, race/ethnicity (Mexican American, Other
Hispanic, Non-Hispanic White, Non-Hispanic Black, and Other (including Multi-Racial)), annual household
income (0–19,999 USD; 20,000–44,999 USD; 45,000–74,999 USD, and ≥ 75,000 USD), and educational level (less
than 9th grade; 9th–12th grade, no diploma; high school graduate; college or Associate´s degree; and college
graduate or above).
Lifestyle risk factors included alcohol consumption in the last 12 months classified as 0 drinks/day, < 2 drinks/
day, and ≥ 2 drinks/day, and smoking status was defined as never smoked, former smoker, and smoker.
Anthropometric included body mass index (BMI), calculated as weight in kilograms divided by height in
meters squared and classified in < 25.0 kg/m2, 25.0–29.9 kg/m2, and ≥ 30.0 kg/m2. Self-reported medical diagnosis
of hypertension, dyslipidemia, or type 1 and 2 diabetes, or self-reported use of antihypertensive medication,
Scientific Reports | (2022) 12:2264 | https://doi.org/10.1038/s41598-022-05563-7 2
Vol:.(1234567890)www.nature.com/scientificreports/
lipid-lowering drugs, or hypoglycemic medication, were used to classify participants as having arterial hyperten-
sion, dyslipidemia, and diabetes, respectively.
Statistical analysis. According to the NHANES analytical guidelines, all data were downloaded, merged,
and analyzed, incorporating appropriated combined weights, primary sampling unit, and strata provided by
NHANES27. Moreover, public-use linked mortality files from NDI were merged with NHANES data following
the appropriate guidelines19.
Categorical variables were expressed as frequency (%), and continuous variables were presented as mean and
standard error (SE). Descriptive analyses were carried out for the overall samples and divided by PA groups.
Logistic regressions models according to the PA group of the participants were conducted to examine the adjusted
odds ratios (OR) for depression. The first model was unadjusted, and the second only age-adjusted. Model A
was adjusted by age, sex, race/ethnicity, annual household income, and educational level. Model B was addition-
ally adjusted by smoking status, alcohol consumption, BMI, arterial hypertension, dyslipidemia, and diabetes.
Cox proportional hazards regression models were performed to examine hazard ratios (HRs) and 95% CIs for
the association between PA level and depression status with all-cause mortality. Furthermore, adjusted survival
curves were plotted. When the PA level and depression status joint association with all-cause mortality was
analyzed, the less-active (< 600MET-min/week) and with-depression (PHQ-9 ≥ 10) subgroup was considered
the reference group when hazard ratios for the three other subgroups were calculated. In this case, the model
was adjusted for potential confounders, including age at baseline, sex, race/ethnicity, annual household income,
educational level, smoking status, alcohol consumption, BMI, arterial hypertension, dyslipidemia, and diabetes.
The proportional hazards assumption was not violated as examined by log–log survival plots and correlations of
follow-up time and Schoenfeld residuals from the adjusted Cox models28.
A two-sided p-value of 0.05 was considered statistically significant. Statistical analysis was performed using
SPSS statistical software (ver. 24.0 IBM Corp., Armonk, NY, USA) and R statistical software (ver. 4.0.4).
Results
The overall prevalence of depression in ≥ 50-years-old non-institutionalized Americans was 7.8%. The prevalence
among those who met and did not meet the PA recommendations for adults was 5.3% and 11.0%, respectively
(Table 1). The more-active group had a lower prevalence of obesity, hypertension, dyslipidemia, and diabetes, as
well as higher educational level and annual household income than the less-active group (Table 1).
The likelihood of having depression was lower for those participants in the more-active group compared to
those in the less-active group. The weighted odds for having depression after adjusting the results by age, sex,
race/ethnicity, annual household income, educational level, alcohol consumption, smoking status, BMI, arte-
rial hypertension, dyslipidemia, and diabetes were 0.57 (95% CI 0.44, 0.72, p < 0.001) for the more-active group
compared to the less-active group (Table 2). Additionally, Supplementary Table 1 includes tests of the weighted
odds for having depression among three PA levels subgroups: < 600 MET-min/week, 600–1200 MET-min/week,
and > 1200 MET-min/week.
In addition, if the total PA was divided according to the different domains analyzed (PA at work/domestic,
PA in leisure time, and PA in transport/travel), only those who performed ≥ 600 MET-min/week of leisure-time
PA had significantly lower odds for having depression compared to those who performed < 600 MET-min/week
of leisure-time PA (OR 0.47, 95% CI 0.32, 0.67, p < 0.001) (Supplementary Table 2).
During a median 54.0 months (interquartile range 12–108 months) of follow-up, 655 deaths occurred among
7201 individuals in the study. The percentage of deaths among those who met and did not meet the PA recom-
mendations for adults were 4.1% and 9.4%, respectively (Table 1). Moreover, the percentage of deaths in partici-
pants with and without depression were 9.4% and 6.1%, respectively.
When studying HRs for all-cause mortality, those with depression had a 1.55-fold increased HR of death
(95% CI 1.18, 2.03, p = 0.002) compared to those without depression (Table 3 and Fig. 1a). Moreover, those who
performed < 600 MET-min/week had a 1.73-fold increased HR of death (95% CI 1.45, 2.07, p < 0.001) compared
to those who performed ≥ 600 MET-min/week (Table 4 and Fig. 1b). These HRs were adjusted by age, sex,
race/ethnicity, annual household income, educational level, alcohol consumption, smoking status, BMI, arterial
hypertension, dyslipidemia, and diabetes.
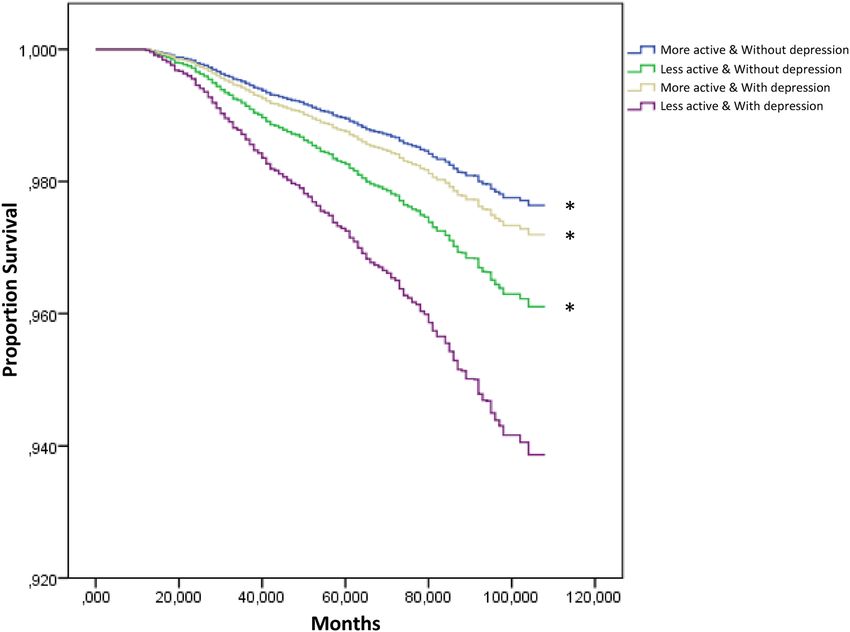
When the joint association of depression and PA was analyzed in relation to the risk of all-cause mortality,
those who were more active without depression had the lowest risk of death compared to those who were less
active and with depression, HR 0.38 (95% CI 0.28, 0.52, p < 0.001). Those who were less active without depres-
sion, and those who were more active with depression, also had a lower risk of death compared to those who
were less active and with depression, 0.63 HR (95% CI 0.46, 0.85, p = 0.003), and 0.45 HR (95% CI 0.22, 0.91,
p = 0.026), respectively (Fig. 2). These HRs were adjusted by age, sex, race/ethnicity, annual household income,
educational level, alcohol consumption, smoking status, BMI, arterial hypertension, dyslipidemia, and diabetes.
Discussion
This study provided evidence that performing at least 150 min/week of moderate to vigorous PA was associated
with reduced odds for depression among an American population aged 50 and older. Furthermore, among those
with depression, performing 150 min/week of moderate to vigorous PA was associated with a 55.1% reduced
risk of all-cause mortality compared to those who performed less PA.
The beneficial effect of PA in depression prevention has been analyzed in-depth through specific systematic
reviews, concluding that PA may prevent depression10,11,29. Nevertheless, only a few studies were focused on older
people15,16,30–33, and in addition, only two of those studies conducted in European and Asian populations analyzed
the relationship between depression and PA assessed as a dose (combined amount and intensity)15,16. However,
Scientific Reports | (2022) 12:2264 | https://doi.org/10.1038/s41598-022-05563-7 3
Vol.:(0123456789)www.nature.com/scientificreports/
Overall Less active More active p value for interaction
N, % 100 (7201) 43.1 (3439) 56.9 (3762) < 0.001
Depression, % 7.8 (676) 11.0 (437) 5.3 (239) < 0.001
PHQ-9 Score, points 2.92 (0.07) 3.62 (0.11) 2.38 (0.08) < 0.001
Deaths, % 6.4 (655) 9.4 (428) 4.1 (227) < 0.001
Age, %
50–59 43.5 (2403) 37.4 (972) 48.1 (1431)
60–69 32.2 (2542) 32.0 (1201) 32.4 (1341)
< 0.001
70–79 16.5 (1501) 19.5 (809) 14.2 (692)
> 80 7.8 (755) 11.1 (457) 5.4 (298)
Male, % 49.7 (3829) 41.7 (1601) 55.8 (2228) < 0.001
Race/ethnicity, %
Mexican American 3.8 (765) 4.3 (386) 3.4 (379)
Other Hispanic 3.2 (660) 3.6 (323) 2.8 (337)
Non-Hispanic White 80.1 (3769) 77.6 (1727) 82.0 (2042) < 0.001
Non-Hispanic Black 9.0 (1581) 10.7 (823) 7.7 (758)
Other 3.9 (426) 3.7 (180) 4.0 (246)
Annual household income, %
0–19,999 USD 13.6 (1592) 17.7 (887) 10.5 (705)
20,000–44,999 USD 28.2 (2405) 31.4 (1225) 25.8 (1180)
< 0.001
45,000–74,999 USD 21.4 (1376) 19.9 (607) 22.6 (769)
≥ 75,000 USD 36.7 (1828) 31.0 (720) 41.1 (1108)
Educational level, %
Less than 9th Grade 4.9 (755) 7.0 (442) 3.4 (313)
9th–12th Grade, No diploma 10.3 (1038) 12.9 (596) 8.4 (442)
High School Graduate 22.4 (1656) 24.0 (820) 21.2 (836) < 0.001
College or AA Degree 30.0 (2009) 29.7 (903) 30.2 (1106)
College Graduate or Above 32.3 (1743) 26.4 (678) 36.7 (1065)
Alcohol consumers, %
0 drinks/day 24.1 (2213) 28.9 (1232) 20.5 (981)
< 2 drinks/day 67.8 (4490) 64.8 (2022) 70.1 (2468) < 0.001
≥ 2 drinks/ day 8.1 (498) 6.3 (185) 9.4 (313)
Smoking status, %
Never 45.1 (3102) 43.6 (1431) 46.3 (1671)
Former 38.6 (2845) 38.5 (1367) 38.7 (1478) 0.046
Smoker 16.2 (1254) 17.9 (641) 15.0 (613)
BMI, %
< 25 25.3 (1750) 21.5 (745) 28.1 (1005)
25–29.9 35.6 (2533) 31.3 (1110) 38.9 (1423) < 0.001
≥ 30 39.1 (2918) 47.1 (1584) 33.0 (1334)
Arterial hypertension, % 51.1 (4056) 57.5 (2136) 46.2 (1920) < 0.001
Dyslipidemia, % 56.1 (4067) 58.7 (2015) 54.1 (2052) 0.003
Diabetes, % 16.8 (1573) 21.9 (912) 12.8 (661) < 0.001
Table 1. Baseline characteristics of study participants according to level of physical activity. Data are expressed
as weighted percentages and unweighted number of participants for categorical variables, and as weighted
mean (standard error) for continuous variables. Less active: performed < 600 MET-min/week; More active:
performed ≥ 600 MET-min/week; Other: other race, including Multi-Racial; AA degree: Associate’s degree.
Significant values are in bold.
controversial findings were reported by these two studies. Mc Dowell et al. conducted a study with more than
7800 participants and supported an association between meeting PA guidelines and lower odds of depression
after adjusting the results by age, sex, and BMI (OR 0.56, 95% CI 0.47, 0.66)16. On the other hand, Wang et al. did
not find an association between meeting PA guidelines (performing 600–2249 MET-min/week of PA) and lower
odds of depression (OR 1.02, 95% CI 0.78, 1.33), but found an association between performing more than 2250
MET-min/week of PA and higher odds of depression (OR 1.22, 95% CI 1.01, 1.47)15. As Wang et al. discussed,
the association of very high levels of PA with a higher risk of depression may be due to the purpose of PA, since
higher frequency, longer duration, and larger volume of heavy-labor work may indicate lower household income,
Scientific Reports | (2022) 12:2264 | https://doi.org/10.1038/s41598-022-05563-7 4
Vol:.(1234567890)www.nature.com/scientificreports/
Physical activity level (MET-min/week)
Less active (< 600) More active (≥ 600) p-value
Unadjusted 1.00 (ref)a 0.46 (0.36, 0.57) < 0.001
Age-adjusted 1.00 (ref)a 0.41 (0.33, 0.52) < 0.001
Multivariable-adjusted Model A 1.00 (ref)a 0.52 (0.41, 0.65) < 0.001
Multivariable-adjusted Model B 1.00 (ref)a 0.57 (0.44, 0.72) < 0.001
Table 2. Odds ratio (95% CI) for depression according to physical activity levels. Data are representative of
non-institutionalized American population. Model A is adjusted by age, sex, race/ethnicity, annual household
income, and educational level. Model B is additionally adjusted by alcohol consumption, smoking status, BMI,
arterial hypertension, dyslipidemia, and diabetes. aSignificant differences between Less-active and More-active
groups.
Depression status
Without depression With depression p-value
Unadjusted 1.00 (ref)a 1.72 (1.28, 2.30) 0.001
Age-adjusted 1.00 (ref)a 2.35 (1.75, 3.16) < 0.001
Multivariable-adjusted Model A 1.00 (ref)a 1.88 (1.40, 2.51) < 0.001
Multivariable-adjusted Model B 1.00 (ref)a 1.55 (1.18, 2.03) 0.002
Table 3. Hazard ratio (95% CI) for all-cause mortality according to depression status. Data are representative
of non-institutionalized American population. Model A is adjusted by age, sex, race/ethnicity, annual
household income, and educational level. Model B is additionally adjusted by alcohol consumption, smoking
status, BMI, arterial hypertension, dyslipidemia, and diabetes. With depression: scored ≥ 10 in PHQ-9; Without
depression: scored < 10 in PHQ-9. aSignificant differences between without-depression and with-depression
groups.
Figure 1. Hazard ratio (95% CI) for all-cause mortality according to (a) depression status, and (b) physical
activity level. Data are representative of non-institutionalized American population. All hazard ratios were
adjusted by age, sex, race/ethnicity, annual household income, educational level, alcohol consumption, smoking
status, body mass index, arterial hypertension, dyslipidemia, and diabetes.
epression15. The findings of our study are in line with those of Mc Dowell,
which leads to increasing the risk of d
reinforcing the idea that meeting PA guidelines can help prevent depression among persons older than 50 years.
As we mentioned above, increasing evidence shows a beneficial effect of PA in depression p revention10,11,29.
However, the causality and direction of this association have been discussed in the literature, suggesting that PA
may protect against depression, and/or depression may result in decreased PA. This could be a source of concern
in ascertaining the role of PA in depression prevention. Nevertheless, a meta-analysis of prospective studies, and
other recent study using bidirectional mendelian randomization provide evidence to establish a causal relation-
ship between PA and a reduced risk for d epression11,34.
Previous studies have analyzed the association between meeting the PA recommendations in adults and all-
cause mortality, establishing that those meeting the recommendations have a 40% decreased risk of d eath9,17.
Scientific Reports | (2022) 12:2264 | https://doi.org/10.1038/s41598-022-05563-7 5
Vol.:(0123456789)www.nature.com/scientificreports/
Physical activity level (MET-min/week)
More active (≥ 600) Less active (< 600) p-value
Unadjusted 1.00 (ref)a 2.52 (2.07, 3.06) < 0.001
Age-adjusted 1.00 (ref)a 1.91 (1.58, 2.30) < 0.001
Multivariable-adjusted Model A 1.00 (ref)a 1.85 (1.53, 2.24) < 0.001
Multivariable-adjusted Model B 1.00 (ref)a 1.73 (1.45, 2.07) < 0.001
Table 4. Hazard ratio (95% CI) for all-cause mortality according to physical activity level. Data are
representative of non-institutionalized American population. Model A is adjusted by age, sex, race/ethnicity,
annual household income, and educational level. Model B is additionally adjusted by alcohol consumption,
smoking status, BMI, arterial hypertension, dyslipidemia, and diabetes. aSignificant differences between Less-
active and More-active groups.
Figure 2. Survival curves for all-cause mortality according to physical activity group and depression status.
Data are representative of non-institutionalized American population. Less active: Performed < 600 MET-min/
week; More active: Performed ≥ 600 MET-min/week; With depression: Scored ≥ 10 in the PHQ-9; Without
depression: Scored < 10 in the PHQ-9. Curves are adjusted by age, sex, race/ethnicity, annual household income,
educational level, alcohol consumption, smoking status, BMI, arterial hypertension, dyslipidemia, and diabetes.
*Significant difference with Less active & with depression group.
Other previous studies also have ascertained a positive association between depression and all-cause m ortality18.
The results of our study are consistent with those previous studies, establishing that 150 min of moderate to
vigorous PA can be a protective factor against all-cause mortality and that having depression is associated with a
higher all-cause mortality risk. However, the present study also analyzes the combined effects of meeting the PA
recommendations and depression status with the risk of all-cause mortality among persons older than 50 years.
As could be expected, those without depression in the more-active group had the lowest HR for all-cause mor-
tality compared with those with depression in the less-active group. Interestingly, those with depression in the
more-active group had a lesser HR than those without depression in the less-active group, compared with the
reference group (with depression and less active). This fact reveals that PA could counteract the higher mortality
risk due to depression.
Analyzing the influence of PA as a dose (combined amount and intensity) in relation to depression and all-
cause mortality, and not only as frequency, as in other s tudies22,31,32, is essential. However, it could be interesting to
analyze whether the type of PA influences the relationship of PA’s preventive role against depression and whether
the combined effect of PA and depression status on all-cause mortality is PA-type dependent. Other studies have
elucidated the relationship between PA and mortality, finding that it is dependent on the type of PA17. Therefore,
differentiating at least between endurance and resistance activities in PA quantification may determine if any type
Scientific Reports | (2022) 12:2264 | https://doi.org/10.1038/s41598-022-05563-7 6
Vol:.(1234567890)www.nature.com/scientificreports/
of PA is more protective than others against depression. One previous study has shown that regular flexibility,
and no other type of exercise, such as muscular strength or walking, was independently related to depression
prevention22. However, as mentioned above, in this study, the assessment of PA only as frequency may not show
the real role of each PA type in depression prevention22. Maybe future studies could shed some light on this issue.
To the best of our knowledge, this is the first study that analyzed the joint association between PA and depres-
sion with all-cause mortality in a representative sample of the American population aged 50 and older. However,
several limitations should be acknowledged in our study. First, regarding the association of PA and depression,
the cross-sectional analysis does not allow us to establish a causal, temporal link. Second, although data collec-
tion about PA has been carried out by trained interviewers, the use of self-reported information could be subject
to bias35. Third, depression status was only assessed once (at baseline), and it was not possible to consider the
course of depression. Fourth, to increase the statistical power, only two subgroups of total PA were used to test in
combination with depression status, its joint association with mortality. Fifth, only non-institutionalized adults
were included in this analysis, so the results can only be applied to this population.
Conclusions
In summary, performing 150 min/week of moderate to vigorous PA is associated with reduced odds for depres-
sion and seems to be a preventive factor against the increased all-cause mortality risk due to depression. From a
population health perspective, promoting moderate to vigorous PA for at least 150 min/week among Americans
aged over 50 years with depression may be an important health-promotion strategy that can reduce the increased
all-cause mortality risk associated with depression.
Received: 7 October 2021; Accepted: 11 January 2022
References
1. World Health Organization. World Health Organization, Health Topics, Depression. https://www.who.int/health-topics/depre
ssion#tab=tab_1. (accessed 3 Dec 2021).
2. GBD 2015 Disease and Injury Incidence and Prevalence Collaborators. Global, regional, and national incidence, prevalence, and
years lived with disability for 310 diseases and injuries, 1990–2015: A systematic analysis for the Global Burden of Disease Study
2015. Lancet 388, 1545–1602 (2015).
3. Yu, B. et al. Trends in depression among Adults in the United States, NHANES 2005–2016. J. Affect. Disord. 263, 609–620 (2020).
4. Malhi, G. S. & Mann, J. J. Depression. Lancet 392, 2299–2312 (2018).
5. Ribeiro, J. D., Huang, X., Fox, K. R. & Franklin, J. C. Depression and hopelessness as risk factors for suicide ideation, attempts and
death: Meta-analysis of longitudinal studies. Br. J. Psychiatry 212, 279–286 (2018).
6. Sivertsen, H., Bjorklof, G. H., Engedal, K., Selbaek, G. & Helvik, A. Depression and quality of life in older persons: A review.
Dement. Geriatr. Cogn. Disord. 40, 311–339 (2015).
7. Wang, X., Li, Y. & Fan, H. The associations between screen time-based sedentary behavior and depression: A systematic review
and meta-analysis. BMC Public Health 19, 1–9 (2019).
8. Sarris, J., O’Neil, A., Coulson, C. E., Schweitzer, I. & Berk, M. Lifestyle medicine for depression. BMC Psychiatry 14, 1–13 (2014).
9. Bull, F. C. et al. World Health Organization 2020 guidelines on physical activity and sedentary behaviour. Br. J. Sports Med. 54,
1451–1462 (2020).
10. Mammen, G. & Faulkner, G. Physical activity and the prevention of depression: A systematic review of prospective studies. Am.
J. Prev. Med. 45, 649–657 (2013).
11. Schuch, F. B. et al. Physical activity and incident depression: A meta-analysis of prospective cohort studies. Am. J. Psychiatry 175,
631–648 (2018).
12. Dinas, P., Koutedakis, Y. & Flouris, A. Effects of exercise and physical activity on depression. Ir. J. Med. Sci. 180, 319–325 (2011).
13. Vancampfort, D. et al. Physical activity and suicidal ideation: A systematic review and meta-analysis. J. Affect. Disord. 225, 438–448
(2018).
14. Kandola, A., Ashdown-Franks, G., Hendrikse, J., Sabiston, C. M. & Stubbs, B. Physical activity and depression: Towards under-
standing the antidepressant mechanisms of physical activity. Neurosci. Biobehav. Rev. 107, 525–539 (2019).
15. Wang, R. et al. Intensity, frequency, duration, and volume of physical activity and its association with risk of depression in mid-
dle- and older-aged Chinese: Evidence from the China Health and Retirement Longitudinal Study, 2015. PLoS One 14, e0221430
(2019).
16. Mc Dowell, C. P. et al. Associations of self-reported physical activity and depression in 10,000 Irish adults across harmonised
datasets: A DEDIPAC-study. BMC Public Health 28, 1–8 (2018).
17. Zhao, M., Veeranki, S. P., Magnussen, C. G. & Xi, B. Recommended physical activity and all cause and cause specific mortality in
US adults: Prospective cohort study. BMJ 370, 1–10 (2020).
18. Cuijpers, P. et al. Comprehensive meta-analysis of excess mortality in depression in the general community versus patients with
specific illnesses. Am. J. Psychiatry 171, 453–462 (2014).
19. National Center for Health Statistics. Linkage methods and analytical support for NCHS linked mortality data. (accessed 3 Dec
2021); https://www.cdc.gov/nchs/data-linkage/mortality-methods.htm.
20. Kroenke, K., Spitzer, R. L. & Williams, J. B. W. The PHQ-9: Validity of a brief depression severity measure. J. Gen. Intern. Med. 16,
606–613 (2001).
21. Kroenke, K. & Spitzer, R. L. The PHQ-9: A new depression diagnostic and severity measure. Psychiatr. Ann. 32, 509–515 (2002).
22. Byeon, H. Relationship between physical activity level and depression of elderly people living alone. Int. J. Environ. Res. Public
Health. 16, 4051 (2019).
23. Levis, B., Benedetti, A. & Thombs, B. D. Accuracy of Patient Health Questionnaire-9 (PHQ-9) for screening to detect major
depression: Individual participant data meta-analysis. BMJ 365, l1476 (2019).
24. Armstrong, T. & Bull, F. Development of the World Health Organization Global Physical Activity Questionnaire (GPAQ). J. Public
Health (Bangkok) 14, 66–70 (2006).
25. World Health Organization. Global Physical Activity Questionnaire (GPAQ) Analysis Guide. (accessed 3 Dec 2021). https://www.
who.int/ncds/surveillance/steps/resources/GPAQ_Analysis_Guide.pdf?ua=1.
26. Blazer, D. G. Depression in late life: Review and commentary. J. Gerontol. Ser. A Biol. Sci. Med. Sci. 58, 249–265 (2003).
27. National center for health statistics. Module 3: weighting. (accessed 3 Dec 2021). https://wwwn.cdc.gov/nchs/nhanes/tutor ials/
module3.aspx.
Scientific Reports | (2022) 12:2264 | https://doi.org/10.1038/s41598-022-05563-7 7
Vol.:(0123456789)www.nature.com/scientificreports/
28. Hess, K. R. Graphical methods for assessing violations of the proportional hazards assumption in cox regression. Stat. Med. 14,
1707–1723 (1995).
29. Dunn, A. L., Trivedi, M. H. & Neal, H. A. O. Physical activity dose-response effects on outcomes of depression and anxiety. Med.
Sci. Sport. Exerc. 33, 587–597 (2001).
30. Almeida, O. P., Norman, P., Hankey, G., Jamrozik, K. & Flicker, L. Successful mental health aging: Results from a longitudinal
study of older Australian men. Am. J. Geriatr. Psychiatry 14, 27–35 (2006).
31. Chang, M. et al. The association between midlife physical activity and depressive symptoms in late life: Age gene/environment
susceptibility-Reykjavik Study. J. Gerontol. Ser. A. Biol. Sci. Med. Sci. 71, 502–507 (2016).
32. Tsutsumimoto, K. et al. Prospective associations between sedentary behaviour and incident depressive symptoms in older people:
A 15-month longitudinal cohort study. Int. J. Geriatr. Psychiatry 32, 193–200 (2017).
33. Strawbridge, W. J., Deleger, S., Roberts, R. E. & Kaplan, G. A. Physical activity reduces the risk of subsequent depression for older
adults. Am. J. Epidemiol. 156, 328–334 (2002).
34. Choi, K. W. et al. Assessment of bidirectional relationships between physical activity and depression among adults a 2-sample
mendelian randomization study. JAMA Psychiat. 76, 399–408 (2019).
35. Ainsworth, B., Cahalin, L., Buman, M. & Ross, R. The current state of physical activity assessment tools. Prog. Cardiovasc. Dis. 57,
387–395 (2015).
Acknowledgements
This research was funded by the Aragon Regional Government Fund as reference group (Grupo DGA B12), by
fondos FEDER “otra manera de hacer Europa”, and by Grant PI19/00948 from the Instituto de Salud Carlos III.
J.L.P.L. received a Grant FPU 2016 (FPU16/02539) from the Ministerio de Educación, Cultura y Deporte (Spain).
Author contributions
J.L.P.L. designed and conceptualized the study, analyzed and interpreted the data, and drafted the manuscript for
intellectual content. B.M.F. analyzed and interpreted the data and drafted the manuscript for intellectual content.
A.G.A. and E.L. interpreted the data and drafted the manuscript for intellectual content. J.A.C. designed and
conceptualized the study, interpreted the data, and drafted the manuscript for intellectual content. All authors
approved the final version of the manuscript.
Competing interests
The authors declare no competing interests.
Additional information
Supplementary Information The online version contains supplementary material available at https://doi.org/
10.1038/s41598-022-05563-7.
Correspondence and requests for materials should be addressed to B.M.-F.
Reprints and permissions information is available at www.nature.com/reprints.
Publisher’s note Springer Nature remains neutral with regard to jurisdictional claims in published maps and
institutional affiliations.
Open Access This article is licensed under a Creative Commons Attribution 4.0 International
License, which permits use, sharing, adaptation, distribution and reproduction in any medium or
format, as long as you give appropriate credit to the original author(s) and the source, provide a link to the
Creative Commons licence, and indicate if changes were made. The images or other third party material in this
article are included in the article’s Creative Commons licence, unless indicated otherwise in a credit line to the
material. If material is not included in the article’s Creative Commons licence and your intended use is not
permitted by statutory regulation or exceeds the permitted use, you will need to obtain permission directly from
the copyright holder. To view a copy of this licence, visit http://creativecommons.org/licenses/by/4.0/.
© The Author(s) 2022
Scientific Reports | (2022) 12:2264 | https://doi.org/10.1038/s41598-022-05563-7 8
Vol:.(1234567890)You can also read