A focus on Lichfield 2015 - October 2015 - evidence base
←
→
Page content transcription
If your browser does not render page correctly, please read the page content below
A focus on Lichfield 2015
October 2015
Document details

Title                       A Focus on Lichfield, 2015

                            A comprehensive, local evidence base, to support
                            Lichfield District Council’s development of their strategic
                            plan.
Description
                            This is the reference document; there is also a summary
                            of the key issues.

Date created                September 2015 (final version and amendments)

                            Insight, Planning and Performance Team, Staffordshire
Produced by
                            County Council
                            Phillip Steventon (Insight, Planning and Performance)
Contributors                Rachel Caswell (Insight, Planning and Performance)
                            Members of the working group (multi-partner)
                            Phillip Steventon, Public Health Analyst, Insight Team
Contact                     phillip.steventon@staffordshire.gov.uk
                            01785 276529

Geographical coverage       Lichfield district

Time period covered         Various (depending on indicator and availability of data).

Formats and access          Word and pdf

                            If you wish to reproduce this document either in whole, or
Usage statement
                            in part, please acknowledge the source and the author(s).
                            This product includes mapping data licensed from
                            Ordnance Survey with the permission of the Controller of
Maps                        Her Majesty's Stationery Office. © Crown copyright and /
                            or database right 2015. All rights reserved. Licence
                            Number 100019422.
                            Staffordshire County Council, while believing the
                            information in this publication to be correct, does not
                            guarantee its accuracy nor does the County Council
Copyright and disclaimer
                            accept any liability for any direct or indirect loss or
                            damage or other consequences, however arising from the
                            use of such information supplied.

Staffordshire Observatory                                                         Page 2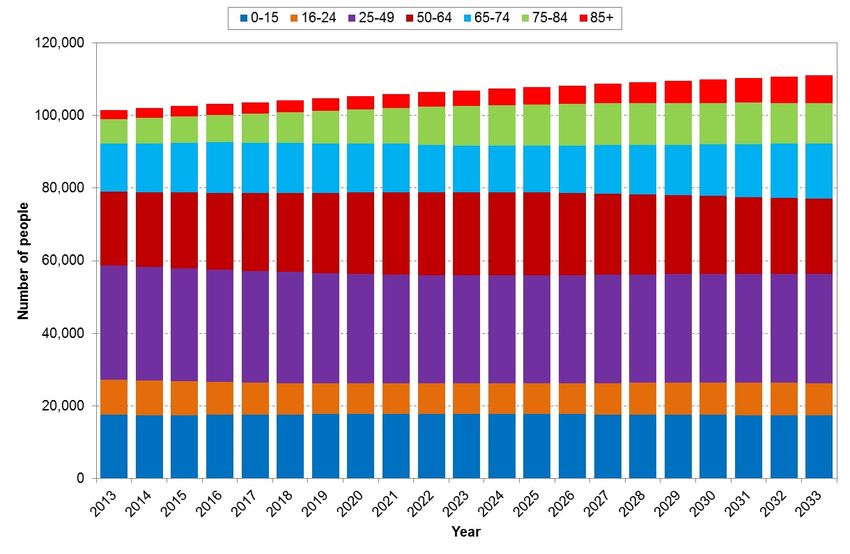
Contents

Document details ....................................................................................................... 2
Glossary of terms ....................................................................................................... 6
1    Purpose of this work ............................................................................................ 7
2    Approach ............................................................................................................... 7
3    Context .................................................................................................................. 8
4    Demography ......................................................................................................... 8
    4.1      Population age structure.................................................................................................... 8
    4.2      Population projections ....................................................................................................... 9
    4.3      Social inclusion ................................................................................................................ 10
     4.3.1      Loneliness and isolation .................................................................................................. 10
     4.3.2      Connectivity .................................................................................................................... 11
    4.4      Movement of people in and out of Lichfield ................................................................... 12
    4.5      Geodemographic profile .................................................................................................. 16
    4.6      Emerging observations, implications and possible solutions ...................................... 17
5    Business, employment and prosperity (including transport) ....................... 21
    5.1      Nature of employment in Lichfield .................................................................................. 21
     5.1.1      Tourism and leisure ........................................................................................................ 21
    5.2      Business start-ups and survival rates ............................................................................ 22
    5.3      Characteristics of the workforce in Lichfield ................................................................. 23
     5.3.1      Employment rates (including unemployment rates and benefits) .................................... 23
     5.3.2      Earnings ......................................................................................................................... 24
     5.3.3      Household income .......................................................................................................... 24
     5.3.4      Worklessness ................................................................................................................. 24
     5.3.5      Travel to work ................................................................................................................. 25
    5.4      Engagement in volunteering and other community activities ...................................... 27
     5.4.1      Volunteering.................................................................................................................... 27
     5.4.2      Carers ............................................................................................................................. 28
    5.5      Emerging observations, implications and possible solutions ...................................... 29
6    Education and skills .......................................................................................... 32
    6.1      GCSE attainment .............................................................................................................. 33
    6.2      Young people not in education, employment or training (NEETs) ............................... 33
    6.3      No qualifications ............................................................................................................... 33
    6.4      Further education (NVQ and apprenticeships) ............................................................... 33
    6.5      Emerging observations, implications and possible solutions ...................................... 34
7    Housing in Lichfield ........................................................................................... 35
    7.1      Housing stock in Lichfield ............................................................................................... 35
     7.1.1      Occupancy (include overcrowding) ................................................................................. 36
     7.1.2      Vacant dwellings ............................................................................................................. 36
    7.2      Housing affordability ........................................................................................................ 36

Staffordshire Observatory                                                                                                                   Page 3
7.2.1       Homelessness ................................................................................................................ 39
    7.3       Housing and health .......................................................................................................... 40
     7.3.1       Non-decent homes ......................................................................................................... 40
    7.4       Cold homes and health .................................................................................................... 40
     7.4.1       Fuel poverty .................................................................................................................... 40
    7.5       Emerging observations, implications and possible solutions ...................................... 42
     7.5.1       Housing and affordability ................................................................................................ 42
     7.5.2       Housing and health ......................................................................................................... 42
     7.5.3       Supporting the local economy ......................................................................................... 45
8    Health................................................................................................................... 45
    8.1       Teenage pregnancy .......................................................................................................... 45
    8.2       Lifestyles ........................................................................................................................... 48
     8.2.1       Alcohol ............................................................................................................................ 48
     8.2.2       Excess weight ................................................................................................................. 48
    8.3       Being active ...................................................................................................................... 49
    8.4       NHS health checks ........................................................................................................... 50
    8.5       Long term conditions ....................................................................................................... 50
    8.6       Mental health conditions in Lichfield .............................................................................. 52
    8.7       People with learning disabilities in Lichfield .................................................................. 53
    8.8       Dementia ........................................................................................................................... 54
    8.9       Accidents .......................................................................................................................... 54
    8.10      Mortality............................................................................................................................. 56
     8.10.1          Life expectancy ........................................................................................................... 56
     8.10.2          Main causes of death .................................................................................................. 59
     8.10.3          Preventable mortality .................................................................................................. 59
     8.10.4          Excess winter deaths .................................................................................................. 60
    8.11      Emerging observations, implications and possible solutions ...................................... 61
     8.11.1          NHS Health Checks .................................................................................................... 62
     8.11.2          Reducing the risk of winter mortality ........................................................................... 63
9    Crime and anti-social behaviour ...................................................................... 65
    9.1       Violent crime ..................................................................................................................... 65
    9.2       Anti-social behaviour ....................................................................................................... 65
    9.3       Sexual assault ................................................................................................................... 65
    9.4       Re-offending...................................................................................................................... 65
    9.5       What do residents says .................................................................................................... 65
    9.6       Emerging observations, implications and possible solutions ...................................... 65
10         Environment ................................................................................................... 66
    10.1      Deprivation ........................................................................................................................ 67
    10.2      Rurality .............................................................................................................................. 67
    10.3      Green space utilisation .................................................................................................... 68
    10.4      Air quality in Lichfield ...................................................................................................... 68
    10.5      What do residents say?.................................................................................................... 69

Staffordshire Observatory                                                                                                                    Page 4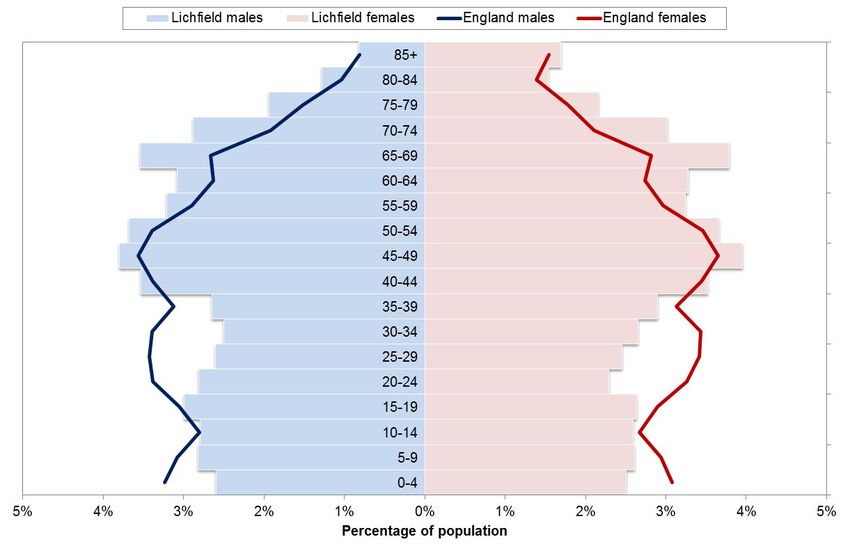
10.6     Emerging observations, implications and possible solutions ...................................... 69
11       Leisure and recreation ................................................................................... 71
  11.1     Leisure centres ................................................................................................................. 71
  11.2     Active travel; walking and cycling in Lichfield ............................................................... 72
  11.3     Emerging observations, implications and possible solutions ...................................... 73
12       Observations and emerging recommendations ......................................... 74

Staffordshire Observatory                                                                                                           Page 5

Glossary of terms
Definitions of some terminology that is used within the work are described below.
Age-standardised rate (ASR)
These are used in sections of the document to allow direct and fair comparisons of disease or
mortality to be made between different areas or groups which may have very different age
structures. The method adjusts the crude rate by eliminating the effect of differences in age
structure. Throughout the profile, age-specific rates of the local population are applied to a
standard population. The overall rate provides a summary rate of what would occur in the
local population if it had the standard population’s age structure.
Confidence intervals and statistical significance
The document uses upper and lower limits to indicate the uncertainty or variability of the value
and also for comparison purposes. The upper and lower limits have been calculated to a
95% confidence level. Therefore when a value has lower and upper limits, we can be 95%
sure that the value will be within this range.
Throughout this document, confidence intervals are used to compare different values so it is
possible to compare a local value to a national one to see if it is statistically similar, lower or
higher. These confidence intervals are displayed on some of the charts at the end of the bar
to illustrate the possible variability of the value. If the confidence interval overlaps the
England (or other comparator) interval, the difference is not statistically significant. If it does
not overlap the difference is statistically significant.
Prevalence
Prevalence is a snapshot of the proportion of individuals in a population who have a disease
or condition at a particular point in time.
Staffordshire Observatory Page 6
1 Purpose of this work
To inform Lichfield District Council’s (LDC) strategic direction Staffordshire County Council’s Insight &
Planning and Performance Team was commissioned to produce a new evidence base; with a strong
link to local data and evidence, to support the identification of local priorities, inform local decision
making and lay the ground work for future research.
This work focusses on the priority issues identified from existing intelligence and the expert judgement
of the multi-organisational working group which was set up to steer the research. As such it does not
attempt to take account of everything that happens in Lichfield, children and families, for example,
whilst very important are not addressed in any detail here. The work will complement and strengthen
the wider evidence base around Lichfield’s priorities and potential actions that LDC needs to inform
their strategic direction with confidence for the forthcoming years.
2 Approach
To focus the new evidence base, a review of existing plans and analyses was undertaken to develop
a number of lines of enquiry that could be explored in more detail; including Lichfield’s Locality and
Health and Wellbeing profiles1. Issues were identified when Lichfield was statistically worse than a
comparator (normally England) and emerging concerns were identified when trends over time
suggested a worsening situation. The profiles also highlight inequalities in health and wellbeing
outcomes. For example, there are marked gaps in life expectancy between different communities at
ward level for both men and women.
The lines of enquiry were then considered by the working group who reflected on the following key
questions:
Do these suggested lines of enquiry fit with local intelligence concerning high-priority issues in
Lichfield?
What local data is available that would allow us to better understand these lines of enquiry?
Being mindful of LDC’s role in helping to deliver or maintain services in relation to these
issues, who do they need to work with, what do they need to do to achieve and also what the
public can do for themselves?
There was much discussion early in the process about how to frame the work to best answer the
questions raised by the working group and to reflect the cross-cutting nature of much of the evidence.
But for the purposes of summarising the key messages and evidence it was agreed that the work
would be framed around the following domains:
Demography
Business, employment and prosperity (including transport)
Education & skills
Health
Housing
Crime and anti-social behaviour
Environment
Leisure & tourism
Links with existing local plans were considered; these included the new Lichfield District Local Plan
Strategy 2015, Lichfield District Housing Strategy (2013-2017) and Lichfield District Homelessness
Strategy & Review 2013-2018.
To support this work a literature review was undertaken which considered potential local action
around these lines of enquiry. The research showed that there are many examples from other areas
which have either been evaluated and shown to be effective, or are considered to be an example of
effective action. These have been shared as case studies in this report to inspire further action.
1 Lichfield District Council’s Locality Profile (March 2015) and Health and Wellbeing Profile (2015).
Staffordshire Observatory Page 7
3     Context
Having a strong evidence base to identify priorities and support local action is more important than
ever. All councils are facing a tough and complex set of pressures – cuts in funding, rising demand
for services and economic growth challenges. Councils have already responded quickly with what
can be considered more traditional approaches2 and more sophisticated and transformational action;
but further cuts loom. If councils are to continue to achieve the level of savings required of them they
will have to shift towards the latter more supported by strong leadership3.

Going forwards robust evidence-based insight and intelligence, and engaging with and understanding
the needs of residents and communities, will be critical for councils as they attempt to translate
priorities into smarter interventions, choices and ways of working.

4     Demography
4.1 Population age structure
Of the 102,100 who live in Lichfield (2014) 17,400 (17%) are children and young people (0-16) and
23,100 (23%) are older people aged 65 and over. These proportions are lower and higher than the
national averages respectively (19% and 18%). Compared with England there are fewer children and
adults aged less than 40 years. There are however more adults aged over 40 in Lichfield compared
to the national average (Figure 1).

Figure 1 Population structure of Lichfield, 2014

Source: 2014-mid-year population projections, Office for National Statistics, Crown copyright.

Most wards (22 out of 26) have higher proportions of older people aged 65+ than England. Armitage
with Handsacre, Boley Park, Chasetown, Fazeley, King's Bromley, Leomansley, Little Aston,

2
 These include salary freezes and changes to staff terms and conditions, reducing the number of tiers of senior and middle
management and shared services to reduce overheads.
3
 Good Practice in Local Government Savings, Shared Intelligence and Grant Thornton UK LLP
Department for Communities and Local Government, © Queen’s Printer and Controller of Her Majesty’s Stationery Office,
December 2014.

Staffordshire Observatory                                                                                            Page 8

Shenstone and Stowe also have higher proportions of people aged 85 or over. Only three wards,
Alrewas and Fradley, Chadsmead and Summerfield have high proportions of children under 16.

4.2 Population projections
Latest ONS population projections are trend-based and use the 2012 mid-year population estimates
as the base year. They provide an indication of expected levels of population growth over a 20 year
period; making assumptions about future levels of fertility, mortality and migration based on levels
observed over a five year reference period. Therefore they show what the future population, by age
and sex, might be if recent trends continue. However, they take no account of the potential impact of
policy, or development plans of local authorities.

The overall population for Lichfield is projected to increase by around 5,300 (5%) between 2014 and
2024 (from 102,100 to 107,400). The population is projected to see a significant growth in people
aged 65 and over (28,500, 23%) and in particular those aged 85 and over (4,500, 74%) (Figure 2).
The rate of increase in the number of older people in Lichfield is faster than the England average and
equates to 6,000 additional residents aged 75 and over by 2024 (Figure 3).

Figure 2 Population projections for Lichfield, 2013-2033

Source: 2012-based population projections, Office for National Statistics, Crown copyright.

Staffordshire Observatory                                                                      Page 9

Figure 3 Projected population change between 2014 and 2024

Source: 2012-based population projections, Office for National Statistics, Crown copyright.

4.3     Social inclusion
Loneliness and social isolation are key issues for the health and social care system. Marmot’s 2011
Review4 included reducing social isolation across the social gradient as a priority objective. In 2012
the Government’s Care and Support White Paper also recognised loneliness and social isolation as a
large problem for society as a whole5.

4.3.1 Loneliness and isolation
According to 2011 Census 12.2% (5,032) of people aged 65 or over live alone in Lichfield, this is
similar to the national average (12.4%) (Table 1).

4
 Marmot Review. Fair Society, Healthy Lives: Strategic Review of Health Inequalities in England Post 2010. London: Marmot
Review; 2010.
5
 Caring for our future: reforming care and support , Department of Health White Paper, The Stationery Office, 2012, London.

Staffordshire Observatory                                                                                          Page 10
Table 1 Lone pensioner households, 2011
                                                                                                      Statistical
                                                       Number               Percentage               difference to
                                                                                                       England
            Cannock Chase                                4,636                 11.4%                     Lower
            East Staffordshire                           5,862                 12.4%                    Similar
            Lichfield                                    5,032                 12.2%                    Similar
            Newcastle-under-Lyme                         7,115                 13.5%                    Higher
            South Staffordshire                          5,932                 13.3%                    Higher
            Stafford                                     7,123                 12.8%                    Higher
            Staffordshire Moorlands                      5,637                 13.5%                    Higher
            Tamworth                                     3,434                 10.9%                    Lower
            Staffordshire                               44,771                 12.6%                    Higher
            West Midlands                               289,571                12.6%                    Higher
            England                                   2,725,596                12.4%

Source: Census, 2011.

Four wards in Lichfield have high proportions of households with lone pensioners – Boney Hay (199,
15.1%), Chasetown (265, 16.4%), Leomansley (488, 15.9%) and Stowe (409, 17.6%). Of these lone
pensioners 59.5% (2,992) have a long term health problem or disability - this is similar to the national
average (59.6%). The percentage of lone pensioners with a long term health problem or disability is
significantly higher than England in two wards; Burntwood Central (106, 67.9%) and Chasetown (191,
72.1%).

Using 2014 mid-year population figures for Lichfield it has been estimated that around 500 residents
aged 65+ are at risk of loneliness.

4.3.2 Connectivity
Reliable and affordable public transport is in the top ten issues mentioned by residents aged 65 years
and over. Responses included ‘to be able to get about as cheaply as possible’, ‘bus passes for the
elderly’, ‘access to transport to avoid isolation’ and ‘access to the services I need’6. In Lichfield
around 18% of people aged 65 and over have no private transport (i.e. access to a car). This
increases to 55% of people aged 85 and over (Figure 4).

6
    Campaign for Older People: Insight and Evidence supporting the strategic approach (SCC, 2012).

Staffordshire Observatory                                                                                            Page 11
Figure 4 Access to private transport: proportion of residents who have no car or van by age, 2011 Source: Census, 2011. 4.4 Movement of people in and out of Lichfield This section looks at internal migration in the year ending June 2014 by age, gender and area. An internal migrant is an individual who moved into the Lichfield area from England or Wales or out of the Lichfield region to the rest of England or Wales. International moves into or out of Lichfield are not included. Movements are categorised as inflows, outflows and net flows. Appendix 1 gives a short explanatory note around each category. Over the previous 12 months 10,110 people moved between Lichfield and other local authorities in England or Wales; 5,180 people came to live in Lichfield and 4,720 left. This resulted in a net inflow of 250 people and Lichfield is one of four districts in Staffordshire with a net inflow (Table 2). Staffordshire Observatory Page 12
Table 2 Moves between Staffordshire districts and rest of England and Wales; all persons, all
ages, registered during the year ending June 2014
        Area                                         Inflow              Outflow              Balance
                                                       Male
        Cannock Chase                                 1,740                1,710                 30
        East Staffordshire                            2,170                2,210                 -40
        Lichfield                                     2,420                2,410                 10
        Newcastle-under-Lyme                          3,180                3,140                 40
        South Staffordshire                           2,650                2,360                290
        Stafford                                      2,830                3,080                -250
        Staffordshire Moorlands                       1,920                1,640                280
        Tamworth                                      1,330                1,580                -250
        West Midlands                                52,730               54,070               -1,340
        England                                      594,580             599,930               -5,350
                                                      Female
        Cannock Chase                                 1,890                1,910                 -20
        East Staffordshire                            2,270                2,360                 -90
        Lichfield                                     2,740                2,550                190
        Newcastle-under-Lyme                          3,450                3,430                 20
        South Staffordshire                           2,780                2,620                160
        Stafford                                      2,670                2,580                 90
        Staffordshire Moorlands                       2,060                1,800                260
        Tamworth                                      1,390                1,630                -240
        West Midlands                                56,410               58,030               -1,620
        England                                      650,200             653,870               -3,670
                                                     Persons
        Cannock Chase                                 3,630                3,640                 -10
        East Staffordshire                            4,420                4,540                -120
        Lichfield                                     5,180                4,930                250
        Newcastle-under-Lyme                          6,640                6,550                 90
        South Staffordshire                           5,430                4,970                460
        Stafford                                      5,490                5,680                -190
        Staffordshire Moorlands                       3,950                3,440                510
        Tamworth                                      2,700                3,180                -480
        West Midlands                                109,160             112,080               -2,920
        England                                     1,244,740           1,253,810              -9,070

Note: Due to rounding it is possible that figures in this table may not add up to column or row totals. This
rounding is applied to each flow to preserve the highest level of precision possible while avoiding disclosure.

Source: Office for National Statistics, Crown Copyright 2015.

Figure 5 shows the number of people who had moved into and out of Lichfield by age band over the
past 12 months. The blue line shows the number of people who moved in to Lichfield (inflow) and the
orange line shows the number of people who moved out of Lichfield (outflow). The bars show the
netflow and when the figure for netflow is positive, more people came to Lichfield than left. For
people aged 15-19 there was a net outflow of 410. Overall this is similar to the rest of Staffordshire

Staffordshire Observatory                                                                                 Page 13
and is likely to be explained by young adults moving out of Lichfield for higher education; there is no university in the City. Levels of movement into Lichfield remain comparatively high through the 20s, 30s and 40s. The netflow for people aged between 45 and 64 is fairly low and from 65 onwards more people move to Lichfield than leave, especially after 80. This may reflect people moving into the area to start a family, becoming settled in their employment, and in relationships, as well as because they have school-age children and then more older people move to Lichfield maybe for care homes7. There is net inflow of people aged 20-44 (420) and of those aged 65+ (140). Figure 5 Movement of people in and out of Lichfield by age, year ending June 2014 Source: Office for National Statistics, Crown Copyright 2015. Of the 10,110 moves between Lichfield and the rest of England & Wales during the year ending June 2014; a total of 5,290 (52%) were females and 4,830 were males (48%). This means that for every 100 female movers, there were 91 male movers. Split by gender, the patterns for both sexes were very similar. Across all ages, although for females in their 20s to mid-30s there were more inflows than outflows and therefore a greater overall netflow to Lichfield. For all ages, partially because of this, the net inflow is 10 for males and 190 for females. For males and females aged 15-19, net outflow was 210 higher than net inflow for males and 200 higher for females. Over the past four years there appears to be a consistent net inflow from other parts of England and Wales into Lichfield. Traditionally, most of the net migration into Lichfield is from Birmingham and Walsall. In terms of net outflow migration from Lichfield to other parts of England and Wales, there is a large movement each year towards East Staffordshire (Table 3). 7 Once children are at school moves are much less common, potentially because of the disruption it would cause the children as well as the parents. Staffordshire Observatory Page 14
Table 3 Internal migration moves into and out of Lichfield, by region, 2011-2014
        Area                                        Inflows             Outflows             Net migration
                                                       2011
        Cannock Chase                                 570                  550                    20
        Birmingham                                    810                  420                   390
        Tamworth                                      490                  350                   140
        East Staffordshire                            200                  340                   -140
        Walsall                                       390                  280                   110
        Stafford                                       90                  110                    -20
        Other regions                                1,800                1,880                   -80
        Total                                        4,350                3,930                  420
                                                       2012
        Cannock Chase                                 620                  570                    50
        Birmingham                                    780                  460                   320
        Tamworth                                      450                  430                    20
        East Staffordshire                            200                  290                    -90
        Walsall                                       420                  250                   170
        South Derbyshire                               70                  120                    -50
        Other regions                                1,810                2,110                  -300
        Total                                        4,350                4,230                  120
                                                       2013
        Cannock Chase                                 710                  640                    70
        Birmingham                                    770                  470                   300
        Tamworth                                      540                  420                   120
        East Staffordshire                            210                  280                    -70
        Walsall                                       510                  270                   240
        South Derbyshire                               50                  110                    -60
        Other regions                                1,860                1,900                   -40
        Total                                        4,650                4,090                  560
                                                       2014
        Cannock Chase                                 650                  650                    0
        Birmingham                                    880                  520                   360
        Tamworth                                      510                  440                    70
        East Staffordshire                            190                  360                   -170
        Walsall                                       480                  320                   160
        Stafford                                      110                  120                    -10
        Other regions                                2,110                2,310                  -200
        Total                                        4,930                4,720                  210

Note: Taken from Square Matrix of internal migration moves between English regions, Wales, Scotland and
Northern Ireland, Year Ending 2011 – 2014.

Source: Office for National Statistics: Migration Statistics Unit, © Crown copyright 2015.

Staffordshire Observatory                                                                                    Page 15
4.5 Geodemographic profile
Mosaic Public Sector 6, released in 2014, is a way of analysing people by where they live in terms of
an individual’s demographics, lifestyles and behaviours. It allows interventions to be targeted more
effectively in an appropriate style and language which is suited to the different lifestyle groups.
The most common groups across Lichfield making up 62% of the population fall within five Mosaic
groups:
B Prestige Positions (17.5%)
D Domestic Success (12.6%)
H Aspiring Homemakers (11.7%)
F Senior Security (10.6%)
A Country Living (9.8%)
Some wards have high proportions of their populations in a single segmentation group, for example,
Colton and Mavesyn Ridware, King's Bromley, Longdon and Mease and Tame wards are mostly
made up of the “Country Living” group. Boley Park and Little Aston residents are mostly from the
“Prestige Positions” group.
Table 4 Mosaic lifestyle groups in Lichfield
Mosaic group Lichfield Staffordshire West Midlands England
A Country Living 9.8% 9.3% 6.8% 5.9%
B Prestige Positions 17.5% 8.6% 6.9% 7.6%
C City Prosperity 0.1% 0.0% 0.3% 4.5%
D Domestic Success 12.6% 10.1% 6.8% 9.0%
E Suburban Stability 9.6% 10.9% 7.1% 6.2%
F Senior Security 10.6% 9.8% 8.7% 7.8%
G Rural Reality 6.4% 5.8% 3.6% 5.3%
H Aspiring Homemakers 11.7% 12.8% 11.1% 10.0%
I Urban Cohesion 0.2% 0.6% 8.0% 6.7%
J Rental Hubs 1.8% 2.0% 4.3% 6.9%
K Modest Traditions 4.6% 7.1% 6.4% 4.3%
L Transient Renters 3.1% 6.4% 7.1% 6.0%
M Family Basics 6.0% 8.5% 11.6% 8.8%
N Vintage Value 4.1% 4.7% 6.5% 4.7%
O Municipal Challenge 1.0% 2.5% 4.2% 5.5%
U Unclassified 0.9% 0.8% 0.5% 0.6%
Total population 100.0% 100.0% 100.0% 100.0%
Key: Highlights top five groups
Source: Experian Public © 2014 Experian. All rights reserved.
Key features for the 15 groups are shown in Table 5.
Staffordshire Observatory Page 16Table 5 Key features of Mosaic groups
Mosaic group Key features
Rural locations, well-off homeowners, attractive detached homes, higher self-
A Country Living
employment, high car ownership, high use of internet
High value detached homes, married couples, managerial and senior positions,
B Prestige Positions supporting students and older children, high assets and investments, online
shopping and banking
High value properties, central city areas, high status jobs, low car ownership, high
C City Prosperity
mobile phone spend, high internet use
Families with children, upmarket suburban homes, owned with a mortgage, three or
D Domestic Success
four bedrooms, high internet use, own new technology
Older families, some adult children at home, suburban mid-range homes, three
E Suburban Stability
bedrooms, have lived at same address some years, research on internet
Elderly singles and couples, homeowners, comfortable homes, additional pensions
F Senior Security
above state, don't like new technology, low mileage drivers
Rural locations, village and outlying houses, agricultural employment, most are
G Rural Reality
homeowners, affordable value homes, slow internet speeds
Younger households, full-time employment, private suburbs, affordable housing
H Aspiring Homemakers
costs, starter salaries, buy and sell on eBay
Mature age, homeowners, affordable housing, kids are grown up, suburban
I Urban Cohesion
locations, modest income
Elderly, living alone, low income, small houses and flats, need support, low
J Rental Hubs
technology use
Aged 18-35, private renting, singles and sharers, urban locations, young
K Modest Traditions
neighbourhoods, high use of smartphones
Settled extended families, city suburbs, multicultural, own three bedroom homes,
L Transient Renters
sense of community, younger generation love technology
Social renters, low cost housing, challenged neighbourhoods, few employment
M Family Basics
options, low income, mobile phones
Families with children, aged 25 to 40, limited resources, some own low cost homes,
N Vintage Value
some rent from social landlords, squeezed budgets
Private renters, low length of residence, low cost housing, singles and sharers, older
O Municipal Challenge
terraces, few landline telephones
Source: Experian Public © 2014 Experian. All rights reserved.
4.6 Emerging observations, implications and possible solutions
An ageing population is a global and local trend, whilst birth rates across the world have declined over
the last century; improvements in health, lifestyles and living standards have meant that people are
generally living much longer. The number of people living in Lichfield aged 65 and over has already
exceeded the number of children under the age of 16; projections suggest Lichfield will continue to
get older and bigger.
It is clearly positive that individuals are living longer, and it should be celebrated, as the growing
number of older people may create new economic and social opportunities. However, this
demographic change also presents many challenges to Lichfield, and although people are living
longer more time is being spent in ill-health. Living longer brings challenges such as increasing
demand on health services and long-term care and reinforces the importance of prevention. Going
forwards councils will not be able to afford to carry on doing things the way they have always done in
the way they have always done them, not least because there’s limited funding. Lichfield is no
different and is experiencing the same pressures: The dependency ratio for older people in Lichfield
(measures the number of people aged over 65 who depend on people of working age (16-64)) is 38
older people for every 100 people of working age. This is higher than the England average and of the
26 wards in Lichfield, 23 also have higher than average dependency ratios for older people. This
suggests that in the future there will be an even greater responsibility on working age people to
support older (and sicker) adults than in any previous generation.
Older people are particularly vulnerable to social isolation, and loneliness, this can be due to loss of
friends and family, mobility and/or income. Social isolation and loneliness have a negative impact on
an individual’s health and wellbeing. As well as links to physical and emotional health, loneliness can
lead to individuals visiting their GP more frequently and losing their independence at an earlier age
Staffordshire Observatory Page 17than average. Lone pensioners are particularly at risk of loneliness and social isolation, and Lichfield
has a similar than average number of lone pensioner households, with numbers projected to increase
further. Given that almost three in five lone pensioners also have a limiting long-term illness there may
be in an increase in the demand for more formal care.
Loneliness is a bigger problem than simply an emotional experience. Research shows that loneliness
and social isolation are harmful to our health: lacking social connections is a comparable risk factor
for early death as smoking 15 cigarettes a day, and is worse for us than well-known risk factors such
as obesity and physical inactivity8.
Some practical ideas to support an ageing population and a positive ageing experience in Lichfield
are put forward in Table 6.
Table 6 Practical ideas to support an ageing population in Lichfield
All local plans / strategies – build ‘healthy ageing’ into the details and priorities of
the plan
Use knowledge about your local population and their health and wellbeing
needs –current and predicted
Use local powers - to influence and challenge planning applications - e.g. housing
developments must address changing needs across the life-course
Design in ‘age’ and adapt facilities in the area – e.g. seats, toilets, pavements,
raised beds for community gardening and allotments
Local green space – Are adaptations needed to make it accessible, attractive, and
safe?
Promote volunteer community schemes such as Village Agents to connect with
older people in the community and tackle isolation
Promote health and wellbeing schemes in the area – e.g. Walking for Health,
Growing and Gardening Schemes
Community and volunteer transport
Dementia friendly environments
Ongoing engagement and events with partners and older people
Anyone can experience social isolation and loneliness. Figure 6 illustrates when and how social
isolation can impact on the individual across key stages of the life course, as well as the key
components of an effective intervention for each life course stage.
8 Campaign to end loneliness - connections in older age.
Staffordshire Observatory Page 18Figure 6 The impact of social isolation across the life-course Source: Public Health England and UCL Institute of Health Equity. 2015. Local action on health inequalities: Reducing social isolation across the life-course. Staffordshire Observatory Page 19
Learning from local areas and organisations already addressing social isolation shows that much can
be done to tackle social isolation using existing community assets − particularly relevant in view of
local spending constraints coupled with increasing demands for health and social care. An example
of improving social connectedness among older people is the LinkAge programme in Bristol (Table 7).

Table 7 Case Study – LinkAge, Bristol

        Description: The LinkAge programme aims to promote and enhance the lives of older people
        (aged 55-plus) through the facilitation and the development of a range of activities. Its
        approach includes fostering social awareness and encouraging older people to share their skills
        with volunteers, young people and others within their community. LinkAge aims to inspire older
        people and others to share their time and experiences with other older people who for one
        reason or another have become isolated. The goal of LinkAge is for older people to have
        improved physical health through activities, and improved social connectedness through
        befriending.

        Target groups: People aged 55 and over, with a particular focus on older people from ethnic
        minority groups.

        Type of intervention: The intervention provides a range of services focused on befriending
        and encouraging physical activity.

        Impact: The Centre for Social Justice and the University of the West of England conducted an
        analysis of the service which found that it was beneficial to participants. The Centre for Social
        Justice described it as, “an excellent example of such an approach from which many other local
        authorities could learn”.

        Surveys of service recipients found both increased physical activity and social connectedness.
        When asked about frequency of exercise upon joining the service, 26.7% or respondents said
        they exercised seven days a week. In the follow-up survey this had increased to 40%.

        When asked about social connectedness on joining the service, the average score was 14.5
        (on a scale where 0 = very socially isolated and 24 = very or highly socially connected). In the
        follow-up survey six months later, the average was 22.8 – a considerable improvement.

        Service users’ comments included: “LinkAge is a saviour. I gave up work six months ago
        and it was incredibly important in helping me make the transition” – participant in Tai Chi class.

        “LinkAge was a godsend – I could be not only active, I could be doing and helping” – advisory
        group member and volunteer.

        Evidence on costs: An evaluation in the Whitehall and St George area found that for every £1
        invested there was a social return on investment (SROI) of £1.20. Cost saving benefits for the
        NHS come through early intervention, saving money from avoiding later stage (and more
        expensive) interventions. By far the biggest added value that the project brings into the hub is
        the large amount of unpaid volunteer time provided by individuals to help support its activities.
        Costs incurred included staffing and renting spaces for activities.

        This SROI was deemed to be both considerable and an underestimate, the rationale being that
        the hub was only in its first year of existence at the time of evaluation. A considerable amount
        of time was spent bedding down activities and developing beneficiary confidence in the
        activities and the approach. Therefore a lot of volunteer and community development worker
        time was spent in start-up rather than delivery.

Source: Public Health England and UCL Institute of Health Equity. 2015. Local action on health inequalities:
Reducing social isolation across the life-course and Centre for Social Justice. Linkage Evaluation, 2013.

Housing within the District will need to reflect what will be a very different demographic in twenty
years’ time. Analysis has already highlighted the ageing population in Lichfield. Many young people
(aged 15-19) choose to leave the district rather than stay but there is a net inflow of younger adults
(20-29). It is not known how much of this movement is job-related/due to availability of affordable

Staffordshire Observatory                                                                                    Page 20
housing but there is a desire in LDC’s Local Plan9 to retain younger people, economically active
people and promote mixed and balanced communities throughout Lichfield by, in part, addressing
housing and housing affordability issues.
5 Business, employment and prosperity (including transport)
This section shows a range of indicators associated with business and employment in Lichfield, from
unemployment and worklessness, to earnings and commuting patterns. These issues have a big
influence on the quality of life of Lichfield’s residents. Unemployment, for example, can lead to a
number of social and psychological disadvantages. People who are unemployed tend to have higher
levels of premature mortality and poorer general health than those who work.
5.1 Nature of employment in Lichfield
The nature of employment in the District has changed significantly over time with the decline of
traditional engineering industries. There has been a substantial increase in distribution activities,
particularly with the development of employment at Fradley airfield, however the significance of
Lichfield as a centre for administration and professional services has continued (Table 8).
Table 8 Employment by Sector in Lichfield, 2013
Number of
Employee Jobs by Industry Percentage
Employees
Primary Services (Agriculture and Mining) 100 0.1%
Energy and Water 500 1.2%
Manufacturing 4,600 11.3%
Construction 2,400 5.8%
Services 33,500 81.6%
Wholesale and Retail (including Motor Trades) 6,800 16.6%
Transport Storage 1,800 4.5%
Accommodation and Food Services 3,600 8.9%
Information and Communication 1,000 2.5%
Financial and Other Business Services 7,900 19.2%
Public Admin, Education and Health 9,300 22.7%
Other Services 3,000 7.3%
Source: ONS business register and employment survey.
5.1.1 Tourism and leisure
Tourism and leisure is a wide ranging sector containing traditional tourism industries such as
accommodation establishments, museums, historical buildings, gardens and theme parks. It also
contains primarily based leisure based industries such as libraries and sport/fitness facilities that
largely cater for local residents rather than visitors to the area.
It is a major economic driver in Lichfield District and is something the district council and partners are
committed to supporting. During 2014/15 the number of visitors to Lichfield and the estimated visitor
spend was £2,918,915 and £96,324,195 respectively; a 3% increase on the previous year. These
figures given an overview of the health of the tourism market and the impact of the Council’s tourism
activities are having in generating visitors to the district10.
9
Lichfield District Council's Local Plan Strategy, 2008-2029, adopted February 2015.
10
End of Year Performance Overview, 2014/15, for Development Services, June 2015.
Staffordshire Observatory Page 215.2 Business start-ups and survival rates Lichfield businesses are vital to the prosperity of the local area. Business creation, local jobs, incomes and skilled workers will be key to driving up productivity and making Lichfield competitive as well as attracting companies and inward investment to the area. When looking at the enterprise of an area, it is important to consider business start-up and survival rates. An area may have high start-up rates, but if survival rates are low, there is little gain in the overall number of businesses and therefore limited sustainability and stability in the local business market. Lichfield has a high level of business start-ups when compared to the Staffordshire rate. In 2013 there were 64 business start-ups per 10,000 resident population in Lichfield, compared to 53 across Staffordshire. It is only slightly lower than the rate for Great Britain as a whole (67.5). The start-up rate in Lichfield since 2004 has fluctuated each year but overall has performed favourably when compared to Staffordshire and Great Britain (Figure 7). Figure 7 Business start-up rates in Lichfield, 2004-2013 Source: ONS Business Demography, 2014. Three year business survival rates are seen as a key success factor for a newly formed business and in Lichfield the three year survival rate has in the main exceeded both the Staffordshire rate and the rate for Great Britain as a whole. This suggests that businesses created in Lichfield are more likely to survive than the majority of other areas in the country. However, compared to 2012 the rate has seen a 6.7 point decrease so it is something to monitor (Figure 8). Retail vacancy levels are used as a measure of the vitality and viability and both Lichfield City (8.3%) and Burntwood (6.25%) are lower than the England average (12%) as at December 2014. Staffordshire Observatory Page 22
Figure 8 Three Year Business Survival Rates in Lichfield, 2008-2012

Source: ONS Business Demography, 2014.

5.3     Characteristics of the workforce in Lichfield
This section considers some of the key characteristics of Lichfield’s workforce; their employment,
income and commuting patterns comparing with the national picture where possible. Their skills and
qualifications will be discussed in Section 6.

5.3.1 Employment rates (including unemployment rates and benefits)
The economic activity of residents in Lichfield District is higher than the regional and national
averages, although it is not statistically significant. The employment rate for 2014/15 (77.2%) shows
that just over three quarters of the Lichfield District population are in employment. However,
unemployment levels may hide issues of underemployment where people are working part-time and
not able to work more hours. This has implications for the income levels in these households.

The claimant count is a key measure of unemployment and measures those people claiming
Jobseeker’s Allowance (JSA). In April 2015, the proportion of the working age population (16-64)
claiming JSA in Lichfield is 0.6% (approximately 360 people) and is significantly lower than the
England average (1.8%).

Levels in youth unemployment are now lower in Lichfield than those seen at the peak of the
recession. Between January 2015 and April 2015 it has fallen further from 1.7% to 1.3% (down from
approximately 130 to 100) and is significantly lower than the England average. Falling levels in youth
unemployment are clearly an encouraging sign within Lichfield. Feeling the Difference (FDS)11 survey
results demonstrated that nearly a fifth (16%) of respondents felt that employment opportunities make
somewhere a good place to live. However less than one in ten (7%) believe that it is something that
most needs improving in Lichfield.

11
   Feeling the Difference survey is a public confidence survey carried out in twice yearly ‘waves’ by Staffordshire Police which
explores local quality of life issues, perceptions on crime and safety and the effectiveness of the police and other services. The
findings within this report come from Waves 15-18 compiled.

Staffordshire Observatory                                                                                              Page 23
5.3.2 Earnings
Levels of earnings help to identify areas of relative affluence and deprivation, with low levels of
earnings indicating that individuals may struggle to attain a good quality of life. Lichfield’s median
gross annual and gross monthly salary in 2014 was £23,357 and £1,946 respectively; both were the
highest earning levels across Staffordshire and it’s reasonable to assume that this is partially a
reflection of the out-commuting to higher paid jobs.

5.3.3 Household income
Household income levels are important given the current economic climate and increasing costs of
living. As well as earnings, household income can also include money incurred from investments,
sales of property and social security benefits. It is recognised that the income of individuals is one of
the most important factors influencing an area’s overall prosperity.

The average household income for Lichfield was £45,900 which is slightly more than the Great Britain
average (£40,000) but varies at ward level from £28,000 in Summerfield to £73,000 in Little Aston.
The proportion of households in Lichfield with an income of under £20,000 is lower than England
(27% compared with 38%). Five wards are however worse than the national average (35%): Boney
Hay (43%), Chadsmead (46%), Chasetown (44%), Curborough (38%) and Summerfield (43%).

5.3.4 Worklessness
As well as understanding overall levels of worklessness it is also important to consider the reasons
why people are claiming out-of-work benefits. Figure 9 shows the breakdown of the benefit groups
that make up out-of-work benefits in Lichfield in February 2015.

Claimants of Incapacity Benefit and its successor Employment and Support Allowance (ESA)
represent the vast majority of the workless caseload. In Lichfield there were over 2,800 people
claiming ESA and Incapacity Benefits in February 2015, well over half of all out-of-work benefit
claimants.

Figure 9 Breakdown of out-of-work benefits in Lichfield, February 2015

  `
Source: Department of Work and Pensions.

Staffordshire Observatory                                                                        Page 24
5.3.5 Travel to work
Commuting patterns are important indicators of travel patterns as well as demonstrating the dynamics
and economic links within an area, showing where residents work and where workers live12. Over
time commuting patterns have become more of an important consideration as people are more willing
and able to travel further to work, and employment opportunities have become more dispersed13.

This analysis has examined the main commuting flows into, out of and within Lichfield, the Stoke-on-
Trent and Staffordshire Local Enterprise Partnership (LEP) and the surrounding areas. Using
workplace statistics from the 2011 census special interest will be placed on people who live and work
in Lichfield (self-containment) as well as flows into and out of Lichfield. For further detail around the
definitions used refer to Appendix 2.

There are 24,467 (49.8%) working age residents who live in Lichfield and work within Lichfield itself;
whilst the remaining 8,293 (16.9%) live in Lichfield but work in the wider areas of the Stoke-on-Trent
and Staffordshire Local Enterprise Partnership (LEP). Together there are 32,940 working age
residents in Lichfield who are self-contained. A further 16,399 (33.4%) working age residents
commute to areas outside of Lichfield and the wider LEP, the most popular being Birmingham (37.1%,
6,076); Walsall (19.5%, 3,197) and North Warwickshire (6.1%, 1,007) (Table 9).

Table 9 Top 10 outflows from Lichfield to areas outside the Stoke-on-Trent and Staffordshire
Local Enterprise Partnership, 2011
                                                                                            Percentage of all
         Workplace destination                          Number of outflows
                                                                                                outflows
         Birmingham                                              6,076                           37.1%
         Walsall                                                 3,197                             19.5%
         North Warwickshire                                      1,007                              6.1%
         Sandwell                                                 691                               4.2%
         Wolverhampton                                            632                               3.9%
         Solihull                                                 625                               3.8%
         Coventry                                                 311                               1.9%
         South Derbyshire                                         310                               1.9%
         Derby                                                    307                               1.9%
         North West Leicestershire                                209                               1.3%
         Other                                                   3,034                             18.5%
         Total                                                  16,399                            100.0%

Source: Census, 2011.

The main method of travelling to work for residents who work in Lichfield and the wider LEP is a car,
be it as a driver or passenger (66%, 21,694). A further 19% (6,262) mainly work at home whilst 10%
(3,133) commute to work on foot. Only 2% (548) use a bicycle. In terms of outflows around 87%
(14,132) commute using a car whilst 9% (1,486) use the train.

Overall, wholesale & retail trade; repair of motor vehicles and motorcycles account for the largest
employment industry in Lichfield and Lichfield and the Stoke-on-Trent and Staffordshire LEP (18.4%
and 18.5% respectively). Construction and human health and social work activities also employ
11.2% and 10.5% of residents in Lichfield; whilst human health and social work activities and

12
   Following the National Travel Survey in 2006, it was identified that one fifth of all distances travelled within the UK were
related to commuting (Department for Transport 2006). Travel to work flows are known to vary regionally and are due to a
number of factors such as mode of transport and industry as well as geographic, demographic and socio-economic factors.
13
   Travel flow information was an important consideration in the formation of Local Enterprise Partnerships, with Staffordshire
forming an “economic area” with Stoke-on-Trent although recognising the importance of all the areas that surround the County
and beyond.

Staffordshire Observatory                                                                                            Page 25
manufacturing accounted for 11.5% and 10.3% of employment in Lichfield and the wider LEP combined. A similar pattern is also observed for individuals who live in Lichfield but leave the district and the wider LEP for work; manufacturing accounts for 14.4%, wholesale & retail trade; repair of motor vehicles and motorcycles accounts for 14.2% and human health and social work activities accounts for 11.0% (Figure 10). Figure 10 Main industry type for Lichfield residents (working-age) by travel to work type, 2011 Source: Census, 2011. Some 9,490 working age residents commute into Lichfield from districts outside of Lichfield and the wider LEP, the most popular being Walsall (24.4%, 2,311); Birmingham (23.3%, 2,207) and North Warwickshire (7.0%, 666) (Table 10). Staffordshire Observatory Page 26
You can also read