CHINATOWN 2020 MASTER PLAN: A HEALTH LENS ANALYSIS - DECEMBER 2018
←
→
Page content transcription
If your browser does not render page correctly, please read the page content below
CHINATOWN 2020 MASTER PLAN:
A HEALTH LENS ANALYSIS

                         DECEMBER 2018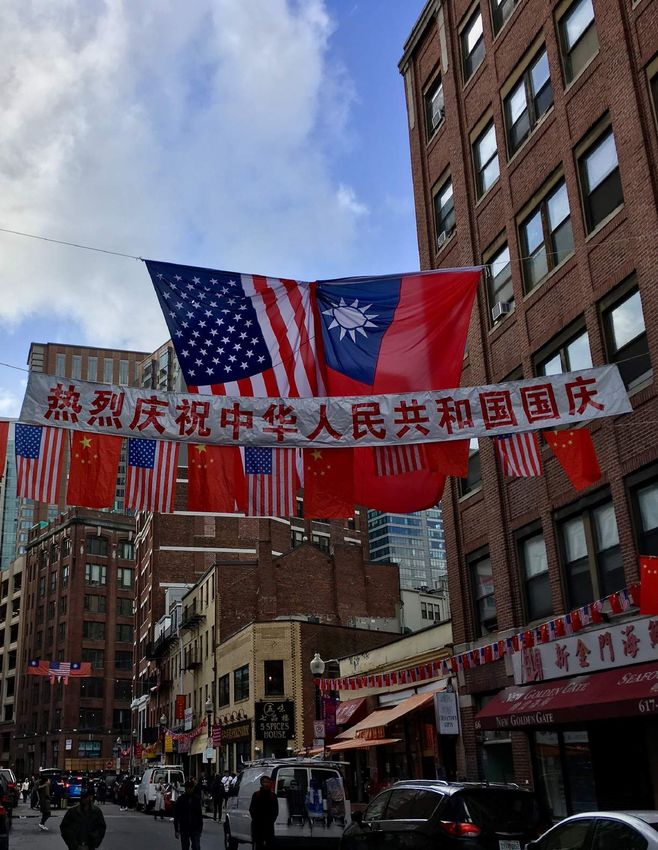
Acknowledgments

This report would not have been possible without all of the support and guidance we received
throughout the research process. We would like to specifically express our deepest gratitude to
the following individuals for their time, patience, and generosity: Lydia Lowe, Barry Keppard,
Sharon Ron, Leah Frankel-Bonacci, and Linda Tomasso. Moreover, we would like to thank all
of the Chinatown residents who provided input and their time to this research effort. We are
especially grateful to Ann Forsyth for her guidance in the design of this health lens analysis
and for continuously challenging us to reflect on the complexities of what makes a healthy
community.

This report is dedicated to all of the long-standing residents of Chinatown who make the
neighborhood the unique and vibrant community we know today.

___________________________________________________________________

Student Team
Syed Ali, Maura Barry-Garland, Emily Damon, Mariana Pereira Guimarães, Anna Miller,
Chris Nelson, Juan Reynoso, Yun Zhu

                                                                                              2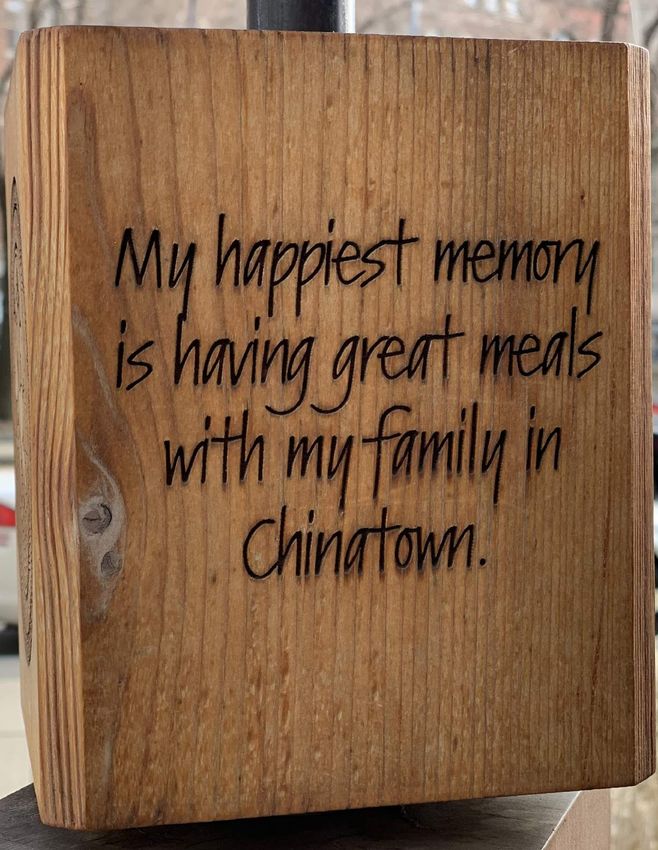
TABLE OF CONTENTS
EXECUTIVE SUMMARY                                 4

BACKGROUND DATA                                   6
  Neighborhood Context                            6
  Qualitative Data                               11
  Quantitative Data                              14
  Summary                                        35

OPEN SPACE                                       36
  The Importance of Open Space                   36
  The Reggie Wong Park Process                   42
  Open Space Possibilities for Chinatown         44
  Summary                                        51

PLANNING FOR HEALTH AND PLANNING FOR CHINATOWN   52
  Methods                                        52
  Healthy Master Plans in Other Cities           53
  Past Master Plans for Boston’s Chinatown       59
  Health in North American Chinatown Plans       62
  A Guide to North American Chinatown Plans      68

NEXT STEPS                                       70
  Recommendations                                70
  Areas for Further Research                     70

APPENDIX                                         71
  Community Stakeholder Interviews               71
  Sources                                        81

                                                  3
EXECUTIVE SUMMARY
Purpose
In conjunction with the Metropolitan Area Planning Council (MAPC) and the
Chinatown Community Land Trust, we sought to conduct a health lens analysis to highlight
how Chinatown’s built environment impacts the physical, mental, and social well-being of
Chinatown residents. The project’s ultimate goal is to have health considered and preserved as
a primary focus in the 2020 Chinatown Master Plan and to raise stakeholder awareness about
the importance of considering health in the development and planning process. Our research
consisted of literature reviews, secondary data analysis, site visits to the neighborhood, and key
informant interviews with neighborhood residents and stakeholders.
At the Boston Planning & Development Agency’s (BPDA) public launch of the PLAN:
Downtown initiative on December 3, 2018, we became aware that Chinatown was no longer
slated to receive their own neighborhood master plan. Rather, the neighborhood is scheduled to
be bundled into the larger Downtown planning effort. Given the histories of urban renewal and
exclusion in Chinatown, we fear that subsuming the neighborhood under a larger plan dilutes
the community's voice and is a step toward erasure of Chinatown from the map. As this report
describes in detail, Chinatown is a unique neighborhood and deserves its own neighborhood
master plan. The recent iterations of Chinatown’s neighborhood master plans have allowed
community stakeholders and residents, many of whom come from disenfranchised
backgrounds, to be empowered to be co-creators in the development of their community.
Research Findings
Overall, through this health lens analysis, we identified several key research findings:
➔ Chinatown’s boundaries and size vary among community residents and the City of
Boston.
➔ As of 2016, the majority of households in Chinatown were classified as extremely
low-income, yet there were also significant percentages of very high-income
households. This polarization is also present in the housing market as Chinatown has
higher percentages of both very low-rent and very high-rent units on the market, yet a
dearth of middle-income units, compared to the rest of the city. Therefore, Chinatown
is arguably the neighborhood with the greatest disparity in wealth in the City of Boston.
➔ Through interviews with residents and stakeholders, we identified six core public health
concerns: housing, public realm (noise, security, pest infestation, and trash), air quality,
climate change, walkability, and open space.
➔ Besides a few census tracts of mostly college students who do not own vehicles,
Chinatown has the highest pedestrian mode share among established Boston
neighborhoods with long-standing residents.
4
➔ Chinatown residents have significantly less access to green space than do residents of
    other Boston neighborhoods. This lack of green space poses a problem both because of
    how it affects the daily quality of life and because it could exacerbate extreme weather
    events like flooding and heat waves that negatively impact public health.
  ➔ Chinatown’s uniqueness as a cultural asset to Chinese American residents, coupled
    with development pressures the neighborhood is experiencing, highlight the importance
    of the neighborhood receiving its own Master Plan.
        ◆ Grouping Chinatown with other downtown neighborhoods dilutes the voices of
            Chinatown residents and produces barriers to residents self-determining the
            future of their neighborhood.

Next Steps
  ❏ Chinatown should receive its own neighborhood Master Plan for 2020.

  ❏ Healthcare organizations and planners should work together to gather disaggregated
    health data of Chinatown residents.

  ❏ In conjunction with the Public Works Department, conduct a parking and transportation
    demand management study to quantitatively assess ideal candidate streets for closure in
    order to improve local air quality, increase pedestrian safety, and expand open space.

                                                                                           5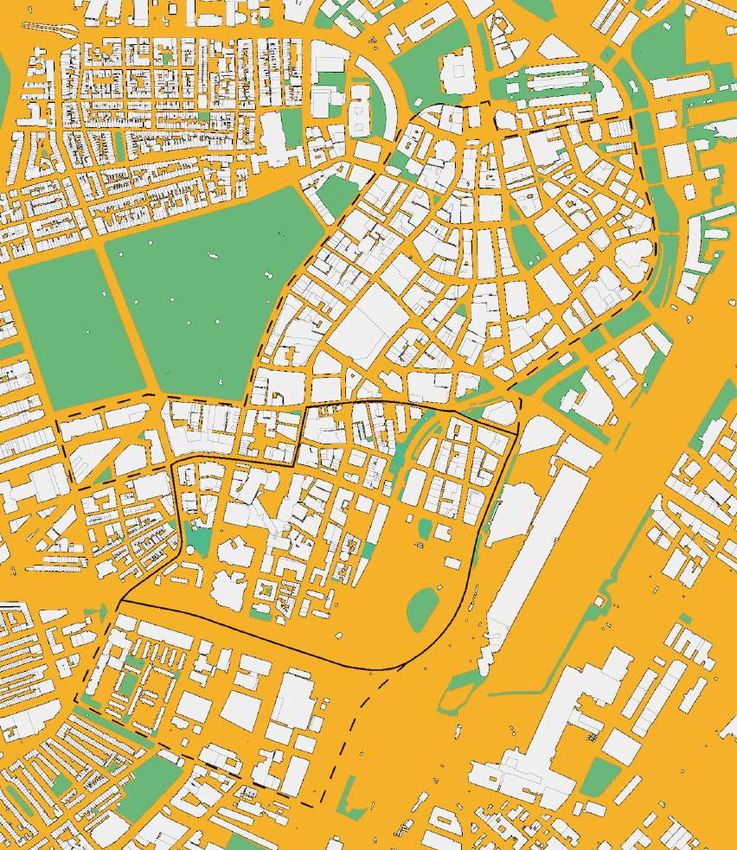
BACKGROUND DATA
Neighborhood Context
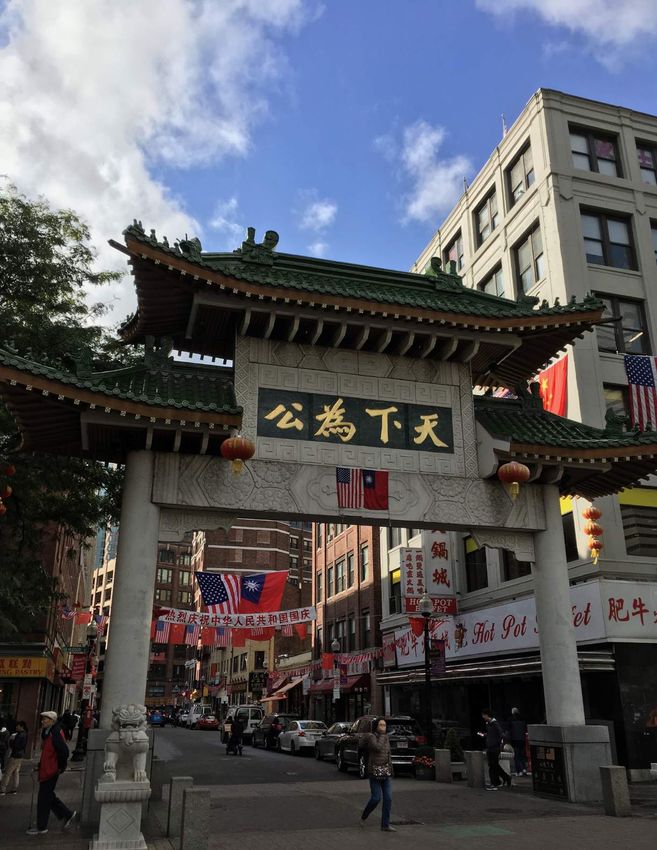
Boston’s Chinatown was founded in the late 1800s and is one of the last remaining
moderate-sized Chinatowns in the U.S. The South Cove Urban Renewal Plan of 1965 altered
the community landscape and redeveloped Chinatown and the South Cove area. Urban
renewal, institutional expansion, and the construction of two interstate highways disrupted the
community and has displaced over a thousand residents (Chinatown Master Plan, 2010).
Chinatown is located at the junction of the Massachusetts Turnpike and I-93
Expressway, an area with significant traffic congestion. Vision Zero Boston data illustrates
many of the streets and intersections within Chinatown are vulnerable to pedestrian, bicyclist,
and motor vehicle crashes. Kneeland Street and Washington Street have particularly high
concentrations of crashes involving pedestrians in the last two years. The John F. Fitzgerald
Expressway, constructed in the 1950s, was designed to slice through the center of Chinatown
and avoid the wealthier Leather District. Tufts Medical Center now comprises a large portion
of the land in Chinatown and the number of small businesses has declined (ESRI Business
Analyst, 2018).
Reggie Wong Park lies between the highway and off-ramps along Kneeland Street and
contains little greenery around or within it. The park contains two basketball and one volleyball
court, although they are poorly maintained and underutilized, and the park is vulnerable to
heavy air pollution from the I-93 South tunnel, the I-93 North off-ramp and the South Station
Connector.
A Note on Boundaries
In any urban environment, the scope of what is considered a neighborhood’s boundaries
is both individually defined and ever-changing. Boston’s Chinatown is no exception.
Throughout its history, Chinatown’s boundaries have expanded and contracted (see section on
Past Master Plans for Boston’s Chinatown).
For the current master plan renewal, BPDA has tentatively proposed the study area as
State Street and Government Center to the north, the JFK Surface Road and Rose Kennedy
Greenway to the east, Marginal Road to the south, and Charles, Boylston, and Tremont Streets
to the west (see Figure 1). The BPDA further plans to exclude institutional land, which is
mostly Tufts Medical Center, and the Chinatown Gateway Study Area, land owned by the
Massachusetts Department of Transportation, from this planning effort even though both of
these lands are located within Chinatown. Moreover, it is important to note that Chinatown is
not slated to receive their own neighborhood master plan, but rather will be packaged under the
larger Downtown plan.
6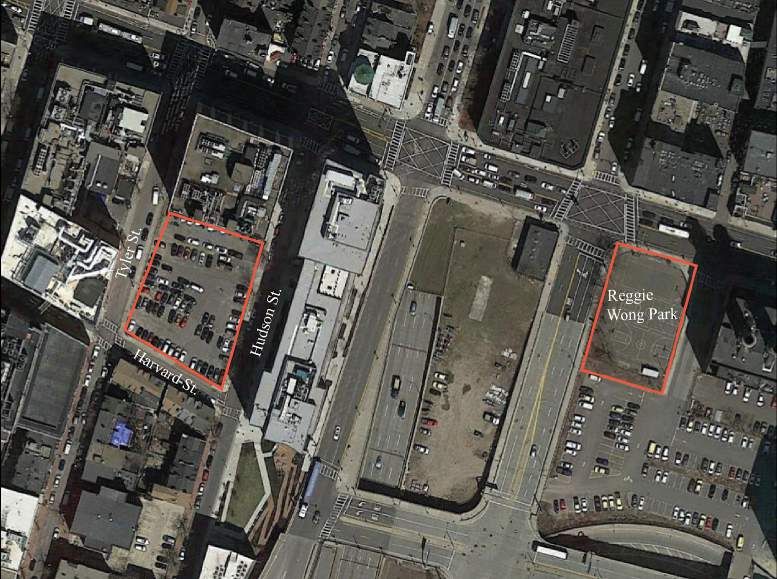
Figure 1: The BPDA proposed study area boundary (in yellow) and the Chinatown Neighborhood Council
proposed boundary (in red). Institutional parcels (in blue) will not be included as part of the BPDA plan.

                                                                                                             7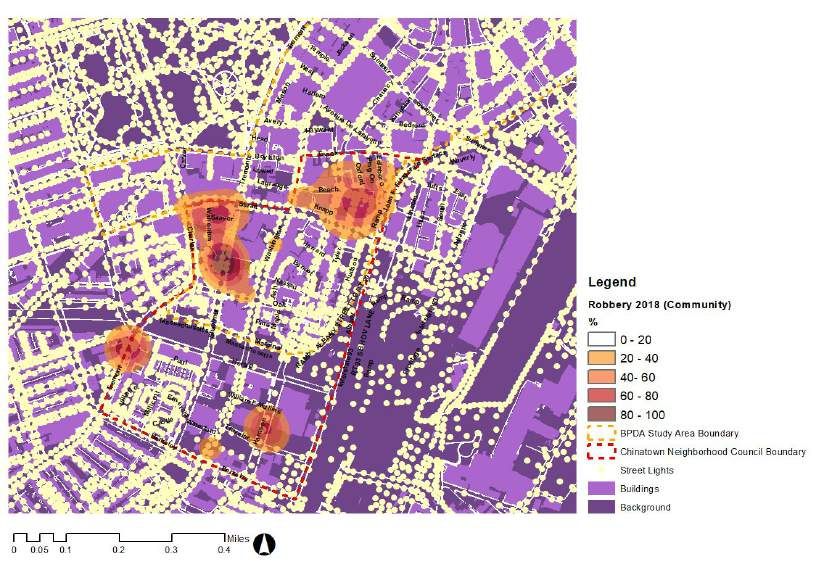
In contrast, the Chinatown Neighborhood Council has proposed the study area as Essex
Street to the north, the I-93/JFK Surface Road to the east, East Berkeley Street to the south,
and Washington Street to the west yet cutting over to Tremont Street. Unlike the BPDA plan,
the community defined boundary includes institutional land as well as key community assets
such as the Castle Square housing community and the Chinatown Gate.
        For the purposes of this health lens analysis, both the tentative BPDA and Chinatown
Neighborhood Council boundaries are presented. As part of the quantitative data collection,
however, only the Chinatown Neighborhood Council boundary is compared to current United
States Census Bureau census tract and block group boundaries. A census tract is a small,
relatively permanent statistical subdivision of a county that is updated by local officials every
ten years; they generally have a population size between 1,200 and 8,000 people (U.S. Census
Bureau, 2018). A block group is a statistical subdivision of a census tract and are generally
defined to contain between 600 and 3,000 people (U.S. Census Bureau, 2018).
        As shown by the maps below, Chinatown includes portions of three census tracts and
seven block groups. Because of their smaller size, the seven block groups provide a more
approximate estimate of Chinatown demographics; yet they typically have a larger margin of
error. Therefore, in the following sections, the census tract boundaries are used when
comparing Chinatown with the rest of the city in order to provide greater statistical accuracy;
the block group boundaries are used when assessing Chinatown on its own in order to provide
greater statistical precision. Overall, quantitative data was gathered from 5-Year combined
estimates for 2012-2016 from the United States Census Bureau’s American Community
Survey rather than from single-year estimates for 2017 (U.S. Census Bureau, 2018).

Figure 2: The BPDA and Chinatown Neighborhood Council boundaries overlayed with the U.S Census Bureau’s
census tract and block group boundaries.

                                                                                                      8
Current Demographics
Despite the ever-shifting boundaries
of Boston’s Chinatown, it is possible to
calculate an approximation of the
demographics of the neighborhood. As of
2016, Chinatown is home to an estimated
10,218 residents, of which 5,497 residents
identify as “Asian” or “Asian American”.
Thus, Asians and Asian Americans make
up approximately 53.8% of the
neighborhood's total population. In
comparison to the rest of the city,
Chinatown has by far the highest
percentage of Asian and Asian American
residents (see Figure 3). In fact, two of the
three Chinatown census tracts are the only
Figure 3: Chinatown has the highest percentage of
census tracts in all of Boston that are Asian and Asian American residents in Boston.
majority Asian American. (U.S. Census Bureau, 2018
As of August 2018, the City of Boston and the United States Department of Housing
and Urban Development define Boston’s area median income (AMI) for a household of four as
an annual median income of $107,800 and they define extremely low income (less than 30%
AMI) for a household of four as an annual median income below $32,350 (City of Boston,
2018). Adjusting for variation in household size, a family in Boston making less than $30,000
is generally classified as being extremely low income. As of 2016, about 51.8% of all
households in Chinatown fall below this threshold.
In comparison to the rest of the city, Chinatown has a higher prevalence of extremely
low-income households. As shown by Figure 4, two of the three census tracts in Chinatown
have over 50% of their households living below the threshold of $30,000/year. It is important
to note that while poverty itself is incredibly stressful on a household and associated with
worse health outcomes, the spatial proximity of poverty with extreme wealth within the same
neighborhood can be an added source of psychological stress (Patel et al., 2018). The census
tracts highlighted in Figure 4 on the right are those where at least 50% of households make less
than $30,000/year and at least 5% of households make more than $200,000/year. The two
census tracts in Chinatown with high levels of extremely low-income households are also two
of only four census tracts in Boston where there is a large contrast between the rich and the
poor. Although Chinatown is one of many neighborhoods in Boston with deep levels of
poverty, it is arguably the neighborhood with the greatest disparity in wealth because it is the
only one with multiple census tracts that have extreme income inequality.
9Figure 4: Chinatown has one of the highest percentages of households who are extremely low income and also is
home to two of only four census tracts in the entire city with high-income inequality. (U.S. Census Bureau, 2018)
Moreover, in terms of resident origin, Chinatown is home to one of the highest
percentages of foreign-born Bostonians. In fact, the southernmost census tract in Chinatown
(Census Tract 704.02) has the fifth highest percentage in the city of foreign-born residents and
the fifth highest percentage in the city of residents who do not speak English as their primary
language; the top four census tracts are all in East Boston.
Figure 5: Chinatown is home to a high concentration of residents who are foreign-born and who do not speak
English as their primary language. (U.S. Census Bureau, 2018)
10Qualitative Data
During the early phases of the health lens analysis for the Chinatown neighborhood
master plan update, we attended community meetings and met with stakeholders and leaders
who provided their perspective on important public health and urban planning issues facing the
community. The below table provides a summary of those data gathering sessions with
community stakeholders. Moreover, we conducted key informant interviews with community
residents to gather information on the health challenges more salient for them (see Appendix
for full transcripts from interviews).
Date Location Organization Major Themes
October 23, 2018 28 Ash Street, Resident Association Air pollution
Boston Steering Committee Noise
Trash
Hypodermic needles
Rodents
Evictions
Public urination
Greenery
October 28, 2018 28 Ash Street, Chinatown Land Trust Air quality
Boston Board Climate change
Public smoking
Asthma
Pedestrian fatalities
Diabetes
High stress
Affordable housing
Overcrowding
Job/housing quality
Public space
Greenery
Rodents
Based off of this qualitative data, key themes were generated for the focus of the
analysis. The top public health concerns raised can be grouped into six categories: housing,
public realm, air quality, climate change, pedestrian fatalities, and open space. The below table
outlines specific issues raised within each of these six categories. The ensuing Quantitative
Data section of the Background Data chapter (page 14) provides a short analysis for each of the
first five categories. Given MAPC’s interest in Chinatown’s Reggie Wong Park, the Open
Space chapter (page 36) provides a long-form analysis of the open space category.
11Public Health Concern Specific Issues
Housing Lack of affordable housing, overcrowding, housing quality,
eviction, and displacement
Public Realm Excessive crime, noise, garbage, rodents, and a general lack of
cleanliness and safety in the public space
Air Quality Excessive air pollution from traffic, high smoking rates,
asthma, and lung cancer
Climate Change Sea level rise and flooding from storms
Walkability Pedestrian fatalities and pedestrian safety
Open Space Lack of tree coverage and greenery, lack of open space
These various public health issues in Chinatown are also often present in the public
consciousness as a media scan of multiple local Asian news sites demonstrates that they
regularly cover issues of cigarette smoking, lung cancer, air quality, rising housing costs, and
the inability to find affordable homes (Chinanews, 2018; Sampan, 2018).
According to our media scan, stagnant wages in the
face of increasing housing prices make Chinatown
one of the most inequitable neighborhoods in Boston.
Moreover, the commercialization of Chinatown has
been the most rapid in Boston. Over the past decade,
increasing numbers of low-income families have
been forced to leave Chinatown because of
skyrocketing housing prices as residential units have
been transformed into commercial buildings. As a
result, affordable housing and public facilities are
priorities for many organizations in Chinatown like
the Chinese Progressive Association.
Figure 6: News from China Concern Group, 2015
12One example is successfully negotiating with the government to ensure the preservation
of Building Caisi. In 2015, concerns emerged that the impending expiration of the Section 236
Preservation Program would lead to the loss of 87 units of affordable housing. Sustained
advocacy by local residents and organizations led to Building Caisi transitioning from the
Section 236 Preservation Program to the Section 8 Housing Choice Voucher Program. The
transition successfully preserved the affordability of the Building Caisi for another 15-30 years.
Though the preservation of the Building Caisi was a success, the rapid
commercialization of Chinatown has been more serious and striving for the right of affordable
housing has been a huge challenge for the community. The residents and organizations hoped
to promote some policy changes like “Right to Remain Boston Assembly” and “housing
justice.” They hope to go through the legislation and prevent the expulsion of vulnerable
populations like the elderly, disabled, and families with children.
Figure 7: News from China Concern Group, 2015
The newspaper scan on the right “The Return of Chinatown Boston Public Library”
illustrates how with community efforts, Chinatown finally built their own Boston Public
Library and explains the process of this build-up including organizing meetings around
different targeted groups in the community, conducting focus group interviews and designing
social space for the community. This initiative was mostly promoted by the Youth Dynamics
Organization and the Chinese Progressive Association. The groups invested a lot of effort to
talk with different stakeholders around this issue and finally made the petition for the
establishment of the public library.
13The newspaper on the left talks about the suffering of the hostile living environment for
many Chinatown residents. It pointed out some problems around housing and one of them was
the safety issue. It took an example of The First Suffolk LLC, a real estate company: they did
not follow the safety and sanity instructions set by the government and many residents
originally lived there had to leave their apartment and lived in a small hotel without a kitchen
for half of a year. Overall, the demand for affordable housing is huge. For many low-income
residents and residents who have limited English, they could only rely on services provided by
Chinatown for a living. In 2015, for an area that had 95 units of affordable housing, there were
more than 5000 applications.
Quantitative Data
Below, in the following sections, is an analysis of five of the six top public health
concerns in Chinatown through a quantitative review of existing public data.
Housing
Many of the top health concerns raised repeatedly during our data gathering process
were issues related to housing, especially housing affordability.
Housing ownership is an indicator
of wealth accumulation and provides a
stabilizing buffer against spikes in housing
costs. However, 87.2% of households in
Chinatown are renters, which is a much
higher percentage than the 63.3% renter
average for the entire City of Boston. When
comparing the three Chinatown census
tracts to each other and the rest of the city
though, a different picture emerges (see
Figure 8). The housing tenure breakdown
in Chinatown’s southernmost census tract
(Census Tract 704.02) skews far toward
renters and, in fact, an estimated 99% of all
households are renters. This high renter rate
is a concern for households who live in
private rental housing (as opposed to public Figure 8: Chinatown, especially its southernmost
census tract, has a greater percentage of
or non-profit) since they have less of an
renter-occupied households than the rest of Boston.
ability to resist displacement with the (U.S. Census Bureau, 2018)
current rise in housing costs.
14Specifically, among renter-occupied housing units, 32.5% of rental units in Chinatown
went for a rent below $500 in comparison to 19.3% of rental units across Boston. However,
given its proximity to Downtown, Chinatown also had a greater percentage of higher rent units
($2,500 or more) than the rest of the city (see Figure 9). This polarization of both very low-rent
units and very high-rent units on the market matches the earlier demographic analysis that
Chinatown is a neighborhood with extreme income inequality.
Figure 9: Chinatown has rental units at both economic extremes of the market. (U.S. Census Bureau, 2018)
Overcrowding was a significant
concern among community leaders,
residents, and stakeholders. The U.S.
Department of Housing and Urban
Development defines “overcrowding” as
more than one person per room and
“severely overcrowded” as more than 1.5
persons per room (HUD, 2018). As of
2016, 5.8% of Chinatown renter
households are overcrowded or severely
overcrowded, which is nearly double the
percentage of 3.2% for the entire City of
Boston. However, in comparison to specific
other neighborhoods in the city, such as
East Boston, Chinatown has a relatively
Figure 10: Chinatown has a relatively average
low overcrowding rate among renter
overcrowding rate among renter households in
households. Thus, at an overall level, it comparison to the rest of Boston. (U.S. Census
appears that overcrowding is not as great of Bureau, 2018)
an issue for the neighborhood to address in
comparison to other housing concerns.
15Finally, in terms of housing, a major concern in the community is housing stability for
existing residents. Although eviction data is hard to collect, the American Community Survey
does collect information on which year a household moved into their unit. As shown by Figure
11, Chinatown renter households have generally been residents of their units for a longer
period of time than Boston renter households. By extension, Chinatown households have
deeper roots in their neighborhood than do average renter households in Boston as a whole. It
is important to note however that since Boston has a high percentage of university students
who are highly transient, the city’s overall proportion of recently moved renter households
(2015 or later) is skewed compared to a non-university neighborhood such as Chinatown.
Figure 11: Chinatown renter households have lived for a longer period of time in their units than the average
Boston renter household. (U.S. Census Bureau, 2018)
Furthermore, neighborhood residents cited concerns about displacement connected to
the growing popularity of vacation rental companies, especially Airbnb. A sample search for a
home to rent for the night through the platform’s website provided 187 homes in Chinatown,
although many described their location as “Downtown”, “South End”, “Boston Commons”,
“Convention Center”, “Tufts Medical”, and “Downtown Crossing”. Certifying specific
addresses of the homes is not possible without booking a property, but the website allows a
user to outline an area within a map of the city. The average nightly price for one guest to stay
in a home is $216. Prices for a one night stay ranged from $65 to $1,000/night for a newly
renovated 3 bedroom townhouse. Amenities included in some of the properties include gyms,
pools, indoor fireplaces, and doormen.
Airbnb’s website allows users to select for a host’s language. When selecting for a
Chinese-speaking host, the number of available listings drops from 187 to 15 (the site only
offers the option of “Simplified Chinese” and does not provide Cantonese or Traditional
Chinese as additional host language options).
16Public Realm
Below are a series of maps that provide an understanding on the status of crime and
sanitation in the public realm in Chinatown through the spatial use of data from the City of
Boston’s 311 Line Constituent Service Center and the Crime incident reports data provided by
the Boston Police Department (BPD). The crime incident report dataset contains records from
the new crime incident report system, that focus on capturing the type of incident as well as
when and where it occurred. The 311 Line Constituent Service provides a record of service
requests made by residents and report “non-emergency” issues. Both datasets are tabular data
that was transformed into geolocated points using the coordinates provided in the tables. The
points were then used to generate heat maps through the kernel density tool from ESRI ArcGIS
Desktop 10.6.1. These maps were produced to triangulate qualitative data gathered during the
community meetings and interviews. They confirm the residents' concerns and give them a
more accurate location, that can serve as a starting point for a detailed field survey.
Sanitation - Boston’s 311 Line Service
Sanitation and health-related complaints reported in the Boston’s 311 Line Constituent Service
from 2011 until December 2018:
Figure 12: Sanitation complaints related to garbage and trash in the streets, reported in the Boston 311 Line
Constituent Service Center (2011-2018). It coincides with the concentration of restaurants and bars located along
Beach St.
17Figure 13: Rodent infestation complaints reported in the Boston 311 Line Constituent Service Center
(2011-2018). It coincides with affordable housing locations and restaurants located in Beach St.
Figure 14: Street cleanliness complaints reported in the Boston 311 Line Constituent Service Center (2011-2018).
Street cleanliness refers to both trash dumping and urination also coinciding with restaurants hotspots and clubs.
18Figure 15: Unsanitary living conditions complaints regarding mold growth, pest infestation and cleanliness
reported in the Boston 311 Line Constituent Service Center (2011-2018).
Figure 16: Unsanitary working conditions complaints regarding mold growth, pest infestation and cleanliness
reported in the Boston 311 Line Constituent Service Center (2011-2018).
19Figure 17: Noise complaints reported in the Boston 311 Line Constituent Service Center (2011-2018). It strongly
correlates with the nightclubs hotspot locations located in Stuart St and Tremont St.
Figure 18: Used needles pickup requests reported in the Boston 311 Line Constituent Service Center (2011-2018).
These requests seem to come mostly from the Leather District, in areas that are close to the South Station.
20Figure 19: Air pollution complaints reported in the Boston 311 Line Constituent Service Center ( 2011-2018).
Figure 20: Streetlights outage complaints reported in the Boston 311 Line Constituent Service Center
(2011-2018).
21The maps below were produced with data from BPDA Land Use (2016), HUD (2016)
and the business location database from the Simply Analytics platform (2018). These maps
were included after the Boston’s 311 Line Constituent Service maps to verify possible causes
of the residents voiced concerns. The hot spots for complaints about street cleanliness, rodent
infestation, and noise correlated with the existing hot spots of restaurants and nightclubs in the
neighborhood. Rodent infestation and unsanitary living conditions also correlated with existing
affordable housing. Air pollution complaints appeared scattered along the area, but
concentrated in affordable housing that is located close to the highway and the Tufts Medical
Center. One of the reasons for that is the high volume of traffic along the highway but also the
traffic of ambulances in the medical complex. Ambulances also contribute to the “noise
pollution” in the neighborhood. Further noise pollution studies need to be performed to gather
data to confirm information gathered qualitative and to verify the correlation with ambulance
traffic volumes in the area.
Figure 21: Affordable housing locations from the HUD (2016) database. Source: BPDA and Public Housing
Developments and Low Income Housing Tax-Credit point locations from HUD, 2016.
22Figure 22: Restaurants kernel density map created with point location data in ArcMap 10.6.1 using the businesses
location dataset collected in the Simply Analytics tool. Source: Simply Analytics business database (2018).
Figure 23: Nightclubs, bars and Pubs kernel density map created with point location data for businesses in
Simply Analytics. Source: Simply Analytics business database (2018).
23Crime - Crime incident reports provided by the Boston Police Department (BPD)
Crime heat maps were generated in ESRI ArcGIS 10.6.1 using the kernel density tool.
The database of crime incident reports was provided by the BPD (from August 2015 to date),
downloaded from the Analyse Boston website. The streetlight locations were also downloaded
from the Analyse Boston website and were provided by the City of Boston’s Street Lighting
Division of Public Works.
Crime data analysis is relevant to the public realm and can provide valuable insights
into urban patterns such as street cleanliness, vacancy and neighborhood change. Nevertheless,
criminology is a discipline characterized by deep disagreements what makes crime data
analysis a difficult task. In the interviews help with elderly residents of Chinatown, security
was appointed as an issue for this particular group. One interviewer also mentioned crime such
as robbery happening in darker corners or places where people don’t usually walk during the
night. Maps showing aggravated assault, robbery, disorderly conduct, and drug violation were
overlaid with streetlight maps to triangulate the information given by residents with data
provided by the city of Boston on crime incident reports and streetlights. The graph below
shows the number of offense types in 2018 divided in the days of the week for the A1 Police
District that comprises downtown Boston. Larceny is listed as the majority of the incidents,
accounting for 40% of the total incidents in 2018.
Figure 24: Larceny is the most common type of crime, followed by simple assault and drug violation. The count of
incident types according to BPD offense code was divided into the days of the week. (Boston Police Department,
2018).
24Figure 25: Boston Police Department Districts. Source: Analyse Boston and Boston Police Department (2018).
Figure 26: Streetlight were mapped using the locations provided in the dataset. A buffer diameter of 3m was used
to show the provided lighting range on the ground. Source: City of Boston’s Street Lighting Division of Public
Works (2018).
25Street lighting is integral to the health of a community. While research on the effects of
improved street lighting on crime rates is not entirely definitive, an analysis of eight different
studies found that improved street lighting—either through more lights or brighter lights—
reduced crime by an average of 7% (Triplett & Gainey, 2007). With improved visibility,
potential offenders are more exposed and less likely to commit crimes. Enhanced lighting can
signal more community investment, pride, and cohesiveness, which also can discourage crime.
Streetlights do more than prevent crime. Improved street lighting can make a community feel
safer. They allow safer operation of vehicles at night, reduce accidents, and assist traffic flow.
Better light can also promote the nighttime operation of businesses and increase pedestrian
street use after dark, all of which leads to a more active, enhanced neighborhood.
Through a simple observation of the Chinatown street lights data, it appears that
lighting is extensively covered in the community as we don’t see clear “dark spots”. However,
through our interviews with residents, elderly members expressed being worried about robbery
and crimes happening after dark, especially in so called “quiet areas”. Through a deeper
analysis, we can infer a clear relationship between street light outage and crime (using data
from 2017 and 2018). The corner between Charles St. and Stuart St. is a spot for more close
investigation. According to Figure 20 (on page 21), community members frequently complain
about outage. A comprehensive historical analysis of different types of crime was not
performed in this study, but could be used to assess a relationship between recent changes to
the surrounding built environment, street lighting, and crime.
Over the next few pages, there is a series of kernel density maps for various types of
crime that were of interest: aggravated assault and homicides incidents, robbery incidents,
arrests for disorderly conduct, and drug violation incidents. The kernel density data is shown
within community boundaries, first, and then overlaid over street lights data in an attempt to
verify a visual correlation between dark spots and crime.
26Figure 27: Kernel density map for aggravated assault and homicides incidents within the community boundaries.
Source: Boston Police Department (BPD), January to December 2018.
Figure 28: Aggravated assault kernel density maps overlaying the streetlight location map. Source: Boston Police
Department (BPD) and City of Boston’s Street Lighting Division of Public Works (2018).
27Figure 29: Kernel density map for robbery incidents within the community boundaries (robbery, commercial
burglary, and larceny). Source: Boston Police Department (BPD), January to December 2018.
Figure 30: Robbery kernel density map overlaying the streetlight location map. Source: Boston Police
Department (BPD) and City of Boston’s Street Lighting Division of Public Works (2018).
28Figure 31: Kernel density map of arrests for disorderly conduct within the community boundaries. Source: Boston
Police Department (BPD), January to December 2018.
Figure 32: Disorderly conduct kernel density maps overlaying the streetlight location map. Source: Boston
Police Department (BPD) and City of Boston’s Street Lighting Division of Public Works (2018).
29Figure 33: Kernel density map of drug violation incidents within the community boundaries. Source: Boston
Police Department (BPD), January to December 2018.
Figure 34: Drug violation kernel density maps overlaying the streetlight location map. Source: Boston Police
Department (BPD) and City of Boston’s Street Lighting Division of Public Works (2018).
30Air Quality
With its close proximity to multiple busy interstate highways and the high prevalence
of smoking among neighborhood residents, Chinatown faces significant concerns with
excessive asthma and lung cancer.
Unfortunately, since 1994, the Boston Public Health Commission (BPHA) has
embedded Chinatown health data within its larger reports of the South End. Disaggregating
health data for Chinatown from the neighborhood-specific reports has been beyond the
capacity of community organizations, data users, and even for the Tufts Medical Center (Tufts,
2016). Thus, similar to prior stakeholders, we relied on information from BPHC’s periodic
reports on the health of Asians across the city.
Moreover, the team’s qualitative identification of lung diseases as a top health concern
from attended community meetings matches the results from other prior health studies of
Chinatown. For example, as part of its recent 2016 Community Health Needs Assessment,
Tufts Medical Center identified cigarette smoking, lung cancer and associated health risks as
the top health concerns for Chinatown (Tufts, 2016). In fact, the Boston Public Health
Commission has regularly identified lung cancer as the leading cause of death among Asian
Americans in Boston (BPHA, 2017). Therefore, preventing lung cancer is a major priority
toward improving overall health outcomes in Chinatown. Community leaders and stakeholders
can address this critical health concern by launching health education campaigns on smoking,
promoting smoking cessation programs, disincentivizing smoking in the public realm, and
adopting other public health strategies.
In terms of asthma, there is unfortunately also a dearth of disaggregated data at the
neighborhood level. However, it is important to note that asthma rates for Asian American
youth who attend Boston’s public schools are about 1.3 times higher than for White youth who
attend Boston’s public schools (27% vs 21%) (BPHA, 2017). Although asthma cannot be
cured, it can be controlled by avoiding asthma triggers, seeking proper medical care, and
creating healthy environments that reduce exposure to poor air quality.
From the China Concern Group, a local newspaper in Chinatown, in 2015, the minority
and low-income population are more likely to live near major roadways and heavy noxious
industries. Therefore, they are more vulnerable to be exposed to high levels of car and truck
exhaust, like smaller particulate pollutants or ultra-fine particles. This type of pollution poses a
health threat to low-income and minority populations and contains invisible, odorless particles
and gases such as carbon monoxide. Research shows that people near highways tend to have
higher rates of heart disease, asthma, and lung cancer.
Given this situation, residents in Chinatown felt the urgent need to seek environmental
justice and air-quality protection. In order to tackle this challenge, the Community Assessment
of Freeway Exposure and Health Study (CAFEH) hopes to collaborate with local governments
and organizations to develop several realistic strategies with the hope to propose culturally
appropriate solutions.
31Climate Change
Although climate change has numerous potential public health impacts (APHA, 2018),
the main concern among community stakeholders is the potential impacts of sea level rise and
flooding from storms. The series of maps on the next page displays the potential hazard
associated with various amounts of sea level rise in Chinatown and neighboring communities.
Overall, Chinatown is at risk of flooding if there is a sea level rise or a storm surge, in
combination with sea level rise, that is equal to or greater than 7.5 feet. After zooming into
potential flooding just in Chinatown (see Figure 35), it is interesting to note that the eastern and
southern parts of the neighborhood, which are home to higher densities of small businesses and
housing, are more likely to get flooded than the western part of the neighborhood, which is
home to mostly institutional land uses.
Current Sea Level 21 inch sea level rise 36 inch sea level rise
5 ft sea level rise 7.5 ft sea level rise 7.5 ft neighborhood zoom in
Figure 35: Eastern and southern Chinatown are most at-risk of flooding and sea level rise.
32Walkability
A final concern among community stakeholders was the status of street infrastructure
for pedestrians and the associated risk of pedestrian fatalities and injuries. According to the
City of Boston’s Vision Zero database, there were 18 reported motor vehicle crashes with
pedestrians in 2017 (see Figure 36).
This high number of pedestrian injuries, especially in the northern part of the
neighborhood, mirrors and can be partly explained by the high density of interactions at street
intersections between pedestrians and vehicles in Chinatown. In fact, based off of traffic data
from the City of Boston, thousands of vehicles travel through Chinatown every day and,
particularly, thousands of pedestrians and vehicles travel across certain intersections in the
northern part of Chinatown; most of which are along Kneeland Street (see Figure 36). It is
important to note though that Beach Street has a low prevalence of use by vehicles yet a high
prevalence of use by pedestrians (see Open Space chapter for further analysis).
Figure 36: (Left) In 2017, there were 18 pedestrian crashes (red dots) in Chinatown. (Right) Vehicle and
pedestrian counts at certain intersections in Chinatown between 7 am and 7 pm; based off of publicly available
data. (City of Boston, 2018).
33Despite the high vehicular traffic on Chinatown’s streets, an analysis of commute mode
share among Chinatown residents suggests they use alternative forms of transportation. As can
be seen in Figure 37, over half of all workers (51.4%) in Chinatown walk to work as their
primary mode of transportation. This rate is over three times higher than the 14.8% walking
rate to work for the rest of the city.
Figure 37: Transportation mode share for all workers 16 years old and older. The majority of all working
Chinatown residents walk to work. (U.S. Census Bureau, 2018).
Moreover, in Chinatown’s central census tract (Census Tract 702), 55.7% of all
residents who are workers walk as their primary mode of transportation. This 55.7% rate is the
fourth highest walking rate in the entire city and only trails the three census tracts in and
around Boston University and Northeastern University (see Figure 38). Not accounting for
these census tracts that are mostly college students who do not own vehicles, one can therefore
argue that Chinatown has the highest pedestrian mode share among established Boston
neighborhoods with long-standing residents.
Beyond simply not driving to work and instead opting for more sustainable modes of
transportation, Chinatown residents also have high rates of non-car ownership. In fact, 61.6%
of all Chinatown households do not own a vehicle. In comparison to the rest of the city, two of
the three Chinatown census tracts have especially high rates of non-vehicle ownership (see
Figure 38).
Therefore, all of this data suggests that the high volume of vehicles on Chinatown’s
streets are not actually Chinatown residents, but rather people from outside the neighborhood
who are visiting Chinatown or who are using Chinatown’s streets as a bypass on their way to
other parts of the city. If the master plan renewal is to truly value the commuting needs of
Chinatown residents and address their concerns, it is necessary to prioritize pedestrian
34infrastructure over vehicle infrastructure. Unlike other neighborhoods in the city that are
majority vehicle users and where reducing vehicle space is politically controversial, Chinatown
is majority pedestrians and thus reducing public space for vehicles in order to expand space for
pedestrians is more politically feasible.
Figure 38: Chinatown has a far greater walking commute rate than the rest of Boston (Left) and is home to a high
percentage of non-vehicle owner households (Right). (U.S. Census Bureau, 2018)
Summary
The quantitative data we collected to assess the current socioeconomic health of
Chinatown mirrored concerns brought to our attention by community members themselves.
Affordable housing, poor air quality, and noise, safety, and trash in private and public spaces
weigh heavily on the health and happiness of the neighborhood and residents themselves.
Other concerns also include climate change, pedestrian fatalities, and a lack of green and open
space. The next sections of this report will further address the state of open space in Chinatown
and offer suggestions to improve resident access to green spaces. We also offer
recommendations for the development of the Master Plan to ensure a health lens is included.
35OPEN SPACE
After hearing concerns about a lack of tree coverage and open space in Chinatown at
the community meetings we attended and in our interviews with residents, and being asked to
evaluate the Reggie Wong Park redesign process by the MAPC, we decided to investigate the
state of open space in Chinatown. We researched the importance of open space and vegetation
to public health, conducted an audit of all current open space in Chinatown, and investigated
potential avenues for the city to increase Chinatown’s share of open space and vegetation. We
concluded that six avenues for open space expansion and improvement in Chinatown are
relocating Reggie Wong Park to a parcel with better air quality, adding green space and open
space to odd-shaped and leftover parcels, adding green space and open space to city-owned
parcels, improving sidewalk conditions en route to existing parks, purchasing houseplants for
neighborhood residents, and closing down a road to motorized vehicle traffic.
The Importance of Open Space
“Open space” is a broad category, encompassing everything from a grassy pocket park
to a paved basketball court. These spaces, though quite different, enhance the health of
neighborhoods by providing residents with places where they can socialize, participate in
active recreation, or enjoy nature.
Open space that contains vegetation is of particular importance to public health, as
exposure to nature has been linked to many positive health outcomes, and trees and other
plants mitigate flooding and the urban heat island effect.
Exposure to vegetation leads to improved health outcomes like lower mortality rates,
more physical activity, healthier birth weights, and decreased symptoms of depression (Fong,
2018).
Figure 1: Benefits of exposure to vegetation
36Trees counteract the urban heat island effect, a phenomenon in which dense urban
neighborhoods experience temperatures higher than suburban and rural areas in the same
region. The urban heat island effect is due in part to the number of dark surfaces in urban
centers, which absorb heat (Mohajerani 2017). Vegetation mitigates this effect because trees
provide shade, and grassy surfaces do not absorb heat to the extent that asphalt does. This
mitigation of the urban heat island effect is important because extreme heat can lead to heat
stroke or exacerbate existing medical conditions. The threat is elevated for older adults, who
make up over 13% of Chinatown’s population (ACS).
Figure 2: Tree canopy coverage and the urban heat island effect (see Mohajerani 2017)
Planted areas also mitigate flooding, which can lead to both direct adverse health
impacts like drowning and electrocution as well as indirect ones like illness suffered because of
exposure to mold or contamination in the water supply.
Figure 3: Permeable surfaces and health outcomes from flooding
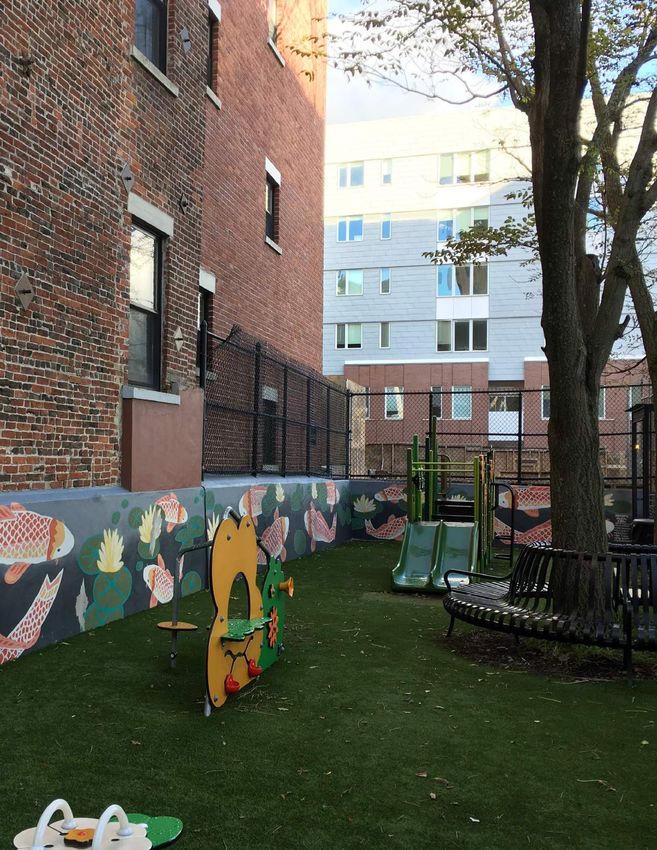
37While green spaces have an important impact on public health, other types of open
spaces are also important to health and to community-building. Places where children can play
and community members of all ages can socialize or participate in active recreation enhance a
neighborhood even if they do not contain vegetation, so it is important to avoid focusing solely
on spaces that contain plants when analyzing a neighborhood’s access to open space.
In our open space audit of Chinatown, we looked at open spaces both paved and
planted and found little public open space and fewer trees than other Boston neighborhoods. As
a result of the audit as well as feedback we received in our interviews, we developed proposals
that would increase access to open space and vegetation in Chinatown.
One concern when producing our proposals was eco-gentrification. Open space
increases property values, and this effect is most pronounced in areas near a central business
district and in densely populated areas (Anderson 2006). One of the residents we interviewed
noted that rents in Chinatown had increased dramatically since he was a child in the
neighborhood thirty years ago and that the neighborhood had gone from one of the cheapest
places to live in Boston to one of the most expensive. This increase in rents had, in his opinion,
led to families doubling up in overcrowded conditions. Another resident we interviewed said
that her son would like to live closer to her, but cannot afford to and lives in Quincy instead.
Since high rent prices affect health through overcrowding and the dispersion of social
networks, measures that would increase rents even more could hurt the very residents they aim
to help.
Figure 4: Eco-gentrification diagram
People of all income levels deserve access to high-quality open space. Planners and
public health officials must advocate for underserved neighborhoods to receive their fair share
of green space; however, they must also incorporate mechanisms to preserve affordability so
that low-income residents are not displaced in the wake of those improvements. We prioritized
strategies in our recommendations that would maximize the public health benefits of open
space while minimizing its displacement effects.
38Tree Coverage and Open Space Audit in Chinatown
Residents at the community meeting we attended brought up the lack of trees in
Chinatown as an issue detrimental to the walkability of the area. Their perception that
Chinatown has less tree cover than other Boston neighborhoods is born out in the data, which
shows Chinatown has just 6.2 trees per acre within the current Chinatown Neighborhood
Council-defined borders, while Bay Village has 10.2, the South End has 11.1, and Back Bay
has 10.6.
Figure 5: Tree counts in Back Bay, Bay Village, Chinatown, and the South End (Boston Open Data)
As for open space, Chinatown has few parks. Some parcels that appear as open space in
Boston GIS files are actually inaccessible by the public, either because they are private
courtyards or isolated by the highway like the I-93 interchange. The other two “open spaces”
that appear in the GIS shapefile are both private courtyards and are not included in the
following table of parks in Chinatown. The area of focus from here on out with regards to open
space is of the intersecting area between the BPDA defined boundaries and the Community
defined boundaries of Chinatown.
39Park Acreage Use Active/Passive Public/private Green
space?
Chinatown .75 Plaza and garden Passive Public Yes
Park
Mary Soo .082 Play equipment Active Public Mostly
Hoo for children, open paved, some
(Chinatown space and seating trees
Gateway)
Park
Tai Tung .03 Play equipment Active Public Astroturf
Park for children
Reggie .35 Volleyball and Active Public No
Wong Park basketball
Eliot 1 Greenspace and Active Public Yes
Norton play equipment for
Park children
I-93 Unusable Public but Yes
Interchange inaccessible
Quincy Basketball Active Public but No
Upper limited access
School (school site)
basketball
courts
(Sources: Information on use derived from resident interviews; information on green space
from direct observation)
40Figure 6: Open Space within and around Chinatown (Boston Open Data)
Of Chinatown’s main parks, few contain significant green space. The Chinatown Park,
a portion of the Rose Kennedy Greenway, is a paved walkway with a border of bamboo and
other plants. It borders on Mary Soo Hoo Park, which is also primarily paved. Reggie Wong
Park is also paved and will be examined more fully in the next section of this report. Tai Tung
Park, a small pocket park, appears green at first glance but is actually carpeted in Astroturf; we
do not know whether this material provides some of the same mental health benefits as actual
plants, but it certainly does not provide the drainage benefits.
41Figure 7: Chinatown Park (Maura Barry-Garland)
These “non-green” parks serve important roles; on our two site visits, we observed
people gathering in Mary Soo Hoo Park to talk and play games. Reggie Wong Park is used by
the local volleyball league, and Tai Tung Park has play equipment for children.
The only park in Chinatown to contain significant green space is Eliot Norton Park, yet
this space is not even within the BPDA-defined boundaries for Chinatown. Although none of
the residents we spoke to knew this park by name, the two who lived in a senior housing
residence next to it said that they and their neighbors often spent time there.
Our open space audit found few public open spaces in Chinatown, and fewer still that
featured plant life. According to the residents we interviewed, this is a key area of
improvement for quality of life in the neighborhood. One process aimed at improving
Chinatown’s open spaces is already underway; the Reggie Wong Park redesign process seeks
to transform one of the neighborhood’s few outdoor active recreation spaces into a healthier
asset for the community.
The Reggie Wong Park Process
The Reggie Wong Park is a .35 acre park located near the I-93 highway and by a power
plant. It is one of only two parks in the neighborhood and is used primarily by Chinatown’s
volleyball and basketball players. The Reggie Wong Park redesign process is an effort to plan
improvements to the park that would reduce exposure to pollutants and make it a better asset
for community members. The design process has lasted two and a half years so far and has
involved two Tufts studies on air quality, a design charrette, and a community engagement
process culminating in a workshop with current users.
42Figure 8: Timeline of the Reggie Wong Park redesign process thus far
Between June 23 and July 8 in 2016 and again between April 9 and May 7, Tufts
researchers conducted a study on air quality at Reggie Wong Park. One of the 21 days studied
in spring showed higher levels of PM2.5 than recommended by the NAAQS standards.
Although these results indicate that levels of PM2.5 and other pollutants at Reggie Wong Park
are in healthy ranges most of the time, even the occasional incidence of PM2.5 levels above the
recommended level is dangerous as this is a site of basketball and volleyball games and air
pollution is especially harmful during heavy cardiovascular activity (Ambient, 2018).
In a design charrette held on June 4, 2016, residents reimagined development of Reggie
Wong Park around three outcomes: 1) protection of park visitors from air pollution; 2)
connection to the park and its identity to the surrounding neighborhoods; and 3) development
of park services for community members.
In April 2017, a team of Tufts researchers and Lydia Lowe of the Chinatown
Community Land Trust published “Improving Health in Communities Near Highways: A
Study of the Reggie Wong Park in Chinatown”. The report recommended using a building as a
barrier to the I-93 and making the park partially indoors so that community members
participating in team sports could do so protected from air pollution. Additional ideas in the
report included relocating the park to a parcel next door, adding a green connector, and
providing images and information on Reggie Wong’s story. A final idea was to construct a
library on the site and have the park be on its roof, thus separating users of the park from
harmful air pollution (Simon, 2017).
The codesign process was started in January 2018 as a joint effort of a Tufts University
team, the Chinatown Community Land Trust, Olin College of Engineering, and the
consultancy firm Linnean Solutions. On August 8, 2018, a workshop was held to present the
results of the codesign process so far to community members and gather more feedback
(Brugge 2018). It is difficult to evaluate the success of this process before it is complete, but
strengths so far have included having bilingual workshops with slides and translation in two
43languages, as well as heavy engagement of current users in the design process. This
reimagining of Reggie Wong Park has the potential to greatly enhance the park’s contributions
to public health. Since it makes up a significant portion of the total open space in Chinatown,
this redesign process is important.
Date Event Strength Question
April 9 - July 8, 2016 CAFEH study on air Gathering data to Is this a good site for
quality inform outdoor recreation?
decision-making Can it be made one?
Or should the courts
be relocated
elsewhere in the
neighborhood?
January - August Co-design process Translated slides and
2018 translator at all
meetings
August 8, 2018 Co-design workshop Invited current users Why weren’t
(volleyball teams) to potential users invited
actively participate in along with the current
the design users?
Open Space Possibilities for Chinatown
Enhancing Reggie Wong Park
Chinatown has few outdoor active recreation sites, but many residents involved in
volleyball leagues. Reggie Wong Park is an important asset and its health impacts could be
made more positive by relocating it within the neighborhood to a parcel farther from sources of
emissions. Our recommendation for the relocation can be found in the next section.
Adding Open Space to Odd-Shaped and Leftover Parcels
Tai Tung Park is an example of a pocket park that makes efficient use of a piece of land
so small that many would have overlooked it. While Chinatown is a dense neighborhood, it
still contains many odd-shaped and leftover parcels that could be converted to additional
pocket parks, including ones with live vegetation
44You can also read