A Future Stolen: Young and Out-of-School - Data & Analytics September 2018 - Unicef
←
→
Page content transcription
If your browser does not render page correctly, please read the page content below

A Future Stolen:
Young and Out-of-School
                          Data & Analytics
                          September 2018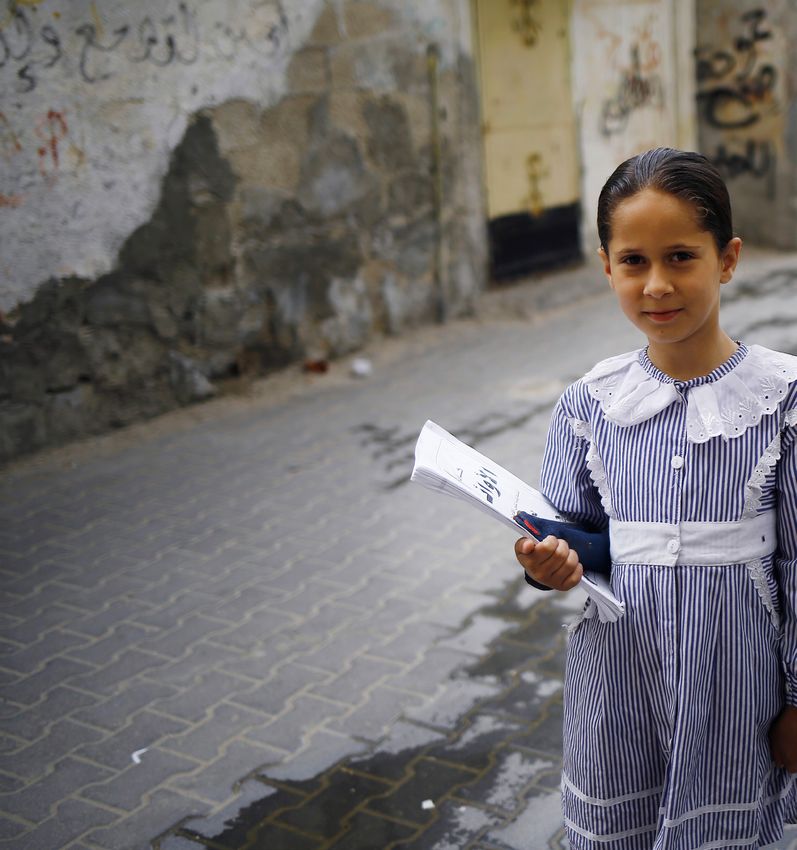
A Future Stolen:
    Young and out of school

    This is a critical moment in history. The global youth       With equitable and effective investment in high-quality
    population is growing rapidly, and if current trends hold,   learning experiences that begin in early childhood and
    the number of adolescents aged between 10 and 19             continue through to adolescence, governments, donors
    years old will rise to more than 1.3 billion by 2030, an     and civil society can help the next generation grow into
    increase of 8 per cent from today.1                          young entrepreneurs, productive individuals, trained
                                                                 professionals, committed leaders and engaged citizens.
    The majority of this burgeoning population lives in low-     According to a recent World Bank study, women who
    income and lower-middle-income countries. Access to          have completed secondary education are more likely to
    a quality education is perhaps the single most potent        work, and when employed, earn almost twice as much
    equalizer of opportunity for these individuals, yet as       as women without education.2
    the new data presented in this factsheet reveal, the
    magnitude of the challenges they face is enormous.           Investment in education is also key to reaching the
    Without a dramatic increase in investment in education       ambitious goals set out in the 2030 Agenda for
    for these children and young people, their situations        Sustainable Development (Sustainable Development
    will only deteriorate, and the world will see an increase    Goals, or SDGs). In particular, SDG Goal 4 calls on
    in unskilled and unprepared youth unable to embrace          governments to “ensure inclusive and equitable quality
    new technology and tackle the challenges of a rapidly        education and promote lifelong learning opportunities
    changing global economy.                                     for all.” None of these outcomes can be achieved
                                                                 without adequate funding for systematic support to
    By acting now, we can change the current trajectory          system re-building, improving access to education and
    and achieve the ambitions set out in the Sustainable         providing quality education through property trained
    Development Goals – to get every child and young             teachers. Currently, an annual gap of US$1.8 trillion
    person in school and learning by 2030. Children              exists between available funding and the US$3 trillion
    entering school now must be given the support they           a year needed in low- and middle-income countries to
    need to stay on course and complete the full 12 years        achieve SDG Goal 4 by the 2030 deadline.3
    of education.
                                                                 In countries where the working age population
                                                                 is growing faster than the dependent population,
    Education: A Critical Investment                             investment in education can yield a demographic
    in Our Global Future                                         dividend. If educated workers can participate in an
                                                                 economy with steady macro-economic growth, they
    Every child and young person has the right to go to          have a better chance of employment, increasing overall
    school and learn. When that right is fully realized,         productivity and raising living standards. This in turn will
    education provides children and young people with a          lead to improved public financing for countries’ social
    path out of poverty and the prospect of a stable and         sectors, resulting in more money being devoted to
    promising future. For nations, investment in quality         sustainable and equitable growth for all.
    education, starting from the early years, establishes the
    foundation for more peaceful and prosperous families,        1. United Nations Population Division, ‘World Population Prospects 2017’,
    communities and economies.                                   https://esa.un.org/unpd/wpp/DataQuery/, accessed 7 August 2018.
                                                                 2. https://openknowledge.worldbank.org/bitstream/handle/10986/29956/
                                                                 HighCostOfNotEducatingGirls.pdf?sequence=6&isAllowed=y
                                                                 3. The Learning Generation, Education Commission (2017)

2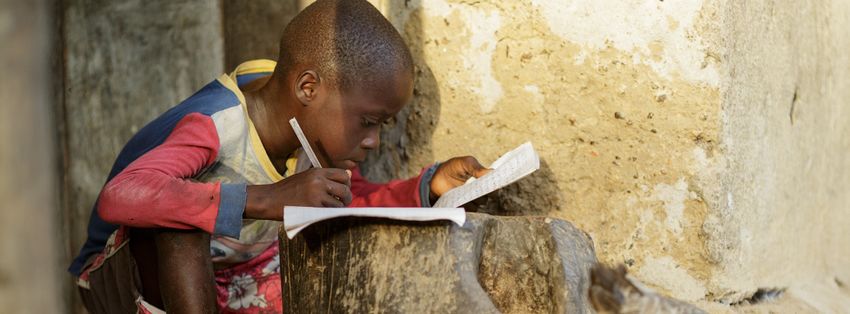
New Data, New Insights
Newly obtained data have shed light on three key challenges that must be addressed to avoid the negative
outcomes that will result from failure to adequately prepare the world’s youth for the future, namely weak
educational attainment, poverty, and conflict or disasters.
1. Low Rates of Educational Attainment
Globally, less than half of upper secondary school- not affected by emergencies, 54.8 per cent of
age children – 43.3 per cent of adolescent boys adolescents graduate from lower secondary
and 45.1 per cent of adolescent girls at the upper schools, but in countries affected by emergencies
secondary school age – are enrolled in or completed the proportion is only 28.9 per cent, and 18.4 per
upper secondary education. In addition, many young cent never even attend primary school. The root
people of upper secondary school age still attend causes of weak educational attainment at the upper
lower education cycles, i.e., 1 in 5 are still enrolled secondary level are usually limited initial access to
in lower secondary school, and 1 in 20 still attend education, and/or dropping out from primary and
primary school. Having these over-aged children in lower secondary education.
lower education cycles puts additional pressure on
resources that often are already stretched thin. Every young person who is not in education, training
or employment is at risk of being unprepared to
Among adolescents from countries affected by contribute to his or her country’s economic and
emergencies or natural disasters, only 26.6 per social development, and is likely to face a life of
cent reach upper secondary school. In countries limited opportunity and uncertain futures.
Figure 1: Educational pathways of upper secondary school age adolescents by gender
Upper Secondary
Male Female Transitioned to
100 90 80 70 60 50 40 30 20 10 0 0 10 20 30 40 50 60 70 80 90 100 upper secondary
Upper Did not transition to
4% 43% Secondary 45% 4%
upper secondary
6% 22% 47% 50% 17% 6%
Lower Lower Secondary
4% 75% Secondary 73% 5%
Completed lower
8% 6% 79% 78% 4% 9% secondary
Primary
7% 93% 90% 10% Still attending
lower secondary
Share of upper secondary age adolescentes (%) Share of upper secondary age adolescentes (%) Dropped out of
lower secondary
Data Source: UNICEF Education Database, 2018
Note: Global estimates are simple averages across countries.
Transitioned to
lower secondary
Figure 2: Educational pathways of upper secondary school age adolescents by emergency status Did not transition to
lower secondary
Non-emergency countries Emergency countries
Primary
100 90 80 70 60 50 40 30 20 10 0 0 10 20 30 40 50 60 70 80 90 100
Upper
5% 50% Secondary 27% 2% Completed primary
Still attending primary
6% 19% 55% 29% 20% 5%
Lower
Dropped out of primary
5% 80% Secondary 54% 4%
7% 3% 85% 58% 9% 14% Never entered primary
Primary
5% 95% 82% 18% Ever entered primary
Share of upper secondary age adolescentes (%) Share of upper secondary age adolescentes (%)
Data Source: UNICEF Education Database (2018) and countries where UNICEF has a humanitarian appeal – considered emergency countries/
countries affected by conflict or disaster
Note: Global estimates are simple averages across countries.
3
In many cases, adolescence brings challenges
                                                                            that interfere with education. Girls face barriers
                                                                            that include child marriage, gender-based
                                                                            violence, inadequate water, sanitation, and
    2. Poverty is a Prescription for Poor                                   hygiene, and the heavy burden of household
    Educational Attainment                                                  chores. For boys, barriers range from
                                                                            pressure to earn money to stereotypes around
    Poverty denies children and young people                                masculinity that encourage truancy.
    of their right to a quality education and
    a better future. In fact, a child’s socio-
    economic status is the single biggest
                                                                  Table 1: Percentage of out-of-school children and young people
    determinant of their educational attainment.
                                                                  based on socio-economic group
    School age children for primary to upper
    secondary education from the poorest                                                             Global          Urban        Rural        Richest        Poorest
    wealth quintile are nearly four times more                     Primary                              11.9          6.6             17.6        5.2           23.4
    likely to be out of school than those of the                   Lower Secondary                      15.1         10.0          19.6           6.7           28.2
    same age from the richest wealth quintile.                     Upper Secondary                      32.3         24.9          36.9          16.2           50.4

    Although the gender gaps in attendance                        Source: UNICEF Education Database 2018.
                                                                  Note: Averages are calculated based on relevant school age population.
    may appear small at the global level, in
    some countries, especially those dealing
    with emergencies, adolescent girls are                        Figure 3: Ratio of out-of-school children and young people among
                                                                  different socio-economic groups
    much less likely attend lower secondary
                                                                  5.0
    schools. For example, girls are 2.5 times                                                                  4.5
                                                                  4.5                                                                 4.2
    more likely to be out of school in countries                  4.0
    with conflict4, and the Gender Parity Index                   3.5                  3.2                                                                   3.1
    for adjusted net attendance rates of lower                    3.0                                   2.7
    secondary education in Central African                        2.5
                                                                                                                                2.0
    Republic, Afghanistan, Mali and Niger are                     2.0
                                                                                 1.6                                                                   1.5
                                                                  1.5
    0.56, 0.59, 0.76 and 0.75 respectively based                           1.0                    1.1                     1.2                    1.2
                                                                  1.0
    on the most recent data available.                            0.5
                                                                    0
    4. Nicolai, Susan, et al., Education Cannot Wait: Proposing
                                                                          Preprimary                Primary                Lower                   Upper
    a Fund for Education in Emergencies, ODI, London, May                                                                Secondary                Secondary
    2016, p.10, https://www.odi.org/sites/odi.org.uk/files/
    resourcedocuments/10497.pdf.                                          Gender Ratio               Rural-Urban Ratio                 Wealth Ratio

                                                                  Source: UNICEF Education Database 2018.
                                                                  Note: Preprimary refers to education one year before primary education (SDG4.2.2)
                                                                  Gender Ratio = OOSC ratio (Girls)/ OOSC ratio (Boys)
                                                                  Rural-Urban Ratio OOSC ratio (Rural)/ OOSC Ratio (Urban)
                                                                  Wealth Ratio = OOSC ratio (the poorest quintile) / OOSC ratio (the richest quintile)
                                                                  The value of 1.00 indicates absolute parity, and values between 0.97 and 1.03 are considered to be an
                                                                  acceptable parity level.

4
3. Conflict and Disasters Exacerbate Countries’
Out-of-School Burden
Countries affected by conflict and disasters bear a
heavy burden in terms of their out-of-school population.
Nearly 1 in 3 of all out-of-school children aged around
between 5 and 17 years old – an estimated 104
million young people – live in countries affected by
emergencies. When it comes to out-of-school children
at the primary level, more than half of out-of-school
children live in emergency countries.
For those living in countries affected by protracted
conflicts and complex humanitarian emergencies,
quality education is particularly critical as it provides
them with the stability and structure required to cope
with the trauma they have experienced, and equips Education can make or break the futures of children
them with the knowledge and skills they need to rebuild and young people. Urgent investment is needed to
their country once the conflict or disaster is over. get these children and young people – who are already
living in the most challenging of circumstances – into
Shortfalls in funding for education in emergencies have safe school and learning.
a devastating impact on children and young people’s
hope for a better future, yet less than 4 per cent of Among countries with available data, Niger has the
global humanitarian appeals are dedicated to education5. highest rate of out-of-school among secondary school
Unless the provision of education in emergencies is age young people (76 per cent), followed by Central
prioritized, a generation of children living in countries African Republic and South Sudan, with 67 per cent
affected by conflict and disaster will grow up without and 65 per cent respectively not in lower- and upper-
the skills they need to contribute to their countries and secondary school.
economies, exacerbating what is already a desperate
situation for millions of children and their families. 5. OCHA FTS database: https://fts.unocha.org
Table 2: Percentage of out-of-school children and young people globally, and in countries affected by conflict and disaster
Source: Calculation based on UNESCO Institute for
Global Average (%) Average of Emergency
Statistics database (2018), UNICEF Education database
Countries (%) (2018), and a list of countries where UNICEF has a
Primary 8.9 20.0 humanitarian appeal – considered emergency countries/
countries affected by conflict or disaster.
Lower Secondary 15.9 29.3 Note: Data does not include Libya, Somalia and
Madagascar due to data unavailability. Averages are
Upper Secondary 36.3 43.8 weighted based on relevant school-age population.
Table 3: Number of out-of-school children and young people living in countries affected by conflict and disaster
Source: Calculation based on UNESCO Institute for
Estimated # of Total # of OOSC Estimated share of Statistics database (2018), UNICEF Education database
OOSC in emergency in the World (in OOSC in Emergency (2018), and countries where UNICEF has a humanitarian
countries (in millions) millions) Countries appeal – considered emergency countries/countries
affected by conflict or disaster.
Preprimary (one year 15.3 39.7 39%
before primary only)
Primary 32.9 63.3 52%
Lower Secondary 23.7 61.1 39%
Upper Secondary 32.3 138.5 23%
Total 104.2 302.7 34%
5Figure 4: Countries with the highest out-of-school rates at the secondary
education level
Emergency-affected countries Non-emergency countries
0 10 20 30 40 50 60 70 80
Niger
Central African Republic
South Sudan
Eritrea
United Republic of Tanzania
Djibouti
Burkina Faso
Guinea
Mali
Mauritania
Ethiopia
Syrian Arab Republic
Côte d'Ivoire
Pakistan
Mozambique
Sierra Leone
Afghanistan
Chad
Benin
Senegal
Yemen
Cameroon
Gambia
Honduras
Burundi
Guatemala
Zimbabwe
Iraq
Nigeria
Comoros
Myanmar
Rwanda
Malawi
Cambodia
Zambia
Tokelau
Uganda
Data Source: Calculated based on UNESCO Institute for Statistics database (2018), UNICEF Education
database (2018), and UNICEF classification of Emergency Countries.
Note: Red indicates emergency countries. Data does not include Libya, Somalia and Madagascar due to
data unavailability.
Data & Analytics For more information, please contact
Division of Data, Research and Policy Suguru Mizunoya - smizunoya@unicef.org
3 United Nations Plaza Photography credit:
New York, NY 10017, USA Cover: © UNICEF/UN0231865/Njiokiktjien VII Photo
Page 3: © UNICEF/UNI151396/Asselin
© United Nations Children’s Fund (UNICEF) Page 5: © UNICEF/UN0225259/Brown
September 2018 Back cover: © UNICEF/UN068301/El Baba
Design: Cecilia Silva VenturiniYou can also read