A PUBLIC GOOD: cloudfront.net
←
→
Page content transcription
If your browser does not render page correctly, please read the page content below
A PUBLIC GOOD:
About the BC Humanist Association              Acknowledgements

Since 1984, the British Columbia Humanist      We are grateful for the assistance of Noah
Association has provided a community and a     Laurence and Alexandre Darveau-Morin for
voice for Humanists, atheists, agnostics and   gathering data, and to Stan Phelps for
the non-religious in BC. Humanism is a         editing. We also appreciate the assistance of
worldview that promotes human dignity          staff at municipalities across the province
without belief in a higher power. We are a     that assisted our research team. Thank you
registered charitable organization that        to our partners at the Voters Without
promotes progressive and secular values and    Religion Association and Canadian Atheists
challenges religious privilege.                whose financial support helped us secure
                                               data relating to statutory tax exemptions.
Support our work
                                               Recommended Citation:
Our work is made possible through the
support of our members and individual          Phelps Bondaroff, T., Thom, A., Prasad, R.,
supporters. Become a member at                   & Bushfield, I. (2021 F b u ). “A
www.bchumanist.ca/join or make a donation        public good: Should places of worship
at www.bchumanist.ca/donate                      that are private clubs, discriminatory, or
                                                 violate COVID-19 rules be tax exempt?”
Territorial acknowledgements                     BC Humanist Association.

This report was produced on the
                    SÁNEĆ        Lkwu g -
speaking peoples, the traditional and
unceded territories of the xʷməθkʷə əm,
Sḵwxw m              S w u            .
                                               Humanism relies on free inquiry, the power
Credit for cover image                         of science and creative imagination to solve
                                               the problems that confront us all. As such,
The Angel Moroni atop the Bountiful            this work is licensed under a Creative
Temple, Bountiful. Michael Hart, via           Commons Attribution 4.0 International
Unsplash                                       License. Feel free to share and reproduce
                                               this content but please acknowledge its
                                               source.
A public good?
Property tax exemptions for places of worship in
British Columbia
Authors
Dr. Teale Phelps Bondaroff, Research Coordinator, BC Humanist Association
Adriana Thom, Researcher, BC Humanist Association
Ranil Prasad, Researcher, BC Humanist Association
Ian Bushfield, Executive Director, BC Humanist Association
Abstract
This report examines tax exemptions granted to places of worship in British Columbia. It
begins with an explanation of two basic types of exemption – statutory tax exemptions
(STEs) that are granted automatically by the provincial government, and permissive tax
exemptions (PTEs) that can be granted by municipal governments. The report reveals that in
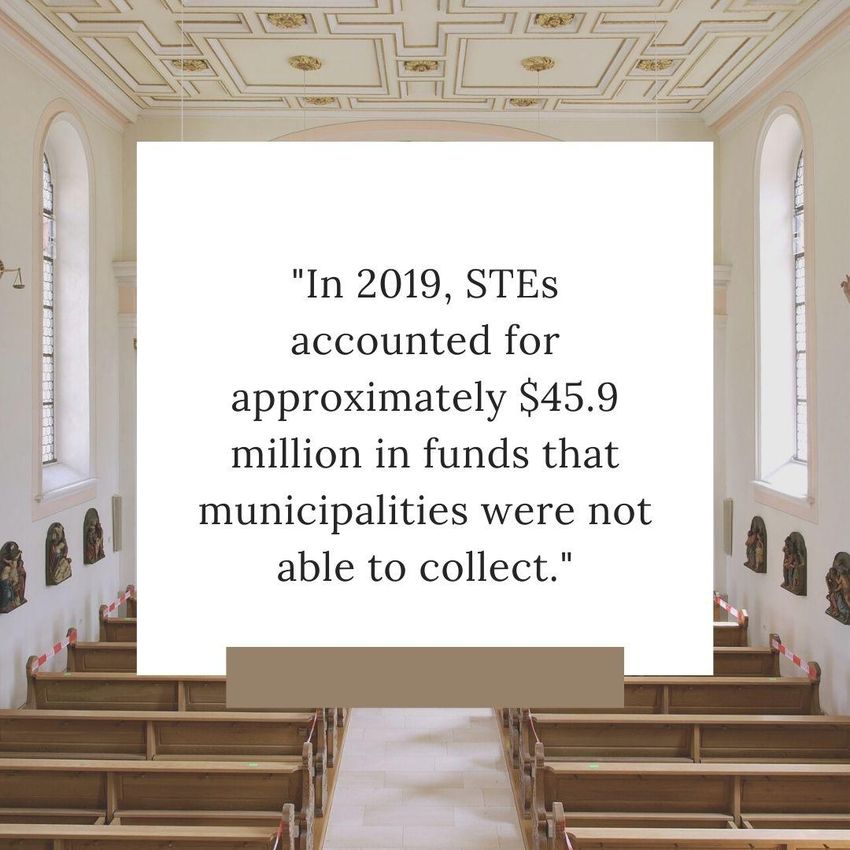
2019, places of worship in BC were automatically granted $45.9 million in STEs and $12.5
million in PTEs, amounting to $58.4 million, or roughly $12 per British Columbian. The
report explores a number of shortcomings pertaining to tax exemptions and places of worship
in BC. It details how the current system grants tax exemptions to recipients that may operate
as private clubs, run commercial enterprises, discriminate against protected groups, or violate
rules put in place to stop the spread of COVID-19. The automatic granting of tax exemptions
is also criticized, as this lacks appropriate oversight, strips municipalities of their autonomy,
and encroaches on their tax base. The report concludes by recommending that STEs be
abolished, and that municipalities adopt and equally apply rigorous benefits tests to ensure
that recipients of PTEs provide a benefit to the community that is accessible to all.
3
Introduction

Governments grant a variety of tax exemptions in order to support organizations that provide
a public good. These exemptions represent tax revenue that governments would otherwise
collect and must therefore be garnered from other sources. Tax exemptions, as a tool of
public policy, can help facilitate the efforts of organizations providing services that are of
benefit to all members of a community by obviating an organization’s need to allocate
(potentially) limited resources towards taxes. Organizations, as a result, can direct more
funding to providing services that benefit the community.

Governments support the work of organizations with tax exemptions with the assurance that
the belief that the recipient may be better situated or equipped to deliver a particular service,
or be capable of delivering that service more effectively. Government services should not be
exclusionary. These exemptions are not intended to support private clubs or enterprises that
exist only to benefit their members. Despite this, a considerable number of places of worship
in BC that cater almost exclusively to their membership continue to receive tax exemptions.

Tax exemptions, or any government funds, for that matter, should not be granted to recipients
that discriminate in contravention of the Canadian Charter of Rights and Freedoms and the
BC Human Rights Code,1 or that knowingly violate other laws. Despite this, tax exemptions
continue to flow to recipients that engage in discriminatory practices. Furthermore, places of
worship that knowingly and overtly violate COVID-19 rules and that have been fined for so
doing, enjoy thousands of dollars in tax exemptions. For example, the Langley Riverside
Calvary Chapel which has twice been fined $2,300 for violating COVID-19 regulations
received $11,997 in permissive tax exemptions from the Township of Langley and additional
statutory exemptions from the provincial government.2

It is reprehensible that tax exemptions that are intended to support works that benefit the
community should continue to flow to organizations that willfully violate rules designed to
arrest the progress of a deadly pandemic, and that do not provide services to the public, or
that do so in a discriminatory fashion. British Columbia must re-evaluate how it allocates tax
exemptions. The provincial government must abolish automatic statutory tax exemptions and
give more autonomy to municipalities with respect to tax exemptions. Municipalities need to
ensure that permissive tax exemptions, if they are granted, go to organizations that actually
provide for the public at large through the implementation of benefits tests.

1
  Canadian Charter of Rights and Freedoms, s 8, Part 1 of the Constitution Act, 1982, being Schedule B to
    the Canada Act 1982 (UK), 1982, c 11; and Human Rights Code, RSBC 1996, c 210.
2
  Little, S. (2021, January 10). “Group takes B.C. government to court over COVID-19 ban on in-person church
    services.” Global News. Available at https://globalnews.ca/news/7567161/churches-fight-covid-ban/
    (retrieved February 17, 2021); and see Township of Langley. (2020, July). “Annual report 2019: For fiscal
    year ending December 31.” Available at https://webfiles.tol.ca/CorpAdmin/2019-Annual-Report.pdf
    (retrieved February 17, 2021), p.31.

                                                                                                            4
This report examines tax exemptions granted to places of worship in BC. It begins with an
explanation of two principle types of exemption – statutory tax exemptions (STEs) that are
granted automatically by the provincial government, and permissive tax exemptions (PTEs)
that can be granted by municipal governments. Tabulating the totals of STEs and PTEs
granted in each municipality in BC, the report reveals that in 2019, the provincial government
granted $45.9 million in STEs to places of worship. With respect to PTEs, municipalities
relinquished $12.5 million in 2019 and $11.5 million in 2018. The report then explores some
of the shortcomings with respect to how these tax exemptions are allocated, and concludes
with recommendations specific to how these shortcomings can be ameliorated.

Tax Exemptions Explained

In BC, places of worship may receive exemptions from municipal taxation in two forms–
statutory and/or permissive tax exemptions. The mechanisms granting these exemptions are
detailed in the Community Charter,3 the Vancouver Charter,4 and the Taxation (Rural Area)
Act5 (see Appendix for detailed descriptions). Statutory tax exemptions (STEs) are
automatically granted to recipients, whereas in the case of permissive tax exemptions (PTEs),
municipalities are given a choice as to whether or not to apply an exemption and permitted to
establish criteria around the allocation of these exemptions.

Diagram 1 illustrates the difference between STEs from PTEs. A place of worship is
generally considered as a defined area that is used for theistic worship. It must be regularly
open to the public, and have public worship as the principal use of the property.6 Statutory tax
exemptions currently apply to buildings set apart for public worship and the land upon which
that building stands (amber portion of the diagram).7 Whereas PTEs, depending on municipal
bylaws, can be applied to the land surrounding the place of worship, improvements to that
land (such as parking lots or playgrounds), and additional halls or other similar structures that
are deemed ‘necessary to the exempt building’ (green portions of the diagram).8

3
  Community Charter, SBC 2003, c 26. For statutory tax exemptions see Div. 6, Section 220, and for permissive
    tax exemptions see Div. 7, Section 224. See
    https://www.bclaws.ca/civix/document/id/complete/statreg/03026_07#section224 (retrieved February 17,
    2021); and see Appendix.
4
  Vancouver Charter, SBC 1953, c 55, Section 396. See
    https://www.bclaws.ca/civix/document/id/complete/statreg/vanch_21#division_d2e35447 (retrieved
    February 17, 2021); and see Appendix.
5
  Taxation (Rural Area) Act, RSBC 1996, c 448. Part 2, Section 15. See
    https://www.bclaws.ca/civix/document/id/complete/statreg/96448_01 (retrieved February 17, 2021); and see
    Appendix.
6
  See BC Assessment. (n.d.). “Places of public worship policy.” Available at
    https://info.bcassessment.ca/services-and-products/APPs/Places-of-Public-Worship-Policy.pdf (retrieved
    February 17, 2021), p.3.
7
  See Community Charter, Section 220(1)(h); Vancouver Charter, Section 396(1)(c)(iv); and Taxation (Rural
    Area) Act, Section 15(1)(d).
8
  Community Charter, Section 224(2)(f)(ii).

                                                                                                            5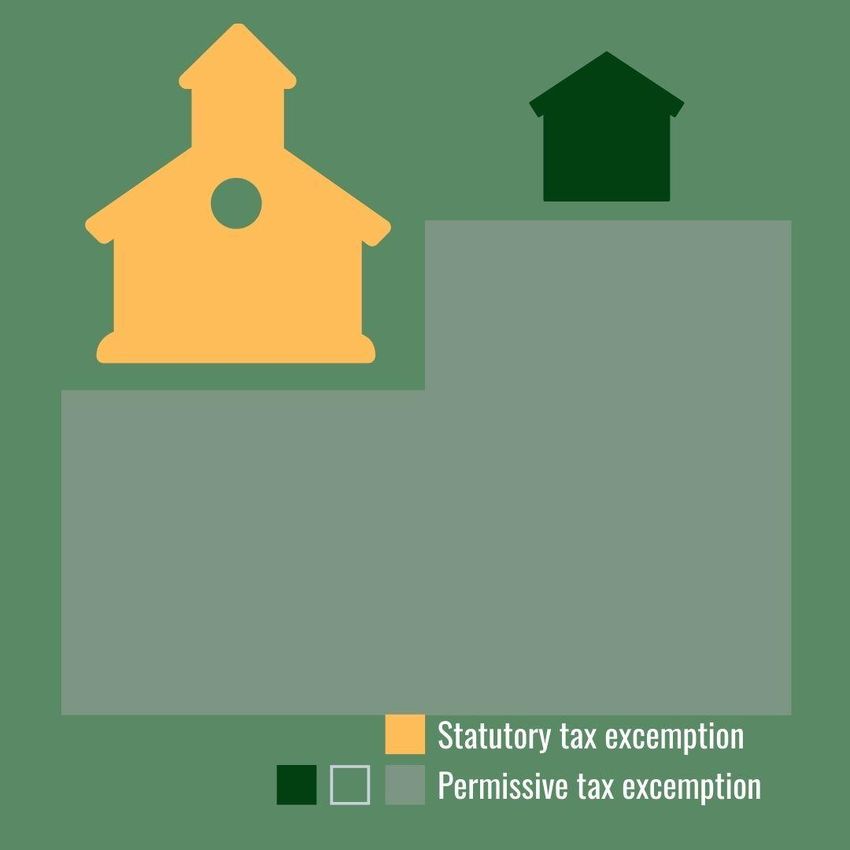
Diagram 1: Differentiating STEs from PTEs

The Community Charter contains provisions allowing municipalities to grant PTEs to
properties used for purposes, and by organizations deemed to provide, a public benefit,
including charities, nonprofits, land owned by the municipality or regional district, assisted
living homes, schools, athletic associations, and hospitals. These potential recipients have one
thing in common: they all provide a public good, that is, a beneficial service that is available
to all members of a community. PTEs for properties are granted for a period no longer than
10 years, whereas PTEs for places of worship are granted indefinitely.9

With respect to PTEs, municipalities are given the leeway to develop their own bylaws and
policies regarding how and when they grant these tax exemptions. In this manner,
municipalities may establish application processes, benefits tests, caps on amounts, time
limits (within the limitations of the appropriate charter). They may choose to automatically
apply a PTE to the additional property of any recipient of a statutory tax exemption, or to a
specific class of potential recipients, or they may subject applicants to appropriate levels of
scrutiny.

STEs are granted automatically by statute, without any controls or oversight by the
municipality. These exemptions apply to buildings in which worship occurs, but do not
include outbuildings, parking lots, or surrounding land. These portions of the property may be
granted a PTE.
9
    Community Charter, Section 224(5).

                                                                                                  6
Methods

The BC Humanist Association has conducted a detailed survey of municipalities in BC in
order to calculate the total of taxes exempted through PTEs for places of worship. To
accomplish this, our research team inspected the annual reports of each BC municipality
going back to 2015. We found that many municipalities delineate PTE recipients by class
(such as place of public worship, school, sports association, community activity centre,
community housing organization, community service organization), reflecting different ways
in which bylaws pertain to these classes of PTEs. Other municipalities simply group all PTE
recipients. In the later instance, we inspected the list of recipients individually and extracted
any that could be identified as a place of public worship.

In order to calculate the STEs for each municipality, we multiplied the recreation and non-
profit mil rates (tax rate) by the total assessed values for ‘churches and bible schools’ and
then divided it by 1000.10 This generated the total amount of forgone revenue (or the total
amount of properties exempted in each municipality). In response to a data request,11 BC
Assessment provided breakdowns of the aggregated property values for all properties
classified as the actual use code 652 or ‘churches and bible schools’12 for each jurisdiction in
the province in 2020. This included land values, any improvements (for example buildings)
and the total property value.

Property tax rates for 2019 for each jurisdiction are publicly available and were downloaded
from the Government of BC’s website.13 We assumed, where places of worship were
subjected to property taxes, that they would most likely be classified together with other non-
profit organizations under the ‘recreation non-profit’ rate. We added together the total of all
charges under that rate (municipal, regional district, hospital, school and other tax rates) to
calculate the total mil rate for each jurisdiction. This was then used to estimate the total tax
bill from which places of worship in each municipality where exempted.14

To gain a better understanding of the nature and content of PTE policies across BC, our
research team also surveyed the PTE policies of every BC municipality. A detailed analysis
of these policies is ongoing and will be released in a forthcoming report; however this general
survey provided us with sound understanding of the diversity of policies in the province, and
informed the discussion in this report.

10
   City of Vernon. (n.d). “Mill rate calculation.” Available at https://www.vernon.ca/homes-building/taxes-
    grants/property-taxes/mill-rate-calculation (retrieved February 17, 2021).
11
   The data was requested by the BC Humanist Association with support from the Voters Without Religion
    Association and Canadian Atheists.
12
   The full list of actual use codes is available at BC Assessment. (2021). “Actual use codes – Roll year: 2022.”
    Available at https://www.bcassessment.ca/Files/Misc/UserGuide/Tables/dataadv1.pdf (retrieved February
    17, 2021).
13
   Government of BC. (n.d). “Municipal tax rates & tax burden.” Available at
    https://www2.gov.bc.ca/gov/content/governments/local-governments/facts-framework/statistics/tax-rates-
    tax-burden (retrieved February 17, 2021).
14
   The formula is [total property value] x [mill rate] / 1000.

                                                                                                                    7
STE and PTEs by Municipality
The statutory and permissive tax exemptions by municipality are tabulated below. Note that
‘N/A’ appears where no exemptions in this category were granted. In the case of STEs, this
resulted because no places of worship were identified as being within the jurisdiction of a
particular municipality. Entries marked with a “—” indicate that the value was not available,
or could not be calculated due to a lack of data. This was typically the case with respect to
PTEs where a municipality’s annual report was not available at the time of tabulation, or we
were unable to determine whether or not places of worship received a PTE from the available
annual report. The latter was sometimes the case where a municipality did not disaggregate
their reporting on PTEs into categories (e.g. place of worship, school, sport, cultural
organization, etc.), which meant that we could not isolate just the value allocated to places of
worship. Note that where ‘$0’ is shown as the PTE value, we were able to confirm that no
PTEs were granted.
8Table 1: STE and PTE values for BC Municipalities in 2019
STE PTE Per
Population Per Per Capita
Municipality 201615 STE 2019 PTE 2019 Capita Capita Total
100 Mile House 1,886 $23,029 $9,287 $12 $5 $17
Abbotsford 149,928 $2,791,561 $809,191 $19 $5 $24
Alert Bay 489 $2,726 — $6 $6
Anmore 2,210 N/A $0 $0 $0 $0
Armstrong 4,815 $110,290 $83,627 $23 $17 $40
Ashcroft 1,558 $10,371 $7,304 $7 $5 $11
Barriere 1,713 $9,684 $3,021 $6 $2 $7
Belcarra 643 N/A $0 $0 $0 $0
Bowen Island 3,680 $12,075 $27,858 $3 $8 $11
Burnaby 249,197 $1,753,173 $1,695,516 $7 $7 $14
Burns Lake 1,779 $14,668 — $8 N/A
Cache Creek 963 $17,274 $8,147 $18 $8 $26
Campbell River 35,138 $329,041 $51,590 $9 $1 $11
Canal Flats 668 $474 $0 $1 $0 $1
Castlegar 8,039 $75,949 $17,893 $9 $2 $12
Central Saanich 16,814 $192,343 $158,814 $11 $9 $21
Chase 2,286 $13,246 — $6 N/A
Chetwynd 2,635 $17,375 $17,290 $7 $7 $13
Chilliwack 83,790 $913,267 $71,076 $11 $1 $12
Clearwater 2,324 $15,192 $1,462 $7 $1 $7
Clinton 641 $1,803 — $3 N/A
Coldstream 10,314 $31,215 $11,879 $3 $1 $4
Colwood 16,859 $128,572 $80,092 $8 $5 $12
Comox 14,828 $81,270 $15,183 $5 $1 $7
Coquitlam 140,028 $1,968,953 — $14 N/A
Courtenay 25,599 $132,878 $16,795 $5 $1 $6
Cranbrook 19,259 $297,611 $46,382 $15 $2 $18
Creston 5,306 $88,570 $22,280 $17 $4 $21
Cumberland 3,753 $5,492 $559 $1 $0 $2
Dawson Creek 12,978 $82,447 $32,495 $6 $3 $9
Delta 110,848 $1,760,996 $1,280,400 $16 $12 $27
Duncan 4,944 $64,429 $11,371 $13 $2 $15
Elkford 2,523 $7,960 $1,164 $3 $0 $4
Enderby 2,964 $26,234 $11,001 $9 $4 $13
15
Using numbers from the 2016 Statistics Canada Survey. Statistics Canada. (2019, June 17). Census profile,
2016 Census, provincial data, British Columbia. Census subdivisions (municipalities). Available at
https://www12.statcan.gc.ca/census-recensement/2016/dp-pd/prof/search-recherche/lst/results-
resultats.cfm?Lang=E&TABID=1&G=1&Geo1=&Code1=&Geo2=&Code2=&GEOCODE=59&type=0
(retrieved February 17, 2021).
9STE PTE Per
Population Per Per Capita
Municipality 2016 STE 2019 PTE 2019 Capita Capita Total
Esquimalt 17,655 $57,803 — $3 N/A
Fernie 5,249 $25,455 $34,127 $5 $7 $11
Fort St. James 1,691 $8,519 $3,932 $5 $2 $7
Fort St. John 20,155 $235,252 $242,192 $12 $12 $24
Fraser Lake 988 $4,138 — $4 N/A
Fruitvale 3,627 $3,514 $5,489 $1 $2 $2
Gibsons 4,605 $53,035 $58,283 $12 $13 $24
Gold River 1,212 $7,323 $1,074 $6 $1 $7
Golden 3,708 $45,786 $9,045 $12 $2 $15
Grand Forks 4,049 $53,517 $2,055 $13 $1 $14
Granisle 303 $371 $8,587 $1 $28 $30
Greenwood 665 $5,149 — $8 N/A
Harrison Hot Springs 1,468 $9,196 — $6 N/A
Hazelton 270 $7,357 $0 $27 $0 $27
Highlands 2,225 N/A $0 $0 $0 $0
Hope 6,181 $45,129 $27,856 $7 $5 $12
Houston 2,993 $42,115 $2,867 $14 $1 $15
Hudson's Hope 1,012 $4,547 $1,759 $4 $2 $6
Invermere 3,391 $24,671 $2,125 $7 $1 $8
Jumbo Glacier 0 N/A $0 $0 $0 $0
Kamloops 90,280 $1,088,357 $411,162 $12 $5 $17
Kaslo 968 $10,543 $0 $11 $0 $11
Kelowna 132,084 $1,387,619 $199,651 $11 $2 $12
Kent 6,067 $31,228 $22,249 $5 $4 $9
Keremeos 1,502 $14,574 $0 $10 $0 $10
Kimberley 7,426 $58,094 $10,961 $8 $1 $9
Kitimat 8,335 $218,730 $13,793 $26 $2 $28
Ladysmith 8,537 $20,859 $15,071 $2 $2 $4
Lake Country 15,000 $98,660 $28,814 $7 $2 $8
Lake Cowichan 2,974 $17,014 $19,294 $6 $6 $12
Langford 35,342 $48,686 — $1 N/A
Langley 25,888 $362,131 $251,018 $14 $10 $24
Langley 143,224 $2,294,349 $319,234 $16 $2 $18
Lantzville 3,605 $9,824 $2,263 $3 $1 $3
Lillooet 2,321 $12,684 $7,951 $5 $3 $9
Lions Bay 1,334 N/A $0 $0 $0 $0
Logan Lake 2,073 $5,881 $348 $3 $0 $3
Lumby 2,000 $20,522 $5,256 $10 $3 $13
Lytton 249 $518 $1,279 $2 $5 $7
Mackenzie 3,507 $14,865 $9,412 $4 $3 $7
10STE PTE Per
Population Per Per Capita
Municipality 2016 STE 2019 PTE 2019 Capita Capita Total
Maple Ridge 82,256 $908,149 $395,374 $11 $5 $16
Masset 793 $2,235 $0 $3 $0 $3
McBride 616 $8,467 $3,640 $14 $6 $20
Merritt 7,139 $55,005 $6,194 $8 $1 $9
Metchosin 4,708 $23,287 $3,680 $5 $1 $6
Midway 649 $2,896 — $4 N/A
Mission 38,833 $810,790 $236,299 $21 $6 $27
Montrose 19,305 $970 $2,243 $0 $0 $0
Nakusp 1,574 $16,610 $0 $11 $0 $11
Nanaimo 90,505 $527,511 $332,834 $6 $4 $10
Nelson 10,664 $80,970 $6,114 $8 $1 $8
New Denver 504 $2,419 $0 $5 $0 $5
New Hazelton 580 $10,106 $3,890 $17 $7 $24
New Westminster 70,996 $447,117 — $6 N/A
North Cowichan 28,807 $138,981 $46,336 $5 $2 $6
North Saanich 11,249 $87,188 $43,169 $8 $4 $12
North Vancouver 48,196 $494,050 $82,099 $10 $2 $12
North Vancouver 85,395 $257,701 $12,691 $3 $0 $3
Northern Rockies 5,393 $4,935 $5,518 $1 $1 $2
Oak Bay 18,094 $88,184 $74,779 $5 $4 $9
Oliver 4,928 $43,212 $10,804 $9 $2 $11
Osoyoos 5,085 $33,486 $33,064 $7 $7 $13
Parksville 12,514 $92,838 $38,271 $7 $3 $10
Peachland 5,428 $12,993 $12,262 $2 $2 $5
Pemberton 2,574 $1,438 — $1 N/A
Penticton 37,035 $440,704 $162,905 $12 $4 $16
Pitt Meadows 18,573 $54,089 $24,654 $3 $1 $4
Port Alberni 17,678 $84,478 $42,707 $5 $2 $7
Port Alice 805 $5,629 $6,440 $7 $8 $15
Port Clements 282 $1,873 $1,671 $7 $6 $13
Port Coquitlam 58,612 $1,059,405 $368,979 $18 $6 $24
Port Edward 544 $2,718 — $5 N/A
Port Hardy 4,132 $32,897 $43,603 $8 $11 $19
Port McNeill 2,064 $8,989 $9,204 $4 $4 $9
Port Moody 33,551 $83,531 $11,053 $2 $0 $3
Pouce Coupe 792 $868 $936 $1 $1 $2
Powell River 13,157 $439,875 $39,176 $33 $3 $36
Prince George 65,510 $485,971 $273,295 $7 $4 $12
Prince Rupert 12,220 $69,901 $9,659 $6 $1 $7
Princeton 2,828 $19,244 $18,598 $7 $7 $13
11STE PTE Per
Population Per Per Capita
Municipality 2016 STE 2019 PTE 2019 Capita Capita Total
Qualicum Beach 8,943 $82,124 $20,543 $9 $2 $11
Queen Charlotte 852 $1,747 $51 $2 $0 $2
Quesnel 23,146 $94,315 $11,989 $4 $1 $5
Radium Hot Springs 776 $9,320 $6,040 $12 $8 $20
Revelstoke 7,230 $125,751 $102,133 $17 $14 $32
Richmond 216,288 $2,724,320 $575,914 $13 $3 $15
Rossland 3,729 $14,983 $1,116 $4 $0 $4
Saanich 119,229 $1,649,726 $879,769 $14 $7 $21
Salmo 1,141 $7,886 $593 $7 $1 $7
Salmon Arm 17,706 $132,409 $167,837 $7 $9 $17
Sayward 341 N/A $0 $0 $0 $0
Sechelt 10,200 $105,450 — $10 N/A
Sicamous 3,166 $22,042 $10,503 $7 $3 $10
Sidney 11,672 $77,819 $39,818 $7 $3 $10
Silverton 10,313 $480 $0 $0 $0 $0
Slocan 272 $424 $725 $2 $3 $4
Smithers 10,607 $70,856 $37,909 $7 $4 $10
Sooke 13,001 $46,826 $42,491 $4 $3 $7
Spallumcheen 5,055 $22,247 $19,706 $4 $4 $8
Sparwood 3,784 $14,692 $2,115 $4 $1 $4
Squamish 19,512 $57,974 $12,761 $3 $1 $4
Stewart 494 $4,870 $3,751 $10 $8 $17
Summerland 11,615 $155,328 $27,903 $13 $2 $16
Sun Peaks 616 N/A $0 $0 $0 $0
Surrey 518,467 $3,353,018 $782,147 $6 $2 $8
Tahsis 316 $3,918 $2,034 $12 $6 $19
Taylor 1,373 $9,475 $5,043 $7 $4 $11
Telkwa 1,350 $27,293 $13,158 $20 $10 $30
Terrace 11,486 $140,370 $23,184 $12 $2 $14
Tofino 1,932 $24,392 $13,493 $13 $7 $20
Trail 7,709 $97,187 $0 $13 $0 $13
Tumbler Ridge 1,987 $11,466 $0 $6 $0 $6
Ucluelet 1,717 $19,258 $12,679 $11 $7 $19
Valemount 1,020 $5,082 $3,015 $5 $3 $8
Vancouver 675,218 $8,808,083 $0 $13 $0 $13
Vanderhoof 4,439 $109,071 $93,374 $25 $21 $46
Vernon 40,116 $585,010 $89,492 $15 $2 $17
Victoria 92,141 $1,921,386 $640,554 $21 $7 $28
View Royal 10,408 $26,824 $9,707 $3 $1 $4
Warfield 1,729 N/A $0 $0 $0 $0
12STE PTE Per
Population Per Per Capita
Municipality 2016 STE 2019 PTE 2019 Capita Capita Total
Wells 245 N/A $0 $0 $0 $0
West Kelowna 32,655 $227,991 $61,799 $7 $2 $9
West Vancouver 42,473 $404,047 $120,988 $10 $3 $12
Whistler 11,854 $39,554 $29,739 $3 $3 $6
White Rock 19,952 $128,755 $33,964 $6 $2 $8
Williams Lake 10,832 $284,125 $45,691 $26 $4 $30
Zeballos 107 N/A $0 $0 $0 $0
Total $45,917,788.24 $12,514,693
We calculated that as much as $45.9 million in potential tax revenue was forgone by
municipalities as a result of STEs in 2019. The municipality with the highest estimated value
of STEs is the City of Vancouver, with more than $8.8 million. These values are of course
related to property values, which is likely expected. The per capita value of STEs averaged
across all municipalities where STEs were granted was $9 (median $7), with the largest being
the City of Powell River with $33 per capita being allocated towards STEs.
Municipalities allocated over $12.5 million in PTEs in 2019. There was considerable variance
in the value of PTEs granted, with the highest being the City of Delta, which allocated nearly
$1.3 million in PTEs in 2019. The average per capita value of PTEs for municipalities that
granted them was $4 (median $3), with the largest being the Village of Granisle, which
granted $28 in PTEs for each of its 303 residents. While variation in populations, number of
places of worship, municipal policies, and property values make comparison difficult, the
average value of PTEs was $100,118 for municipalities granting PTEs (for which data was
available).
Combining STEs and PTEs, we estimate that the annual value of forgone taxes for places of
worship in BC is $58.4 million. The average per capita value of these forgone taxes amounts
to roughly $12 for each British Columbian. The highest per capita tax exemptions for places
of worship in BC (PTEs and STEs combined) was the municipality of Vanderhoof, and
amounted to $46 per person.
We found ten municipalities that do not include places of worship, and therefore did not
forgo any funds in the form of STEs or PTEs. These tended to be smaller villages and resorts,
such as Anmore, Lions Bay, Sayward, and Jumbo Glacier, with an average population of 945.
We were unable to locate the 2019 PTE values for 15 municipalities (9% of municipalities),
and as such, no generalizations could be drawn from these municipalities, which range from
small villages such as Alert Bay (population 489) to larger cities such as New Westminster
(population 70,996) and Coquitlam (population 150,028). We are aware that a number of
these municipalities do grant PTEs, but were unable locate disaggregated numbers in order to
isolate only those PTEs going to places of worship. As a result, the actual total value of PTEs
granted by municipalities very likely exceeds $12.5 million.
13In addition to the ten municipalities without places of worship, 10 municipalities reported
granting $0 in PTEs in 2019. While most of these municipalities were smaller villages with
populations under 2,000 – such as Canal Flats, Keremeos, and New Denver – a number of
larger municipalities also granted $0 in PTEs in 2019, including Trail (population 7,709),
Silverton (population 10,313), and Vancouver (population 675,218).
Table 2: PTEs Granted by BC Municipalities by Year
Year PTEs Granted
2015 $8,477,630
2016 $8,967,748
2017 $11,188,768
2018 $11,533,143
2019 $12,514,693
PTE values for the past five years were also gathered. It should be recognized that the
number of municipalities for which data was available decreases over time, and similarly
over this time, a number of other factors have influenced property values and tax rates.
Growth trend in these values, as a result, cannot necessarily be extrapolated, nonetheless,
there is a considerable upward trend that is observable between the value of PTEs granted in
2015 ($8.5 million) and those granted in 2019 ($12.5 million).
Discussion
Some of the issues and problems surrounding STEs and PTEs in BC are herein considered.
We recognize that this represents a survey of only some of the shortcomings of current
policies. Given the diversity of PTE policies (or lack thereof) in BC municipalities, a
comprehensive survey of these policies is not possible at this time. Instead, some of the issues
that persist across jurisdictions will be highlighted. Some of these concerns relate to both
types of tax exemption, while others apply to either PTEs or STEs, owing to the nature of
these exemptions. Where this is the case, these will be highlighted.
Public funds going to private clubs
The goal of tax exemptions is to support the work of groups and organizations that provide a
public benefit. The Community Charter16 grants PTEs to organizations such as charities,
nonprofits, hospitals, athletic associations, and assisted living homes. These potential
recipients share the common feature of offering public benefits that are accessible to all
members of the community.
16
Equally the Vancouver Charter and Taxation (Rural Area) Act, see Appendix.
14The automatic application of STEs to places of worship assumes that the recipients provide a
public benefit and that members of the general public are able to benefit from the services
offered by those places of worship. As is illustrated in the example of the Exclusive Brethren
(detailed below), this is not always the case – numerous places of worship operating as
private clubs are automatically granted STEs. This lax approach to oversight and fiscal
accountability is not a responsible policy. Underlying the current approach to STEs is the
assumption that all places of worship are publicly accessible, yet this is not the case. At the
very least, a responsible practice would be for governments to require the recipient of these
generous tax exemptions to demonstrate that their services are publicly accessible and that
they are not operating as a private club. The automatic application of STEs must be
abolished.
In addition to providing a space for religious practices for their members, many places of
worship offer charitable services, providing a benefit to the community at large, such as soup
kitchens or subsidized child care services. Municipalities should be able to encourage this
kind of beneficial work through the use of PTEs at their discretion. The onus must be on the
recipient to demonstrate that the services provided are publicly available (and beneficial) in
order to justify the receipt of a tax exemption.
Some places of worship offer charitable
services, but only do so for their members
or for co-religionists. Others make the
receipt of their services contingent –
requiring recipients to participate in
religious rituals or education as a
condition of receiving the charitable
service. This type of practice should not
be supported by a tax exemption, as the
contingent service is a form of
proselytising, marketing, or promotion
for the place of worship or religion, rather
than a public good. This type of
contingent service excludes non-believers
and those of other religions.
An example of this type of practice is the ‘Pray and Stay’ program that was run by St. Anne's
Anglican Church in Parksville. After the City of Parksville cancelled its plans for a cold
weather shelter, the Church set up a program where “overnight guests participate in a nightly
prayer vigil, eat a hot meal and then curl up on a pew or donated cot until the next
morning.”17 In 2019, St. Anne’s received a PTE of $7,939.72 from the City.18 While some
17
CBC News. (2019, December 15). “‘Pray and Stay’: Vancouver Island church opens doors (and pews) to
homeless.” Available at https://www.cbc.ca/news/canada/british-columbia/pray-and-stay-vancouver-island-
church-opens-doors-and-pews-to-homeless-
15may consider St. Anne’s offer of shelter as laudable and the Church insisted that the
requirement to participate in the religious service was minimal, the fact that this offer
required recipients to participate in religious practices potentially excludes those of other
religions and non-believers. A service is not publicly available if it is contingent on
participation in a religious service.
Some religious sects, and by extension their places of worship, are by the very nature of their
religious doctrines, exclusive only to members of those sects. An example, of one such sect is
the Exclusive Brethren, also described as the Plymouth Brethren, an evangelical Christian
sect. Many Exclusive Brethren follow a practice known as ‘the doctrine of separation,’ a
practice whereby members of a group seek to protect themselves from the evils of the world
by avoiding contact with people from outside their group.19 The Plymouth Brethren website
describes their application of the doctrine, explaining that “we make a commitment to eat and
drink only with those with whom we would celebrate the Lord’s Supper – that is the basis of
our fellowship.” The site defines ‘the world’ – society outside of their community – as a
“system of sin and lawlessness under the domination of Satan.”20 Many members of this sect
avoid television and other media, home school their children, and among other things avoid
participating in politics.21
For example, a recent case before B.C. Labour Relations Board considered a crossing guard
for the Abbotsford School District who is a member of the Plymouth Brethren Christian
Church member who sought an exemption from joining the local Teamsters Union, a
requirement of his job, on the basis of his belief in the doctrine of separation. The Board
rejected his request for an exemption.22
Religious groups, such as the Exclusive Brethren, are entirely within their right to separate
themselves from the rest of society; however, these same groups receive STEs and PTEs. For
example, the Parkview Gospel Hall, a Plymouth Brethren place of worship in Abbotsford,
received $4,400 in PTEs from the City of Abbotsford in 2019.23 Across the province, places
of worship associated with this sect received PTEs in 2019, including, for example the
1.5395312?fbclid=IwAR0h_PRxpOkaT4thtelb1caC4OkIEbFo6bLiMLJnFEfMnQHmoZGEdwyqNAI
(retrieved February 17, 2021).
18
City of Parksville. (2020). “2019 annual report.” Available at
http://www.parksville.ca/cms/wpattachments/wpID464atID9304.pdf (retrieved February 17, 2021).
19
See for example Hinnells, J.R. (1984). The Penguin dictionary of religions from Abraham to Zoroaster.
London, UK: Penguin Reference, p. 254.
20
Plymouth Brethren Christian Church. (n.d.). “Who we are – FAQs: What is involved in the doctrine of
separation?” Available at https://www.plymouthbrethrenchristianchurch.org/who-we-are/faqs/#what-is-
involved-in-the-doctrine-of-separation? (retrieved February 17, 2021).
21
BBC. (2009). “Religions: Exclusive Brethren.” Available at
https://www.bbc.co.uk/religion/religions/christianity/subdivisions/exclusivebrethren_1.shtml (retrieved
February 17, 2021).
22
Lindsay, B. (2021, February 7). “Member of reclusive church can’t get out of joining crossing guard union,
B.C. labour board says.” CBC. Available at https://www.cbc.ca/news/canada/british-columbia/bc-labour-
relations-crossing-guard-union-religious-exemption-1.5904039 (retrieved February 17, 2021).
23
City of Abbotsford. (2020). “Annual report: Fiscal year ending December 31, 2019.” Available at
https://www.abbotsford.ca/sites/default/files/docs/city-
hall/City%20of%20Abbotsford%202019%20Annual%20Report.pdf (retrieved February 17, 2021), p.143.
16Highway Gospel Hall in West Kelowna ($1,619.41),24 the Bakerview Gospel Chapel ($3,452)
and West Richmond Gospel Hall ($8,869) in Richmond,25 the North Surrey Gospel Hall
($2,247) and the Fleetwood Gospel Hall ($4,696) in Surrey,26 and the Prince George Gospel
Chapel ($749.60) in Prince George.27
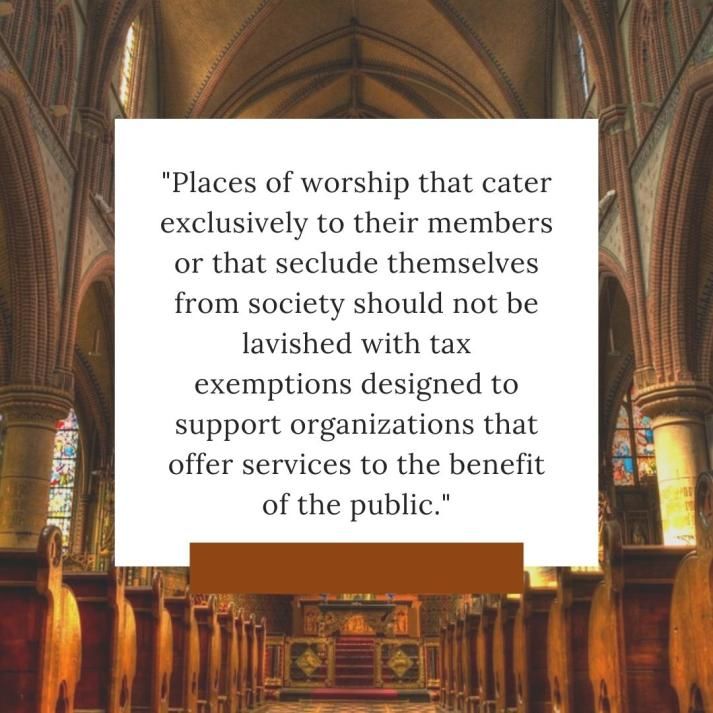
Places of worship that cater exclusively to their members or that seclude themselves from
society should not be lavished with tax exemptions designed to support organizations that
offer services to the benefit of the public.
In order to ensure that tax exemption
recipients provide services to the
benefit of whole community,
municipalities should implement
public benefits tests for recipients.
This is something a number of
municipalities already do. However,
such tests can only be applied to
PTEs – this level of proper oversight
is not possible with STEs. Again, a
solution to this issue is to abolish
STEs and make all tax exemptions
permissive, allowing municipalities
to use benefits tests in order to
evaluate applications to ensure that
the services of potential recipients are
available to all members of the
public.
A number of existing PTE policies include benefits tests which attempt to ensure exemptions
are not going to private clubs. The City of Kelowna, among others, includes the following in
their PTE policies/bylaws, noting that recipients
will provide benefits and accessibility to the residents for Kelowna.
Specifically, members of the public, within the appropriate age range, are
able to join a club or organization and participate in its activities for a
24
City of West Kelowna. (2020). “City of West Kelowna – Annual report, 2019.” Available at
https://secure.viewer.zmags.com/publication/9d14c72e#/9d14c72e/36 (retrieved February 17, 2021), p. 35.
25
City of Richmond. (2020). “2019 annual report: For the year ended December 31, 2019.” Available at
https://www.richmond.ca/__shared/assets/annualreport2019comp56398.pdf (retrieved February 17, 2021),
p.63.
26
City of Surrey. (2020). “2019 annual financial report: For the year ended December 31, 2019.” Available at
https://www.surrey.ca/sites/default/files/media/documents/2019_Annual_Financial_Report_WEB.pdf
(retrieved February 17, 2021), p.94 and p.96.
27
City of Prince George. (2020). “2019 annual report.” Available at
https://www.princegeorge.ca/City%20Hall/Documents/Finance/COPG_2019%20Annual%20Report%20%2
8WEB%29.pdf (retrieved February 17, 2021), p. 60.
17nominal rate or fee. Kelowna residents must be the primary beneficiaries
of the organization’s services. The services provided on the property must
be accessible to the public.28
The City of Victoria PTE policy includes the following provisions, noting that:
(13) Services and activities should be equally available to all residents of the
City.
(14) A recreation or community facility must be accessible by the public,
and the activities carried out on the property must be enjoyed by a
significant proportion of the general public.29
Similar provisions can be found in the PTE policies of the City of Parksville.30 The example
of St. Anne’s contingent and therefore restricted services, described above, demonstrates the
need of benefits tests and the actual application of these tests.
Municipalities wishing to act responsibly with tax dollars must have measures in place to
ensure that PTEs are only allocated to recipients whose services are available to all members
of the public. Furthermore, municipalities should ensure that they conscientiously apply these
benefit tests, otherwise the tests are rendered meaningless.
There is also the question of the impact of the tax dollars allocated to PTEs for places of
worship. A number of studies have indicated that participation in religious services at places
of worship is on the decline in Canada. For example, a PEW report noted that in 1986, 43% of
Canadian aged 15 years or older attended religious services at least once a month, while in
2010, this figure fell to 27%.31 Similarly, a 2020 survey by the Evangelical Fellowship of
Canada, quoted in Faith Today magazine, noted that only 11% of Canadians attend religious
services weekly (for all religious traditions), and that this number was down from 30% in
28
City of Kelowna. (August 2005). “Permissive Tax Exemption Policy.” Resolution R840/17/10/16. Available
at https://www.kelowna.ca/sites/files/1/docs/city-hall/policies/permissive_tax_exemption_-_policy_327.pdf
(retrieved February 17, 2021), Section 6; and see for example Section 6, Town of Ladysmith. (August 2012).
“Permissive Tax Exemption Policy.” Resolution 2012-274. Available at
https://www.ladysmith.ca/documents/PTE%20Application%20Pkg.pdf (retrieved February 17, 2021); and
Section 6, City of West Kelowna. (June 2015). “Permissive Tax Exemption Policy.” Available at
https://www.westkelownacity.ca/en/city-hall/resources/Documents/Permissive-Tax-Exemptions-Policy.pdf
(retrieved February 17, 2021).
29
Section 5, City of Victoria. (May 2013). “Permissive tax exemption.” Available at
https://www.victoria.ca/assets/Departments/Finance/Documents/property-tax-permissive-exemption.pdf
(retrieved February 17, 2021).
30
City of Parksville. (September 2004). “Permissive Taxation Exemption Applications.” Policy No. 6.15,
Resolution No. 04-285. Most recent revision, February 5, 2018. Available at
http://www.parksville.ca/cms/wpattachments/wpID475atID8247.pdf (retrieved February 17, 2021), Sections
13 and 14.
31
A General Social Surveys cited by Wormald, B. (2013, June 27). “Canada’s changing religious landscape.”
Pew Research Center. Available at https://www.pewforum.org/2013/06/27/canadas-changing-religious-
landscape/#_ftnref6 (retrieved February 17, 2021); see also Lipka, M. (2019, July 1). “5 facts about religion
in Canada.” Pew Research Center. Available at https://www.pewresearch.org/fact-tank/2019/07/01/5-facts-
about-religion-in-canada/ (retrieved February 17, 2021).
181996 and 67% in 1946.32
Declining attendance and congregation sizes means that tax exemptions for places of worship
are going to support a diminishing number of parishioners. Setting aside the question of
whether the place of worship provides a benefit to the community at large, diminishing
attendance raises the question of whether or not the funds allocated to tax exemptions could
have a greater impact if otherwise allocated. Put another way, municipalities need to ask the
question whether they could get ‘more bang for their buck’ if the money were used to support
another organization or cause, one which would benefit a greater number of people?
Public funds going to groups that exclude and discriminate
While most places of worship and the religious communities supporting them are open and
welcoming, some are not. Automatically granting STEs to all places of worship results in tax
exemptions being granted to organizations which intentionally exclude people from
participation. Disbursing PTEs without rigorous benefits tests which include provisions
relating to discrimination, risks supporting groups that discriminate.
The Canadian Charter of
Rights and Freedoms, which
applies to the actions of all
levels of government,
establishes that “every
individual is equal before and
under the law and has the
right to the equal protection
and equal benefit of the law
without discrimination.”33
Governments should not
support programs that would
discriminate against people on
the basis of race, national or
ethnic origin, colour, religion,
sex, or age, or mental or
physical disability.
32
Hiemstra, R. (2020, January 8). “Not Christian anymore.” Available at
https://www.faithtoday.ca/Magazines/2020-Jan-Feb/Not-Christian-anymore (retrieved February 17, 2021).
33
Canadian Charter of Rights and Freedoms, 15(1).
19A private club may be within its rights to restrict membership and participation in a
discriminatory fashion; this should not be the case for government. When a government
provides organizations STEs or PTEs, it is supporting those organizations, and government
should only support groups that adhere to the Charter, otherwise the Charter would be made
meaningless, as a government could discriminate by adding degrees of separation between
itself and the discrimination.
It is unfortunately not hard to imagine a place of worship that might refuse to rent out its hall
to members of the LGBTQ+ community. The 2005 BC Human Rights Tribunal case Smith
and Chymyshyn v. Knights of Columbus and others,34 where a couple had their rental
agreement for a hall which was operated and maintained by the Knights of Columbus
(Knights) cancelled when the Knights learned that the couple was same sex. The Knights of
Columbus is a Catholic men’s organization, and the hall in question was located on land
owned by the Archdiocese of Vancouver, alongside the Our Lady of Lourdes Parish
(Catholic) Church and a Catholic School in the City of Coquitlam. The Knights apparently
“granted priority to Catholic groups to rent the hall, but also rented broadly to community
groups.”35
In this case, the Knights conceded that they had indeed discriminated against the couple, but
argued that “they had a bona fide and reasonably justifiable reason for refusing the rental,
based on their constitutional right of freedom of conscience and religion.”36 The BC Human
Rights Code (Section 8(1)) does stipulate that:
(1) A person must not, without a bona fide and reasonable justification,
(a) deny to a person or class of persons any accommodation, service or
facility customarily available to the public, or
(b) discriminate against a person or class of persons regarding any
accommodation, service or facility customarily available to the public
because of the race, colour, ancestry, place of origin, religion, marital
status, family status, physical or mental disability, sex, sexual orientation,
gender identity or expression, or age of that person or class of persons.37
And numerous other clauses of the Code include the ‘bona fide and reasonable justification’
proviso. The ruling of the BC Human Rights Tribunal was mixed. The Tribunal ruled “that a
34
Smith and Chymyshyn v. Knights of Columbus and others, 2005 BCHRT 544, available at
https://web.archive.org/web/20130513122736/http://www.bchrt.bc.ca/decisions/2005/pdf/Smith_and_Chym
yshyn_v_Knights_of_Columbus_and_others_2005_BCHRT_544.pdf (retrieved February 17, 2021).
35
Boonstra, K., & Benson, I. (2006, February 23). “The scope of protection for religious dissent regarding
same-sex marriage?” LexView. Available at https://www.cardus.ca/article/lexview-54-0-the-scope-of-
protection-for-religious-dissent-regarding-same-sex-marriage/(retrieved February 17, 2021); and see St.
Clare of Assisi Parish. (n.d.). “Parish life at St. Clare’s – Knights of Columbus.” Available at
https://stclare.ca/parish-life/service/knights/ (retrieved February 17, 2021).
36
Boonstra & Benson 2006.
37
Human Rights Code, RSBC 1996, c 210, Section 8(1). Available at
https://www.bclaws.gov.bc.ca/civix/document/id/complete/statreg/96210_01#section13 (retrieved February
17, 2021).
20person cannot be compelled by the Code to act in a manner that is in conflict with a core
religious belief. As such, the Knights were justified in refusing the rental.”38 The Tribunal did
find that the Knights had discriminated against the complainants on the basis of their sexual
orientation contrary to the Code (Section 8), and concluded that “while the Knights need not
have rented the hall to the Complainants, they were required to accommodate the
Complainants to the point of undue hardship.”39
Ultimately the complainants, Tracey Smith and Deborah Chymyshyn, were compensated for
lost and excess marriage costs ($444.59) and awarded $1,000 each for “injury to their dignity,
feelings and self-respect.”40
While as a private club the Knights were within their rights to adopt discriminatory renting
practices, this does raise the question as to how this might affect any STEs or PTEs on the
property in question. A Catholic Church, Our Lady of Lourdes, shares the property with the
Knights’ hall, and this church is automatically granted an STE under current statutes. The
City of Coquitlam’s 2019 annual report did not list the values of PTEs allocated to places of
worship,41 though a number of documents note that 30 places of worship received PTEs from
the city in 2019.42 The city’s annual reports for the years during Smith and Chymyshyn’s case
record PTEs being granted five properties owned by the Roman Catholic Archbishop of
Vancouver amounting to $72,481 in 2004, and $75,648 in 2005.43
While the Tribunal found that the provisos in the Human Rights Code that allow for
discrimination given a ‘bona fide and reasonable justification’ applied to the Knights, and by
extension, other individuals and organizations seeking to discriminate on similar grounds,
these provisos do not apply to government, which must adhere to the Charter. As such,
organizations that discriminate in this way, or in other ways that contravene the Charter,
should not receive a subsidy from the state. A tax exemption represents just such a subsidy.
38
Boonstra & Benson 2006.
39
Ibid.
40
Ibid.; see also Valpy, M. (2005, February 2). “The Knights and the lesbians: Exhibit A in same-sex uproar.”
The Globe and Mail. Available at https://www.theglobeandmail.com/news/national/the-knights-and-the-
lesbians-exhibit-a-in-same-sex-uproar/article975014/ (retrieved February 17, 2021); and see Matas, R.
(2005, November 30). “Knights entitled to deny lesbians, tribunal says.” The Globe and Mail. Available at
https://www.theglobeandmail.com/news/national/knights-entitled-to-deny-lesbians-tribunal-
says/article985703/ (retrieved February 17, 2021).
41
The City of Coquitlam discontinued the practice of reporting PTE values for individual places of worship in
its annual reports in 2011. See City of Coquitlam. (2020). “Annual report 2019.” Available at
https://www.coquitlam.ca/DocumentCenter/View/2263/Coquitlam-Annual-Report-2019 (retrieved February
17, 2021), p. 110; and see City of Coquitlam. (2012). “2011 Annual Report.” p. 76; and City of Coquitlam.
(2011). “2010 Annual Report.” p. 68.
42
See for example City of Coquitlam. (2019, October 11). “Taxation Exemption Amendment Bylaw, 5012,
2019.” File 09-3900-20/5012/1, Doc# 3445051.v1. Available at
https://coquitlam.ca.granicus.com/MetaViewer.php?view_id=2&clip_id=1465&meta_id=30219 (retrieved
February 17, 2021); and see City of Coquitlam. (2019, February 26). “Fourth and final reading of City of
Coquitlam 2019 Five-Year Financial Plan Bylaw.” File 09-3900-20/4952/1, Doc# 3251300.va. Available at
https://coquitlam.ca.granicus.com/MetaViewer.php?view_id=2&event_id=338&meta_id=24493 (retrieved
February 17, 2021).
43
See City of Coquitlam. (2005). “City of Coquitlam annual report 2004,” p.73; City of Coquitlam. (2006).
“City of Coquitlam Annual Report 2005,” p.73.
21An example of this principle in action is evident in recent changes to Canada’s Summer Jobs
program. In 2018, the federal Liberal government updated rules concerning which
organizations could receive funds from its youth summer job grant program. After some back
and forth, the government adopted rules “requiring applicants to declare… that the
organization does not actively work to infringe upon human rights, including access to
abortion.44 On the basis of these rules, the government denied 26 applications in 2019.45 The
principle behind this rule is that the government should not fund organizations that are
actively working to undermine core Charter rights. On this same basis, supporting
organizations with discriminatory practices through tax exemptions should be prohibited.
The automatic nature of STEs means that the government has no ability to determine whether
or not the recipients actively work to infringe upon human rights, and as such, it is certain
that places of worship with discriminatory practices are currently receiving tax exemptions in
BC. In order to uphold its commitment to the Charter, the BC government should end the
practice of automatically granting STEs.
Furthermore, any reasonable
benefits test for PTEs should
include the basic question as to
whether or not the applicant
discriminates against people on
the basis of race, national or
ethnic origin, colour, religion,
sex, or age, or mental or
physical disability. It is
important that this question be
explicitly asked in a benefits test
rather than assuming that the
absence of a human rights
complaint implies an absence of
discrimination. Tacit
discrimination could otherwise
be overlooked.
The case of Smith and Chymyshyn v. Knights of Columbus is again instructive. In this case,
the two women were “unaware that the hall was operated by a Catholic organization and said
they would not have rented the hall if they had known.”46 This is likely the experience of
44
Smith, J. (2019, August 29). “Trudeau Liberals continue to ask applicants for summer job funds their view on
abortion.” National Post. Available at https://nationalpost.com/news/canada/feds-denied-summer-job-grants-
to-26-groups-over-abortion-rights-issue (retrieved February 17, 2021); and see Global News. (2019, August
29). “26 groups denied Canada Summer Jobs grants over abortion stance.” Available at
https://globalnews.ca/news/5831085/canada-summer-jobs-abortion/ (retrieved February 17, 2021).
45
Global News 2019; and see Smith 2019.
46
Matas 2005.
22other LGBTQ+ people who avoid accessing, booking, or trying to book spaces operated by
religious organizations with discriminatory beliefs. In these situations, the discrimination is
tacit, and does not result in cases being brought to the Human Rights Tribunal. However, this
does not suggest that places of worship receiving tax exemptions do not restrict access to
their spaces in a discriminatory fashion. A benefits test is needed to ensure that this in fact
does not occur.
Applicants for PTEs should reveal details about their practices and should be denied a tax
exemption if they are found to be discriminatory. The Government of BC and municipal
governments province-wide have a duty to uphold the Canadian Charter of Rights and
Freedoms, which means not supporting organizations that violate the Charter through tax
exemptions.
Public funds going to groups that break the law and undermine public health and safety
Implicit within the automatic
nature of STEs and the generous
essence of PTEs is the
assumption that places of
worship provide a public good.
The previous two sections
describe how access to the
potential public good offered by
places of worship could be
restricted, either exclusively to
their members or in a
discriminatory fashion.
However, it is also the case that
the actions taken by a place of
worship could harm society,
break the law, or imperil lives.
This is particularly relevant
during the ongoing COVID-19
pandemic.
The potential for religious gatherings to become ‘super-spreader events’ is very real, with
religious gatherings linked to outbreaks of COVID-19 globally. In South Korea, for example,
the Shincheonji Church of Jesus in Seoul was at the centre of South Korea’s first outbreak of
COVID-19. At one point, this Church was linked to 36% of cases in the country.47 The list of
deadly outbreaks linked to gatherings at places of worship is disturbingly long and growing.48
47
BBC News. (2021, January 13). “Shincheonji: Korean sect leader found not guilty of breaking virus law.”
Available at https://www.bbc.com/news/world-asia-55642653 (retrieved February 17, 2021); see also
23Religious gatherings present a particularly high risk of spreading COVID-19 for a number of
reasons. The American Medical Association (AMA) notes that religious services include five
key risk factors:
Enclosed spaces. Clusters of COVID-19 infections are linked mostly to
indoor settings. Even if improved ventilation may reduce transmission, there
is no scientific consensus on standards for controlling COVID-19’s spread in
an indoor environment.
Large groups. On average, larger groups contain more people who are
infected and more people who can potentially become infected.
Close proximity to others. The smallest SARS-CoV-2 droplets can remain
airborne and travel farther than six feet. The scientific community does not
Osborne, S. (2020, June 24). “Super-spreader church at centre of South Korea’s coronavirus outbreak sued
for £66m.” The Independent. Available at https://www.independent.co.uk/news/world/asia/coronavirus-
super-spreader-church-south-korea-daegu-shincheonji-jesus-a9582951.html (retrieved February 17, 2021);
and see Shin, Y., Berkowitz, B., & Kim, Min Joo. (2020, March 25). “How a South Korean church helped
fuel the spread of the coronavirus.” The Washington Post. Available at
https://www.washingtonpost.com/graphics/2020/world/coronavirus-south-korea-church/ (retrieved February
17, 2021).
48
See for example Lisinski, C. (2020, December 2). “Houses of worship have become COVID super-spreaders
in Massachusetts.” NBC Boston. Available at https://www.nbcboston.com/news/local/houses-of-worship-
have-become-covid-super-spreaders-in-massachusetts/2246099/ (retrieved February 15, 2021); Kuznitz, A.
(2020, November 4). “More COVID-19 deaths linked to super-spreader events at Charlotte church.” The
Charlotte Observer. Available at https://www.charlotteobserver.com/news/coronavirus/
article246965397.html (retrieved February 15, 2021); La Grassa, J. (2020, October 30). “Blenheim church
outbreak an example of ‘quintessential super spreader event.” CBC News. Available at
https://www.cbc.ca/news/canada/windsor/covid-19-church-spreader-event-1.5783090 (retrieved February
15, 2021); Alsharif, A., & Almasy, S. (2020, October 22). “Nearly 50 people contracted coronavirus after
fellowship event at a small church in Maine.” CNN. Available at https://www.cnn.com/2020/10/22/us/
maine-church-covid-19-outbreak/index.html (retrieved February 15, 2021); McKeiver, D. (2021, January 3).
“Hundreds pack NC church prompting fears of ‘super-spreader’ event.” CBC17. Available at
https://www.cbs17.com/news/hundreds-pack-church-prompting-fears-of-super-spreader-event/ (retrieved
February 15, 2021); Al Jazeera. (2020 March 18). “Made in Malaysia: How mosque event spread virus to SE
Asia.” Available at https://www.aljazeera.com/news/2020/3/18/made-in-malaysia-how-mosque-event-
spread-virus-to-se-asia (retrieved February 15, 2021); Lozinski, P. (2020, October 8). “Mayor, northern chief
calling for charges against organizers of ‘superspreader’ event.” Prince Albert Daily Herald. Available at
https://paherald.sk.ca/2020/10/08/mayor-northern-chief-calling-for-charges-against-organizers-of-
superspreader-event/ (retrieved February 15, 2021); Epp, C. (2020, May 10). “’I would do anything for a do-
over’: Calgary church hopes others lean from their tragic COVID-19 experience.” CTV News. Available at
https://calgary.ctvnews.ca/i-would-do-anything-for-a-do-over-calgary-church-hopes-others-learn-from-their-
tragic-covid-19-experience-1.4933461 (retrieved February 15, 2021); Smitha, T.K. (2020, August 12). “Why
is Tirupati Temple not being shut down, despite becoming a hotspot?” The Quint. Available at
https://www.thequint.com/coronavirus/hotspot-tirumala-tirupati-temple-will-not-shut-down-venkateswara-
andhra-pradesh-coronavirus-staff-covid (retrieved February 15, 2021); Sengar, S. (2020, August 11).
“Tablighi Jamaat, Tirupati Tirumala Temple & other religious places that turned super-spreaders.” India
Times. Available at https://www.indiatimes.com/news/india/tablighi-jamaat-tirupati-tirumala-temple-
religious-places-that-turned-super-spreaders-520088.html (retrieved February 15, 2021); Rosenberg, D.E.
(2020, October 12). “The government can’t save the ultra orthodox Jews from COVID-19. Religious leaders
can.” Foreign Policy, Available at https://foreignpolicy.com/2020/10/12/the-government-cant-save-ultra-
orthodox-jews-from-covid-19-religious-leaders-can/(retrieved February 15, 2021); and see Phririyasart, F. et
al. (2020, June). “Outbreak investigation of coronavirus disease (COVID-19) among Islamic missionaries in
southern Thailand, April 2020.” Outbreak, Surveillance, Investigation & Response (OSIR) Journal, 13:2, 48-
54.
24You can also read