A review of national EV statistics and state-specific travel patterns and transportation electrification metrics - Atlas Public Policy December ...

Page created by Jesus Berry
 
CONTINUE READING
A review of national EV statistics and state-specific travel patterns and transportation electrification metrics - Atlas Public Policy December ...
A review of national EV statistics and state-
   specific travel patterns and transportation
   electrification metrics

Atlas Public Policy
December 2020
A review of national EV statistics and state-specific travel patterns and transportation electrification metrics - Atlas Public Policy December ...
Our Key Focus Areas
                                      • Access: Collect and
                                        disseminate publicly available
                                        information.
                                      • Interpret: Create technology
• DC-based policy tech firm started     to spur insights and conduct
  in 2015
                                        data-driven analyses.
• We equip businesses and
  policymakers to make strategic,     • Empower: Strengthen
  informed decisions through the        policymakers, businesses,
  greater use of technology that        and non-profits’ ability to
  aggregates publicly available         meet emerging challenges
  information                           and identify and seize
                                        opportunities.
A review of national EV statistics and state-specific travel patterns and transportation electrification metrics - Atlas Public Policy December ...
• The EV Hub gives stakeholders from
        across the EV industry quick access
        to key data and information on the
        market, policies and regulations, and
        activities by the EV community
      • A one-stop shop for businesses,
        policy professionals, and the
        advocacy community to learn more
        about what’s going on in the EV
        market
      • A comprehensive platform for the EV
        community: www.atlasevhub.com

Free access for public agencies and Clean Cities Coordinators!
A review of national EV statistics and state-specific travel patterns and transportation electrification metrics - Atlas Public Policy December ...
Data Sources by Category
• All national data is collected by
                                        National Figures
  Atlas
                                        • Atlas EV Hub Dashboards
• State-specific metrics are either
  statewide or from 1 urban region      State Emissions

  in Nevada (Core Based Statistical     • U.S. EPA/EIA
  Area):                                • Union of Concerned Scientists

   • Las Vegas (Las Vegas-Henderson-    State Travel Behavior
     Paradise, NV)
                                        • Federal Highway Administration
• Caveats                               • 2017 National Household Travel Survey (NHTS)
   • National Household Travel Survey
                                        State Mass Transit
     (NHTS) data is a survey (not
     population-level data)             • National Transit Database
A review of national EV statistics and state-specific travel patterns and transportation electrification metrics - Atlas Public Policy December ...
Review of EV sales, government funding, and market
                    developments
A review of national EV statistics and state-specific travel patterns and transportation electrification metrics - Atlas Public Policy December ...
• The auto market overall is down 17 percent through
  September
• U.S. passenger EV sales rallied in Q3, only down 2% compared
  to 2019
• EV market holding steady around 2% of all light-duty vehicle
  sales and > 5% of passenger car sales
• Tesla accounts for 60% of sales since 2018
A review of national EV statistics and state-specific travel patterns and transportation electrification metrics - Atlas Public Policy December ...
• Automakers and other
  stakeholders continue to rollout EV
  investment as sales recover
• $443 billion in global investment
    • $71 billion destined for U.S.
• $14 billion in new investment
  between July and October
• GM leads new investment push
  with $2 billion commitment in
  October
A review of national EV statistics and state-specific travel patterns and transportation electrification metrics - Atlas Public Policy December ...
EV Funding
                                                                  $48,269,635 (4%)
                                                $100,054,575 (8%)

• Government programs have           $120,532,598 , 10%
  provided more than $1.25
  billion for electric trucks and
  buses through October 2020
• Almost 60% going to electric
  transit buses
                                                                                                           $715,055,429 (59%)
• Electric trucks and school
  buses each claim roughly 20%      $228,134,436 (19%)

• 20% of funding awarded
  through the VW Settlement

                                         Transit Bus      School Bus    Delivery Trucks   Freight Trucks    Other Trucks
A review of national EV statistics and state-specific travel patterns and transportation electrification metrics - Atlas Public Policy December ...
• More than 14 new EVs introduced since July 2019
• Luxury brands like BMW, Volvo and Porsche claim the
  most EV models
• Ford, GM, and Fiat-Chrysler only claim 5 out of 52 EVs
  across all brands
A review of national EV statistics and state-specific travel patterns and transportation electrification metrics - Atlas Public Policy December ...
More EV Models are Coming Very Soon

• Some new EVs have been delayed by COVID-19
• Rivian and Tesla electric pickups expected in second
  half of 2021
• Volkswagen ID4 crossover in production in Europe,
  will be made in U.S. in 2022
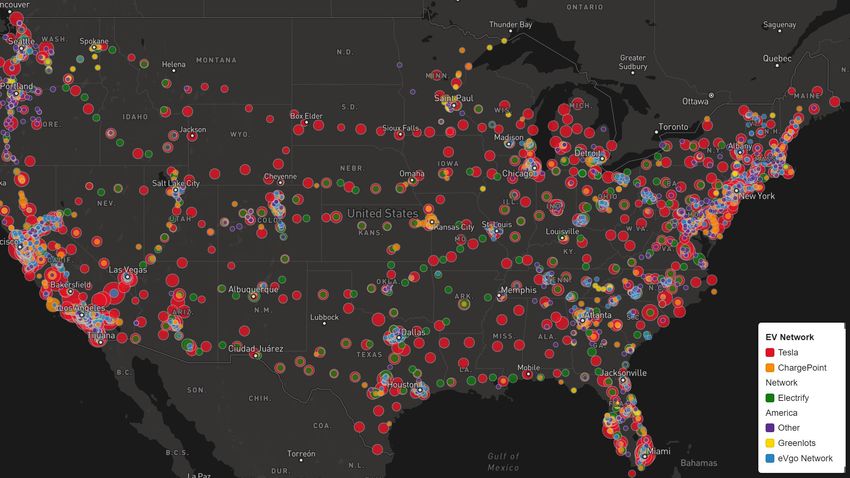
•   More than 18,800 fast charging ports
      •   More competition for market-leader Tesla
      •   Electrify America nationwide network reaches coast to coast
      •   ChargePoint entered the stock market through a reverse merger

* Estimated based on dates stations added to AFDC Station Locator   Source: Atlas EV Hub (www.atlasevhub.com)
• Bloomberg New Energy Finance
  (BNEF) projects EVs to reach 60%
  of new passenger vehicles sales in
  the U.S. by 2040.
• EVs only expected to account for
  4% of new vehicles sales in 2023
• Electric buses and trucks to make
  up 64% and 15% of global fleets by
  2040

                         Source: BNEF
Analysis of emissions and EV deployment and funding

                                                This Photo by Unknown Author is licensed under CC BY-NC-ND
In-state and
                                              regional
   75% of VW       Announced Plans to
                                            partnerships
Settlement Funds   Join ZEV Program in
                                         targeting charging
     Unspent            June 2020
                                           infrastructure
                                               rollout
EV Sales (through September 2020)            EV Charging Deployment
• State Total: 11,194 (23rd in nation)       • State Level 2 Total: 691 ports
• Change 2019-2020 (Jan - September): +1%    • State DCFC Total: 303 ports (20th in nation)
• EVs per 1k People: 3.83 (14th in nation)   • DCFC per 1k people: 0.10 (6th in nation)
• Models Offered: 43 out of 52

Approved Utility Investment                  Government Funding for EVs
• State Approved Total: $4.4 million         • State Total since 2018: $10 million
• Pending Investment: $0 million             • % of Total Awarded in 2020: 0%
’
            Mobile Emissions by Mode (tons)               • Nevada ranks 39th of 50
                                        On-Road Heavy       states in total CO2 emissions
                                         Duty Vehicles
                                                            and 40th in energy
Non-Road
Equipment                                     4%
   39%                                   Aircraft
                                           4%               consumption for all sectors
                                           Locomotives      per capita
                                               2%

                                                          • Light-duty vehicles account for
                                                            51% of the state’s mobile
                                                            emissions of criteria air
                                                            pollutants
  On-Road Light
  Duty Vehicles
      51%                                                Sources: EIA State Carbon Dioxide Emissions Data, EIA State Profiles
• The state falls in NWPP grid
  region
• Driving an EV charged in
  NWPP region produces
  emissions comparable to 102-
  mpg vehicle
• This puts the state above the
  national average of 88 mpg

                                  Source: Union of Concerned Scientists
• 11k EVs sold in Nevada through
  September 2020
    • 23rd out of 50 states
• 23.8 EVs per 1,000 people
    • 14th out of 50 states
• Sales up 1% between January and
  September compared to 2019
• Most Popular EVs since 2019:
    • Tesla Model 3 (2,461)
    • Tesla Model X (521)
    • Tesla Model Y (417)
EV Awards
                                                      $1,500,000
$10M awarded for EVs
                                                         15%
and EV charging in      $5.4M from VW
Nevada through          Settlement

October 2020

EVs account for 100%    73% of state’s
                        VW Settlement                                                                    $5,371,880
of awards made          allocation                                                                          55%
through VW Settlement   unspent
                                         $2,975,000
                                            30%

School bus funding
                        Grants for
available from NV       buses open
Energy
                                               Airport Support Ground Equipment   Transit Bus   Charging Station
• In June 2020, Nevada Governor Steve Sisolak
  announced plans to join the California ZEV
  program
     •   State would join 12 others requiring
         automakers to offer a certain percentage of
         EVs for sale in the state
• Nevada is already a part of REV West Plan
     •   Plan establishes interstate coordination
         between AZ, ID, CO, MT, NM, UT, and WY on
         corridor charging infrastructure
• Nevada Electric Highway agreement between
  NV Energy and Office of Energy
     •   Target to install DC fast charging along I-95
         connecting Reno and Las Vegas throughout
         2020
A review of vehicle miles traveled (VMT) statewide and travel
choices in Las Vegas using data from 2017 National Household
                         Travel Survey

                                                        This Photo by Unknown Author is licensed under CC BY-SA
• Trucks, including light-duty,                                                          VMT (million of miles)
                                                                                             Other Truck
     account for 22% of VMT in                                                        Bus
                                                                                                1,773
                                                                                                 6%
                                                                                                                           Motorcycle
                                                                                                                              128

     state                                                                            297
                                                                                      1%
                                                                                                                              0%

   • Drivers in Las Vegas reported                                      Light Truck
                                                                           4,412

     an average 9,545 annual VMT                                           16%

         • Lower than average of 11,620
           annual VMT across 52 most
           populous U.S. metros*

                                                                                                                                Passenger Vehicle
                                                                                                                                     21,708
                                                                                                                                      77%

* Combined Statistical Areas with a population of more than 1 million   Source: https://www.fhwa.dot.gov/policyinformation/statistics/2018/vm4.cfm
• In urban Nevada, personal vehicles made up 92% of reported annual VMT
           • Average across 52 major U.S. metro areas* was 90%
       • Urban drivers in Las Vegas drive more pickups compared to average across major 52 U.S. metro
         areas

              Annual VMT in Metro Nevada by                             Annual VMT in All U.S. Major Metro
                      Vehicle Type                                          Regions by Vehicle Type
                            11%                                                     9%

                                                                              9%
                      8%

                                                     53%                                            54%

                    28%                                                     28%

* Combined Statistical Areas with a population of more than 1 million                                     Source: https://nhts.ornl.gov/
Annual Passenger Miles Per Person by Mode
                                                        Walk   Bike   School Bus   Transit Bus   Train
                                            400

                                            350
Annual Passenger Miles Per Person by Mode

                                            300
                                                                                                             • Transit buses are 2nd most
                                            250
                                                                                                               popular travel mode after
                                                                                                               passenger vehicles in urban
                                            200                                                                Nevada
                                                                                                             • No reported train in metro
                                                                                                               Nevada
                                            150

                                            100                                                              • Bus travel in Nevada roughly
                                                                                                               equals national average
                                            50

                                             0
                                                         Nevada Metros                       Top 52 Metros
A review of transit patterns in major urban areas using data
               from National Transit Database
• Per person transit bus usage double in las Vegas
                                                                  compared to Reno
                                                                • Only metro rail services in Nevada are in Las Vegas
                                                                • Vanpool is a popular mode of transit travel in Reno

                                             Annual Passenger Transit Miles Per Capita
                                    140
Annual Miles Travelled Per Capita

                                    120

                                    100

                                    80

                                    60

                                    40

                                    20

                                     0
                                          Las Vegas                                                          Reno
                                                      Demand Response   Rail   Bus   Van pool

                                                                                                Source: https://www.transit.dot.gov/ntd/transit-agency-profiles
2018 Passenger               Las Vegas
                                                                                      2018 Passenger Miles
                                                                            Miles by Vehicle
                                                                            Fuel Type by Vehicle Fuel Type             18%

            • Transit agencies awarded $3 million for                                                82%

              electric transit bus procurement since                                                 Diesel   CNG    Gasoline
              2018
                                                                                                              Reno
            • Neither Las Vegas nor Reno reported
              passenger miles on battery electric transit
              in 2018
            • Reno reports 21 electric buses in their
              fleet as of 2020                                                                 42%                              40%

            • Las Vegas has no reported electric transit
              buses
            • CNG buses dominate the Las Vegas fleet

                                                                                                               18%
Source: https://www.transit.dot.gov/ntd/data-product/2018-fuel-and-energy
•   CNG busses account for more than 70% of the Las Vegas fleet
•   Reno has 21 electric transit buses while Vegas has none.
•   Biodiesel transit buses make up more than 60% of the Reno fleet

            100%
             90%
             80%
             70%
             60%
             50%
             40%
             30%
             20%
             10%
              0%
                                  Las Vegas (2020)                                                       Reno (2020)
    CNG                                 369                                                                  0
    Diesel Hybrid                        0                                                                   2
    Battery Electric                     0                                                                   21
    Bio Diesel                          90                                                                   46
    Diesel                              40                                                                   0

                                                        Source: https://www.apta.com/research-technical-resources/transit-statistics/vehicle-database
info@atlaspolicy.com
You can also read