A Simple Measure to Study Multinational Income Inequality
←
→
Page content transcription
If your browser does not render page correctly, please read the page content below
Review of Economic Perspectives – Národohospodářský obzor
                                Vol. 21, Issue 1, 2021, pp. 27–40, DOI: 10.2478/revecp-2021-0002

A Simple Measure to Study Multinational Income
Inequality
Gharehgozli Orkideh1 and Atal Vidya2

Abstract: Using the Big Mac Index, we offer a simple measure to study the real income
inequality. We provide a multidimensional real income inequality analysis by exploring
the Coefficient of Variation and the Big Mac Affordability of households across all in-
come deciles of 28 countries for the years 2000 to 2013. We look more into a few of the
most interesting countries in our analysis in order to have explanations for the wide range
of income inequality we observe. We compare Denmark and Mexico as representatives
of the “more equal” and “less equal” countries in our analysis, and we find a visible dif-
ference in the share of each decile to the top decile of income between the two countries.
However, we observe that, although a more equal country, Denmark has been exp erienc-
ing a rise in income inequality while a less equal country (Mexico) has been experiencing
a reduction in income inequality. We also focus on the United States and study how it
compares to Russia, a country that shows a different direction of income inequality com-
pared to the U.S.A. We find that while the wage income inequality in Russia has been
correlated inversely with its growth, in the U.S.A., the overall growth and wage income
inequality have been positively correlated.
Keywords: Big Mac Index, Income Inequality, Income Distribution Decile, Comparative
Country Studies
JEL Classification: D31, O57
Received: 9 March 2020 / Accepted: 21 December 2020 / Sent for Publication: 16 March 2021

Introduction
Milanovic (2016), in his Global Incidence Curve,3 explains that the real incomes more
than doubled between 1988 and 2011, a shift that involved large swaths of people (almost

1 Corresponding author. Department of Economics, Feliciano School of Business, Montclair State
University, 1 Normal Avenue, Montclair, NJ 07043, USA. Tel: +1-973-655-7504. Email:
gharehgozlio@montclair.edu
2 Department of Economics, Feliciano School of Business, Montclair State University, 1 Normal

Avenue, Montclair, NJ 07043, USA. Tel: +1-973-655-7403. Email: atalv@montclair.edu
3 GIC shows the world’s population along the horizontal axis, ranked from the poorest to the richest

percentile; real income gains between 1988 and 2008 (adjusted for countries’ price levels) are
shown on the vertical axis.

© 2021 by the authors; licensee Review of Economic Perspectives / Národohospodářský obzor, Masaryk University, Faculty
of Economics and Administration, Brno, Czech Republic. This article is an open access article distributed under the terms
and conditions of the Creative Commons Attribution 3.0 license, Attribution – Non Commercial – No Derivatives.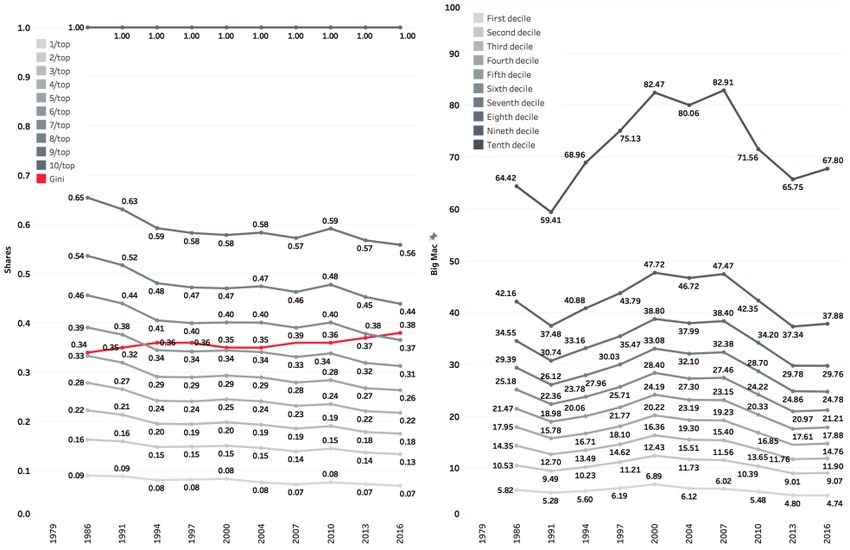
Review of Economic Perspectives

a third of the world population, most of them from Asia). He explains that the expansion
of incomes around the median of the global income distribution was so overwhelming
that it ensured global inequality’s decline — despite the real income growth of the top 1%
and rising national inequalities in many countries. However, in a different paper, Mila-
novic and Roemer (2016) look over the fact that people care about both their absolute
income level as well as their relative positions in national income distributions — not
global ones.
In this paper, we utilize the Big Mac Index to study real income inequality by measurin g
and comparing the affordability of households in each income decile from each country
in our analysis. Specifically, we aim to rank, compare, and contrast countries based on
the average number of Big Macs an individual belonging to a given income decile can
afford in a day, we call it the Big Mac Affordability (BMA) (see Atal (2014), Gharehgozli
and Atal (2020a, 2020b)).
The Economist magazine introduced the Big Mac Index in 1986 as an alternative to the
consumer price index in which the market basket consisted of a single product—McDon-
ald’s Big Mac burger. This approach provides a more digestible alternative to measure
and compare the purchasing power of currencies of different countries. More over, using
this index simplifies the cross-country purchasing power parity across in-come deciles
and in particular, it tells us the real income of an average income holder in an income
decile in terms of only one commodity—food.
We aim to explore the household income of 28 countries over the period 2000 to 2013.
The purpose is to propose a simple and tangible measurement of income inequality. We
compare income inequality across countries by looking into BMA and measuring the Co-
efficient of Variation as a measure of dispersion and the share of different deciles to the
top. We provide an overall comparison among countries, but later we study, more in depth,
the most equal and unequal country in our analysis: Denmark and Mexico. We also pro-
vide a detailed study for Russia and U.S.A. because the income inequality for these coun-
tries are moving in the opposite direction in recent years. While U.S.A.’s income inequal-
ity has increased during the period of study, Russia’s inequality has substantially de-
creased.

1.   Why the Big Mac Index?
The studies concerning measurements on inequality go back to Kuznets (1955) and Bour-
guignon (1979). Kuznets was a pioneer in the field who studied the relationship between
inequality and the economic output of a country. Bourguigno n explored the decomposi-
tion of income inequality measures such that it can be broken down into a weighted av-
erage within subgroups of the population. In general, in more recent empirical studies,
real income inequality research is conducted by studying the income or output of the
countries converted into US Dollar using exchange rate or PPP adjustments, and then
comparing across income strata. For example, Atkinson (1996) provides a compa rison
between the personal distribution of income in Europe and the U.S.A. Piketty and Saez
(2003, 2014) study income inequality in the U.S.A. with the measures mentioned above.
Many recent studies are also concerned with the dynamics of the social aspect of income
inequality rather than the measurements of it. Blau and Bla u (1982) study the relationship

28

Volume 21, Issue 1, 2021
between urban criminal violence and the difference in racial inequality in socio -economic
conditions. Oishi et al. (2011) study the relationship between inequality and happiness in
the US from 1972 to 2008. Wilkinson (2002) finds, among the developed countries, it is
not the richest societies that have the best health, but those which have the smallest in-
come differences between rich and poor.
Regarding the measurement of income inequality, it has been found that higher GDP (in
wealthier countries) mostly comes from the higher productivity of the manufacturing sec-
tor, which increases the wages and sets prices higher (for both traded and non -traded
products) (for example, see Baily et al. (2014)). This means that the traded products will
have similar prices across countries. However, local services and products will be cheaper
in the poorer countries. As well-explained by Kravis et- al. (1978), this can cause values
of the PPP-converted-real GDP to be higher (and more accurate) than based on exchange-
rate-converted GDP in poorer countries. Therefore, instead of using a price of only traded
products, for example, Penn World Table uses “detailed prices within each country for
different expenditure categories, regardless of whether the output is traded internation-
ally.” (Summers and Heston, 1988, 1991, 1996; Johnson et al., 2009; Cow-ell, 2011;
Feenstra et al., 2015).
Although our approach of studying real income inequality using the Big Mac Index does
not overturn any conventional wisdom regarding real income inequality, we strongly be-
lieve this approach has a potential benefit.
To cross-over from the international figures to the countries, the Big Mac Index does not
affect the real measure of inequality over time; that is, had any other deflator been used,
the trends and intra -decile variation would remain. Furthermore, we believe the argument
mentioned above supports the application of the Big Mac Index in measurements of living
standards further because we use income in local currencies and convert it into afforda-
bility using local price of the Big Mac burger. It is a product that by nature is internation-
ally provided yet the price is non-sticky and adjusts to the local situations of the house-
holds in local currencies.
This index has been popular among researchers since its introduction. For example, The
Economist uses it to show whether a country’s currency is over or under-valued relative
to the US Dollar. San Vicente Portes and Atal (2014) measured the effectiveness of the
Big Mac Index in measuring a country’s inflation. Daniele and Malanima (2017) demon-
strate, using the Big Mac Index, that the dispersion in real wages across regions in Italy
is minimal, although nominal wages could be vastly different. Using a similar approach,
Loveridge and Paredes (2018) show that “(living) costs in a metro -adjacent county are
not different than areas that are much more rural” in the United States.
2. Sample and Data
The income decile data presented in this study is extracted from the Luxembourg Income
Study Database (LIS, 2019). It is the largest available database of harmonized micro -level
income and wealth data consisting of about 50 countries over abo ut 50 years. The data-
base contains household and individual-level data on various sources of income, taxes
and transfers. We use this data for our study of income inequality. The main variable of
interest in this dataset is nominal “Equivalised Disposable Household Income” which is
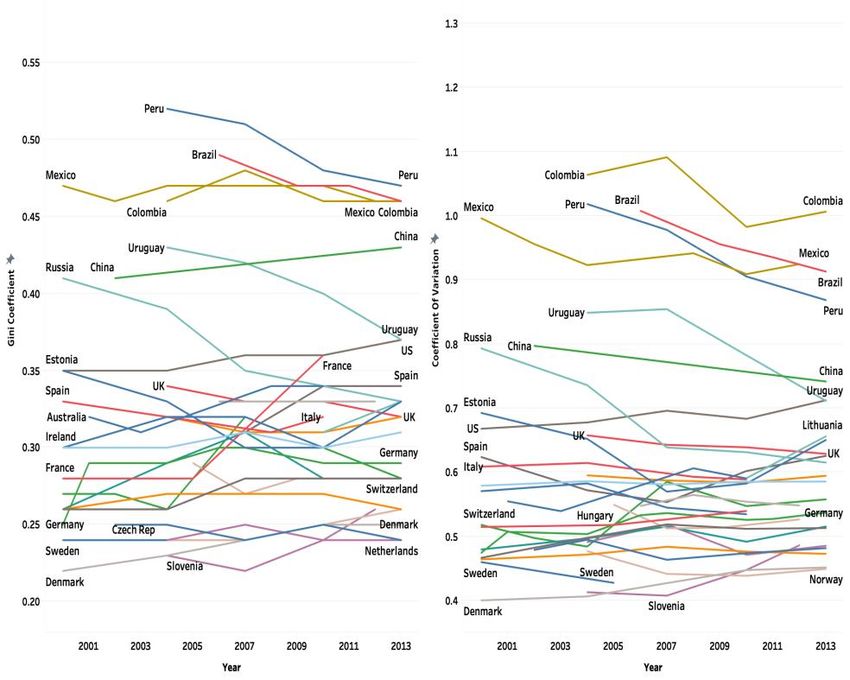
29Review of Economic Perspectives defined as the “total household monetary and non -monetary current income net of income taxes and social security contributions, equivalised by dividing by the square root of the number of household members.” For the United States, recorded data is available up until 2016, and up until 2013 for all other countries. For the Big Mac Index, we use The Economist database which provides the nominal price of a Big Mac burger for about 57 countries going back to 1986 (Economist, 2019). Th e crosswalk of the two datasets provides time-series of data on 28 countries over a span of years from 1986 to 2013 (2016 for the U.S.A.). However, in order to avoid any significant number of missing data points, and to provide a more concise analysis, we only go as far back as 2000 in our study. We use three ways to compare real income inequality within and across countries – (a) measure the ratio of BMA of the bottom decile to the top decile of income distribution; (b) measure the BMA ratio of the 9th decile to the top one in order to gauge the concen- tration of income distribution; (c) to remove the effect of the magnitude of a country’s wealth, we calculate the Coefficient of Variation (COV) to measure the dispersion of the BMA across deciles, which is defined as the standard deviation divided by the overall average. For both measures (a) and (b), the smaller the number, the higher the inequality. And for measure (c), the higher the number, the higher the inequality. 3. Big Mac Real Income Inequality We look into the real income inequality in terms of Big Mac Affordability (BMA) of the 28 countries under study, and we define BMA as the total number of Big Mac burgers an average individual can afford in each country in each income decile per day. One might ponder over the reliability of these measures, especially COV, as measures of inequality against the one used most widely—the Gini coefficient. In Figure 1, we provide an overall comparison of COV and Gini coefficient for the countries in our data for the period of analysis (note that the data availability period is different for each country). As observed, the trends of both COV and Gini are similar for the countries in our analysis. Nordic countries are more equal countries and South American countries are mo re unequal. U.S.A and Russia are ranked in-between and their paths cross over the period of study meaning U.S.A has become more unequal while Russia during these years has gone the opposite way. We will focus on these countries in Section 4.2. To depict the details further and to rank the countries, we plot all four of these measures for 28 countries for the year 2010 in Figure 2 4 -- the year with the highest data availability. Panel 1 plots the ratio between the bottom to top decile, panel 2 has 9th to the top decile, panel 3 plots the COV and panel 4 has the Gini Coefficient. It is evident from this figure that, in general, both the Gini coefficient and COV rise and fall together, confirming a very high correlation. Also, note that the lower share of the bottom to top or 9th to top decile is associated with a lower COV and Gini coefficient, hence a higher income 4 We use 2011 data for Brazil and 2009 data for Hungary because 2010 data is not available for these countries. 30
Volume 21, Issue 1, 2021

inequality. This demonstrates the reliability of our inequality measures, and they are more
easily comprehensible.

Figure 1. Coefficient of Variation and the Gini Coefficient; Overall

Source: Luxembourg Income Study Database (LIS).

The purpose here is to provide measurements of inequality within each country as well
as the overall ranking of inequality of the countries in terms of the number of Big Macs
affordable. As evident from Figure 2, the ratio of the bottom to top decile’s affordability
for Denmark is one of the highest (19%), and it was as high as 24% in 1995. In other
words, the people in the bottom decile earned more than one fifth of what the people in
the top decile earned. During 2000-2013, this ratio was higher than 10% for Canada and
all the European countries in our analysis (it fell under 10% for Spain in 2010); for South
Korea, it was close to 10%.
For the U.S.A., this ratio has been declining steadily over 30 years. In 1986, the lowest
income decile earned 9% of income of the people in the top decile, whereas in 2016 the
ratio dropped to less than 7%. Although Russia and Uruguay started at a lower ratio than
the U.S.A., they crossed the U.S.A. in the mid- 2000s and on average their share is higher.
The Latin American countries (except for Uruguay) are doing worse in terms of the bot-
tom to top decile income ratio; people in the bottom decile earn less than 5% of the income
of people in the top decile. For South Africa, the ratio is the worst —at only 2 percent.

                                                                                            31
Review of Economic Perspectives Figure 2. Coefficient of Variation, Gini Coefficient, Share of Bottom to Top, and Share of the 9th to the Top Decile Source: Luxembourg Income Study Database (LIS). We also measure the gap between the 9th and the 10th deciles of individual countries, which can tell us about how far apart a country’s upper class is from the upper middle class. On average during 2000-2013, Canada, South Korea and all European countries’ 9th decile income holders made more than 60% of the 10th decile except for Poland and UK (59% and 57%, respectively). For Denmark, it had been as high as 72% in 2004. However, for the U.S.A., this ratio has not crossed 60% in the last two decades, and it fell down to 56% in 2016. 3.1. More Equal Versus Less Equal In this section, we focus on specific countries to expand our research on income disper- sion with a “within country” analysis. We first start with Denmark and Mexico. We choose Denmark because, with the exception of 2007 , where Slovenia outperforms it, 32
Volume 21, Issue 1, 2021

Denmark had the highest measure of the bottom to top decile shares for the years covered.
Denmark also is the second highest in the ranking of the 9th to top decile share after
Slovenia. Both the Gini coefficient and the COV for Denmark are among the lowest fo r
all the years in our analysis: 2000-2013. We pick this country to represent a “more equal”
country, and following the same logic, we pick Mexico to represent a “less equal” cou ntry.
Mexico’s bottom decile’s share of the top decile’s income and 9th to top decile are among
the lowest, while the Gini coefficient and the COV are among the highest, as can be seen
in Figure 2 in the previous section.5

Figure 3. Denmark and Mexico: Number of Big Macs Affordable the First, Second, Ninth,
and Tenth Decile.

Source: Luxembourg Income Study Database (LIS). The Big Mac Index is Extracted from
the Economist Database.

Figure 3 above provides the number of Big Macs affordable to the bottom 2 and top 2
deciles of the two countries mentioned above (Denmark and Mexico ) over time. For Den-
mark (left panel of the figure), the first decile in 2000 could afford 8.4 Big Mac burgers
per day while the top decile could afford almost 4.5 times of that —36.6 burgers. We also
provide the overall average, which is the average number of Big Macs affordable to the
individuals of the country regardless of income decile. The overall average BMA for
Denmark in 2000 was 19.3 burgers. These numbers are higher for all deciles and the
overall average when we look at 2013. However, the growth in the number of Big Macs

5We chose not to focus on Brazil, Colombia, Peru, or South Africa even though they appear as
more unequal countries because the data for Mexico is available over a wider range of time.
                                                                                               33
Review of Economic Perspectives for the top decile is larger (37% increase as opposed to 14% increase for the bottom decile and 24% increase in overall average), suggesting a widening of income inequality; the Gini coefficient and the COV both increase for this country over this period of time. Even then, Denmark is still one the most equal countries in our analysis. On the right panel of Figure 3, we look at these numbers for Mexico as opposed to Den- mark. In 2000, the bottom decile’s BMA was 0.67, less than even 1 burger daily. In 2012 (the last year of data availability for Mexico), the bottom decile still could not afford one burger per day. BMA increased by only 4% for this decile over 12 years. For the top decile, it went up by 2% and overall average went up by 8.5%. Mexico’s top decile BMA in 2000 was 17.2 and stayed almost the same over the next 12 years. Inte restingly during that period, the BMA of the 2nd and 3rd decile increased by almost 22% and increased by 20% and 18%, respectively, for the 4th and 5th decile. Although the COV was high for Mexico, the rising income of the middle class led to a fall of COV by 7% during 2000 - 2012 (the Gini coefficient also fell). Figure 4. Denmark and Mexico: Share of Each Decile to the Top Decile, Poor to Rich Source: Luxembourg Income Study Database (LIS). Figure 4 summarizes our comparison across the two countries in a snapshot by providing the ratio of every decile to the top one in 2013. As we can see, Denmark had a bigger ratio for all the deciles. For exam ple, the ratio of the first (bottom) to top decile for Den- mark was 19%, whereas for Mexico it was only 4%. Whereas the very first decile’s BMA in Denmark was almost one-fifth of the top decile’s, in Mexico that happens after the 5th decile. Denmark’s 6th decile’s BMA was 47% of that of their top one, whereas that ratio is achieved at the 9th decile in Mexico. 34
Volume 21, Issue 1, 2021

3.2. Growth and Inequality: U.S.A. Versus Russia
We now focus on the U.S.A. and compare its trend of income inequality with Russia,
because during the time of our analysis, whereas the U.S.A.’s income inequality kept
rising, Russia’s on the other hand kept falling. As per the U.S.A. Congressional Re -search
Service Report by Donovan et al. (2016), from the mid-1970s to 2000, income inequality
in the U.S.A. has risen significantly because the top quintile’s income increased more
rapidly than the other four; from 2000 to 2015, income inequality in -creased further be-
cause the top two quintiles’ income increased slowly whereas the bottom three quintiles’
incomes fell.
A comparison of the U.S.A. to Russia, given the increasing income inequality in the
U.S.A., proves to reveal an interesting picture. Although Russia’s COV (and Gini coeffi-
cient) was higher than that of the U.S.A. in the year 2000 , indicating higher in-come ine-
quality, it kept declining through the period of our study , putting its COV below the U.S.A.
by 2013. As shown in Figure 5, Russia’s BMA has increased dramatically in all deciles
and the overall average has also gone up. While Russia’s top decile’s BMA has increased
by 326%, the bottom decile’s BMA has increased by more than double of that, 692%.
The 2nd and 3rd deciles’ BMA increased by 560% and 532%, respectively. This obser-
vation follows the fact that Russia experienced an overall substantia l rise in GDP in this
period. GDP per capita almost doubled (from 6491$ to 11804$) over this period for this
country. Russia appears to be an example of the suggested decrease in inequality associ-
ated with an economic growth (Kuznets, 1955). As evident, Ru ssia has experienced a
more equal distribution of growth and Russia’s COV fell by 22%. Although, one should
note that our analysis is limited to income inequality and not wealth inequality.
The United States, on the other hand, has experienced the opposite , especially during and
after the Great Recession, 2007 to 2013. All income deciles suffered from the recession;
during this period, BMA decreased by 20% for the bottom and the top decile and some-
where between 22 to 24% for all other deciles, leading to a 22% decline in the overall
average BMA. However, the recovery from the recession came in a much more skewed
way. Whereas the BMA by the top decile increased by 3%, it declined by 1% for the
bottom decile leading to 1.4% rise in overall average BMA. From 20 00 to 2013, income
inequality in the U.S.A., as measured by COV and Gini coefficient, has gone up by almost
8.5%.
As Novokmet et al. (2018) depict, the major change that occurred in Russia between 1990
and 2015 is of course the transition from public to private property, and the challenge to
study the inequality in Russia is the fact that a small subset of households owns very
substantial offshore wealth and financial assets. Lyubimov (2017) revisits inequality in
Russia and believes that the rate of econom ic growth, although high for Russia, is not
high enough; therefore, the labor income would stagnate, whereas returns on the various
property (including real estate, financial assets, capital, and natural resources) would be
higher. He believes this can be explained better with Piketty (2014)’s work on rate of
return on capital versus rate of economic growth. According to (Kuznets, 1955), inequal-
ity declines at the stage of economic development when the majority of the population
moves from villages to cities. The majority of Russia’s population lives in cities; however,
the problem is that Russian cities are very unequal in terms of over-coming a local eco-
nomic crisis after the shutdown of Soviet era industrial facilities. As a result, as noted

                                                                                          35
Review of Economic Perspectives particula rly in the work by Zubarevich (2013), the level of inequality between region s remains high. Figure 5. US and Russia: Number of Big Macs Affordable the First, Second, Ninth, and Tenth Decile Source: Luxembourg Income Study Database (LIS). The Big Mac Index is Extracted from the Economist Database. We now take a closer look at the United States. Figure 6 provides the share of all deciles to the top decile from 1986 to 2016 as well as the number of Big Mac burgers affordable to each decile over these years. The first thing we can confirm in this graph is that the Gini coefficient and the COV both follow an upward trend suggesting an increase in in- come inequality during the three decades. What seems to be the underlying reason is the drop in the share of lower, middle and upper-middle classes’ income to the uppermost class (top decile). Over the three decades, the Big Mac Affordability, which is a measure of real income in some sense, has declined by more than 10 percent for all the bottom nine deciles,6 whereas it has increased only for the top decile, that too by more than 5 percent! Next, we divide the timeline into three sections – before the recession (1986-2007), im- mediate response to the recession (2007-2010), and long run response to the recession (2010-2016). Even though before the recession, all deciles and specifically the middle- income deciles, were experiencing a growth in their affordability and income overall, we 6 It has declined by more than 15 percent for the bottom 7 deciles from 1986 to 2016. 36
Volume 21, Issue 1, 2021

still have an increase in the COV and income inequality. This is a result of the rapidly
growing real income of the top decile, causing a decline in the share of the middle-income
deciles to the top. In the immediate aftermath of the recession (2007 - 2010), there is a
drop in all income deciles. However, the drop is more severe for the top decile, hence the
immediate drop in income inequality. After 2010, the top decile recovers fast er, and the
share of all deciles to the top decile follows a downward trend, and we have an increase
in the income inequality.
So, in the case of the U.S.A, contrary to Kuznets (1955), although in an immediate re-
sponse to the recession, we observe a small drop in inequality associated with a downfall
in economic growth; over the whole decade, higher GDP has not been associated with
lower inequality.
The underlying features behind this rising real income inequality in the U.S.A. can be
summarized as follows: (1) changes in labor income (wages and salaries), (2) changes in
capital income (capital gains, dividends and business income), and (3) changes in taxes.
As explored in Hungerford (2011), changes in capital gains and dividends were the largest
contributors to the increase in the overall income inequality. Taxes were less progressiv e
in 2006 compared to 1996 (the period under study) and consequently, tax policy also
contributed to the increase in income inequality between 1996 and 2006.

Figure 6. US Shares of Each Decile to the Top Decile on the Left. Number of Big Mac Burg-
ers Affordable to Each Decile on the Right, Over Years (1986 to 2016).

On the same note, Piketty (2014) attributes high inequality to the rise of high -income
earners. Since the 1970s, though, the U.S. has seen a sharp and unparalleled increase in
the percentage of income going to the top 1% and especially 0.1%. This has not been

                                                                                        37
Review of Economic Perspectives induced by the capital and inheritance dynamics at the heart of Piketty’s story. He attrib- utes it instead to the rise of what he calls “super managers”; and he as well proposes that their skyrocketing pay is mainly the product of sharp declines in top marginal tax rates. Piketty et al. (2014) discuss that the rise in the top-percentile income share in 13 countries under the study was almost perfectly correlated with declines in top marginal tax rates in those countries. 4. Conclusion In this paper, we explored the household income of 28 countries over the period 2000 to 2013. Using the Big Mac index, we measured the Big Mac Affordability (BMA) of indi- viduals belonging to different income distribution deciles in these countries. We provided a comparison of income inequality across countries by looking into BMA and measuring the Coefficient of Variation as a measure of dispersion and the share of different deciles to the top. We looked more into a few of the most interesting countries in our analysis— Denmark, Mexico, Russia and the U.S.A.—in order to have explanations for the wide range of income inequality we observed in the previous section in the 28 countries. We compared Denmark and Mexico as representatives of the “more equal” and “less equal” countries, and we found a visible difference in the share of each decile to the top decile of income between these countries. Denmark, as a representative “more equal” country, was experiencing an increase in the income inequality , whereas Mexico as a representative “less equa l” country, was experiencing a downward trend of income ine- quality during the period of our analysis. We then focused on the United States and also studied how they compared to Russia, a country that was experiencing economic growth and declining income inequality during the period of study. The wage income inequality in Russia was correlated inversely with its growth. In com- parison, in the U.S.A., the overall growth and wage income inequality have been posi- tively correlated. For a short period of time during the recession of 2007-09 in the U.S.A., a drop in the income inequality was observed, but then it increased back again between 2010-2016 with a rapid increase in the top decile’s affordability as opposed to all other deciles. Throughout this study, we measured real income using the price index of a market basket consisting of only one good—the Big Mac burger by McDonald’s, which gave us the opportunity to have interesting observations. Although, it has been argued that there is a significant difference between the consumption basket of non-durable goods for the poor and the rich. Broda and Romalis (2009) find that during the years spanning 1994 -2005, the price of non-durable goods that were consumed disproportionately more by the poor had been declining. Bergh and Nilsson (2014) explain that, due to widening inequality, as the number of poor rises, the market for products targeted towards them gets larger and more profitable. Because of a more price-elastic demand of low-income people, prices for these products fall, leading to increased affordability by the poor. By looking at the prices of Big Mac burgers only, our current study has excluded this possibility, though we leave this job for our future work. Disclosure statement: No potential conflict of interest was reported by the authors. 38
Volume 21, Issue 1, 2021

References
ATAL, V., (2014). The Big Mac Index and real-income disparity. Journal of Business &
Economics Research (Online), 12(3):231.
ATKINSON, A. B., (1996). Income distribution in Europe and the United States. Oxford
Review of Economic Policy, 12(1), 15-28.
BAILY, M. N., BOSWORTH, B. P., (2014). US manufacturing: Understanding its past
and its potential future. Journal of Economic Perspectives, 28(1), 3-26. DOI:
10.1257/jep.28.1.3
BERGH, A., NILSSON, T., (2014). When more poor means less poverty: On income
inequality and purchasing power. Southern Economic Journal, 81(1):232–246. DOI:
10.4284/0038-4038-2013.008
BLAU, J. R., BLAU, P. M., (1982). The cost of inequality: Metropolitan structure and
violent crime. American sociological review, 114-129. DOI: 10.2307/2095046
BRODA, C., ROMALIS, J., (2009). The welfare implications of rising price dispersion.
University of Chicago Mimeo.
BOURGUIGNON, F., (1979). Decomposable income inequality measures. Economet-
rica: Journal of the Econometric Society, 901-920. DOI: 10.2307/1914138
COWELL, F., (2011). Measuring inequality. Oxford University Press.
DANIELE, V., MALANIMA, P., (2017). Regional wages and the north-south disparity
in Italy after the unification. Rivista di storia economica 33(2), 117-158.
DONOVAN, S. A., LABONTE, M., DALAKER, J., (2016). The US income distribution:
Trends and issues. CRS Report, US Congressional Research Service, Washington, DC.
ECONOMIST, T. (2019). The Big Mac Index. http://bigmacindex.org/2012-Big-Mac-In-
dex.html [Accessed: Jan 2019].
FEENSTRA, R. C., INKLAAR, R., TIMMER, M. P., (2015). The next generation of the
Penn World Table. American economic review, 105(10), 3150 -82.
GHAREHGOZLI, O., ATAL, V., (2020a). “Big mac affordability” and real-income ine-
quality across countries. Applied Economics Letters, 27(16), 1352-56. DOI:
10.1080/13504851.2019.1679342
GHAREHGOZLI, O., ATAL, V., (2020b). Revisiting the gender wage gap in the United
States. Economic Analysis and Policy. 66, 207-216.
HUNGERFORD, T. L., (2011). Changes in the distribution of income among tax filers
between 1996 and 2006: The role of labor income, capital income, and tax policy.
JOHNSON, S., LARSON, W., PAPAGEORGIOU, C., SUBRAMANIAN, A., (2009). Is
newer better? The Penn World Table growth estimates. VoxEU. org, 7.
KRAVIS, I. B., HESTON, A. W., SUMMERS, R., (1978). Real GDP per capita for more
than one hundred countries. The Economic Journal, 88(350), 215-242. DOI:
10.2307/2232127

                                                                                   39
Review of Economic Perspectives KUZNETS, S., (1955). Economic growth and income inequality. The American economic review, pages 1–28. LIS (2019). LIS Web Tabulator. http://www.lisdatacenter.org [Accessed: Jan 2019]. LOVERIDGE, S., PAREDES, D., (2018). Are rural costs of living lower? evidence from a Big Mac Index approach. International Regional Science Review, 41(3):364–382. DOI: 10.1177/0160017616650488 LYUBIMOV, I., (2017). Income inequality revisited 60 years later: Piketty vs Kuznets. Russian Journal of Economics, 3(1):42–53. DOI: 10.1016/j.ruje.2017.02.003 MILANOVIC, B., (2016). Global inequality: A new approach for the age of globalization. Harvard University Press. MILANOVIC, B., ROEMER, J. E., (2016). Interaction of global and national income inequalities. Journal of Globalization and Development, 7(1):109–115. DOI: 10.1515/jgd-2016-0023 NOVOKMET, F., PIKETTY, T., ZUCMAN, G., (2018). From soviets to oligarchs: Ine- quality and property in Russia 1905-2016. The Journal of Economic Inequality, 16(2):189–223. DOI: 10.1007/s10888-018-9383-0 OISHI, S., KESEBIR, S., DIENER, E., (2011). Income inequality and happiness. Psy- chological science, 22(9), 1095-1100. DOI: 10.1177/0956797611417262 PIKETTY, T., (2014). Capital in the 21st century. PIKETTY, T., SAEZ, E., (2003). Income inequality in the United States, 1913–1998. The Quarterly journal of economics, 118(1), 1-41. PIKETTY, T., SAEZ, E., STANTCHEVA, S., (2014). Optimal taxation of top labor in- comes: A tale of three elasticities. American Economic Journal: economic policy, 6(1):230–71. SAN VICENTE PORTES, L., ATAL, V., (2014). The Big Mac Index: A shortcut to inflation and exchange rate dynamics? price tracking and predictive properties. Interna- tional Business and Economics Research Journal, 13(4):751–756. SUMMERS, R., HESTON, A., (1988). A new set of international comparisons of real product and price levels estimates for 130 countries, 1950 –1985. Review of income and wealth, 34(1), 1-25. DOI: 10.1111/j.1475-4991.1988.tb00558.x SUMMERS, R., HESTON, A., (1991). The Penn World Table (Mark 5): an expanded set of international comparisons, 1950–1988. The Quarterly Journal of Economics, 106(2), 327-368. DOI: 10.2307/2937941 HESTON, A., SUMMERS, R., (1996). International price and quantity comparisons: po- tentials and pitfalls. The American economic review, 86(2), 20-24. WILKINSON, R. G., (2002). Unhealthy societies: the afflictions of inequality. Routledge. ZUBAREVICH, N., (2013). Four Russia: Human potential and social differentiation of Russian regions and cities. In Russia 2025, pages 67–85. Springer. 40
You can also read