A SMART INFORMATION SYSTEM FOR PASSENGERS OF URBAN TRANSPORT BASED ON IOT
←
→
Page content transcription
If your browser does not render page correctly, please read the page content below
electronics
Article
A Smart Information System for Passengers of Urban Transport
Based on IoT
Hugo Estrada-Esquivel *, Alicia Martínez-Rebollar                       , Pedro Wences-Olguin, Yasmin Hernandez-Perez
and Javier Ortiz-Hernandez

                                          TecNM/CENIDET, Computer Science Department, Cuernavaca 62490, Morelos, Mexico;
                                          alicia.mr@cenidet.tecnm.mx (A.M.-R.); d15ce096@cenidet.tecnm.mx (P.W.-O.);
                                          yasmin.hp@cenidet.tecnm.mx (Y.H.-P.); javier.oh@cenidet.tecnm.mx (J.O.-H.)
                                          * Correspondence: hugo.ee@cenidet.tecnm.mx

                                          Abstract: Several developed countries have implemented smart systems for public transport that provide
                                          mobility services for citizens. Most of these systems use special infrastructures to determine the location
                                          of citizens and public buses. However, the implementation of these systems does not take into account
                                          the poor infrastructure of developing countries. In Mexico, Urban Passenger Transport has insufficient
                                          transport units to meet the demand of passengers who move throughout the day, and these do not
                                          consider hardware infrastructure. Our solution is focused on inexpensive devices that are accessible to
                                          citizens, such as mobile phones. In this research work, a smart information system for passengers of
                                          urban transport is presented that allows passengers to know the expected arrival times and also to know
                                          the availability of seats on the bus that is heading towards their position. The solution was evaluated
                                          with real routes, and the results are promising for a pilot project to be put in practice.

                                   Keywords: arrival time; urban passenger transport; passenger counter; Internet of Things
Citation: Estrada-Esquivel, H.;
Martínez-Rebollar, A.;
Wences-Olguin, P.; Hernandez-Perez,
Y.; Ortiz-Hernandez, J. A Smart           1. Introduction
Information System for Passengers of
                                                One of the most relevant issues in cities is mobility. The current situation of traffic
Urban Transport Based on IoT.
                                          congestion in cities leads to several health problems derived from pollution, noise, and,
Electronics 2022, 11, 834. https://
doi.org/10.3390/electronics11050834
                                          obviously, the great stress in drivers who spend several hours in traffic to reach their
                                          destination [1]. Several developed cities have created smart mobility systems as new
Academic Editor: Prasan                   solutions to solve this problem. The implementation of systems of this kind involves
Kumar Sahoo                               the development of software and hardware infrastructure in the city. These developed
Received: 11 December 2021                countries have created passenger information systems for bus users that indicate the real-
Accepted: 1 March 2022                    time bus location, and they have also developed several apps that provide this information
Published: 7 March 2022                   directly to the smartphones of the bus users.
                                                However, in many provinces or developing cities, there is a lack of solid human and
Publisher’s Note: MDPI stays neutral
                                          physical infrastructure to implement intelligent transport projects. The main problem with
with regard to jurisdictional claims in
                                          the public transport system in Mexico is the lack of appropriate mechanisms to manage the
published maps and institutional affil-
                                          large number of means of transportation, such as buses, metrobuses, or metro [2,3]. In the
iations.
                                          Mexican context, there are not enough public buses to cover the enormous demand for trips
                                          around the city every day. In addition, the buses are in a very bad condition. Therefore,
                                          it is very difficult to assume that buses have the needed infrastructure to publish their
Copyright: © 2022 by the authors.         real-time location to their users. In Mexico, there are only a few examples of intelligent
Licensee MDPI, Basel, Switzerland.        transportation systems that help users’ mobility. In this scenario, intelligent mobility
This article is an open access article    solutions must take into account the context of cities with limited infrastructure that have
distributed under the terms and           computational resources of the users that need to provide effective solutions.
conditions of the Creative Commons              Solutions are needed that use the common resources of passengers and bus drivers,
Attribution (CC BY) license (https://     such as smartphones. It is possible to take advantage of the several sensors of recent
creativecommons.org/licenses/by/          smartphones to determine location and manage remote communication with web servers.
4.0/).

Electronics 2022, 11, 834. https://doi.org/10.3390/electronics11050834                                   https://www.mdpi.com/journal/electronics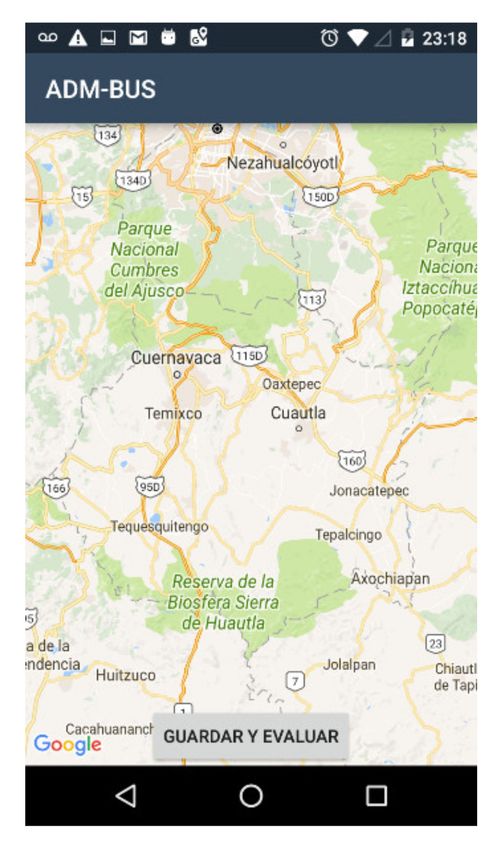
Electronics 2022, 11, 834                                                                                           2 of 24

                            Moreover, cheap technological solutions are required to determine the available seats on
                            each public bus.
                                 This research work presents an intelligent system that improves the mobility of pas-
                            sengers of urban transports by allowing the users to know the arrival time of buses that
                            are close to their current bus stop. The proposed solution also permits monitoring the
                            availability of seats on public buses using in an electronic counter. The objective of our
                            research is to exploit common resources of the Mexican population, such as smartphones.
                            The solution could also be easily generalized in developing countries.
                                 The intelligent system has been implemented on a smartphone, which obtains the GPS
                            (Global Positioning System) position of public transport drivers and calculates the arrival
                            time of buses that are close to the user’s bus stop. The proposed system also calculates the
                            seat availability on monitored buses using a low-cost electronic device that was developed
                            to count the number of passengers traveling on the bus. This work presents a system for
                            smart mobility and also the experimentation of the software system that implements the
                            proposed approach. The experimentation demonstrates the potential usefulness of the
                            proposed mobility system in practice in developing cities.
                                 The paper is organized as follows: Section 2 presents the background and related
                            work; Section 3 shows the smart information system; Section 4 shows the implementation
                            of the smart information system; Section 5 presents the test and results obtained; Section 6
                            presents the scientific contributions of the research work and finally, Section 7 presents the
                            conclusions and future work.

                            2. Background and Related Work
                            2.1. Smart Cities and the Internet of Things
                                  A smart city is an urban development that integrates Information and Communication
                            Technologies and the Internet of Things (IoT) technology in a secure fashion to manage a
                            city’s assets. The smart city can be defined as a city that uses information and communi-
                            cation technologies to improve the critical infrastructure of the city and also to make the
                            public services for citizens more efficient [4].
                                  A Smart City uses technology to improve the quality of life and the accessibility of
                            its inhabitants. Additionally, it ensures sustainable economic, social, and environmental
                            development. A smart city allows citizens to interact with it in a multidisciplinary way and
                            also permits the city to adapt to their needs in real time [5]. The concept of a Smart City
                            requires the implementation of mechanisms to know the real time context of the services
                            provided to the citizens. For example, in the case of a smart mobility system, such as the
                            one proposed in this research work, the users need to know the location of buses in real
                            time in order to improve the times used to reach a destination.
                                  One of the technologies that has driven the development of smart cities is the Internet
                            of Things. There are different definitions for the concept of the Internet of Things, however,
                            one of the most accepted definitions is the one provided by the European Research Cluster
                            on the Internet of Things (IEC). It defined the Internet of Things as a dynamic global net-
                            work infrastructure with self-configuring capabilities based on standard and interoperable
                            communication protocols where physical and virtual “things” have identities, physical
                            attributes, and virtual personalities, use intelligent interfaces, are seamlessly integrated
                            into the information network, and often communicate data associated with users and their
                            environments. This enables objects to detect their context and to communicate with others
                            in order to interact with the context.

                            2.2. Related Work
                                We present a review of the related works for intelligent transportation systems for
                            smart cities which describes the main characteristics for each work.
                                In the works of Gammer [6], a smart transport system was implemented using QR code
                            (Quick Response code) technology, which is a two-dimensional barcode which is widely
                            used for multiple purposes. This research was implemented in the city of Southampton, in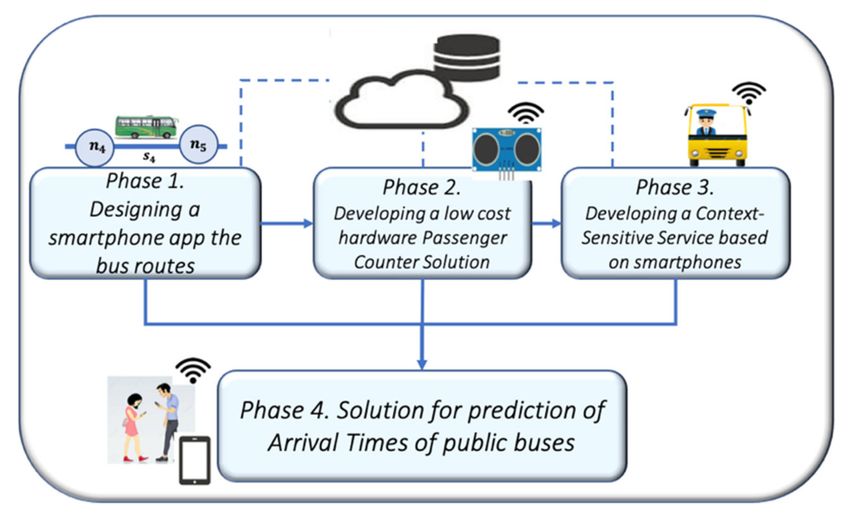
Electronics 2022, 11, 834                                                                                              3 of 24

                            which QR code posters were printed and placed at 44 bus stops. Each bus stop was fitted
                            with a poster containing a unique QR code.
                                  The purpose of printing the QR code posters is so that users can scan these codes
                            with their smartphones to be redirected to a web page that will display the times of arrival
                            of the buses. This information is taken from the Southampton traffic control center. The
                            authors have proposed two types of posters: a simple one with minimal text, and a more
                            comprehensive one. This was done in order to understand what level of instruction is
                            needed for QR code use. This research work proposes a mechanism to monitor the number
                            of hits at each stop via the website. The study revealed that there was very little variation
                            in the use of QR codes at stops by day of the week or between peak and inter-peak times;
                            however, there were variations by geographical area.
                                  In the works of Yu and Lam [7], a model for predicting bus arrival times is proposed
                            to predict bus arrival times at the same bus stop but with different routes. In this scenario,
                            bus running times of multiple routes are used for predicting the bus arrival time of each of
                            these bus routes. Yu and Lam have explored several techniques to predict the arrival times:
                            a support vector machine (SVM), an artificial neural network (ANN), a k nearest neighbor
                            algorithm (k-NN), and linear regression (LR). They found that the proposed models are
                            more accurate than the models based on the bus running times of a single route. They also
                            have found that a support vector machine (SVM) is the best model for predicting the bus
                            arrival times with multiple routes.
                                  In the research work of Li, Gao and Wei [8], an analysis of single-step and multi-step
                            prediction models is presented as an alternative for bus arrival time prediction. In that
                            work, three different steps are proposed to achieve the prediction of the arrival time. In the
                            first step, the Traffic Delay Jitter Patterns (TDJP) are mined by the K nearest neighbor and
                            K-means in the historical traffic time data. In the second step, a short-time prediction is
                            proposed by using a real-time adjusted Kalman filter with a modification of historical TDJP.
                            Finally, the third step is a long-term prediction time based on a Markov historical transfer
                            model to conduct the multi-step prediction.
                                  As a result, Li and Gao found that the single-step prediction model performs better in
                            accuracy and efficiency than the short-term traffic flow prediction and dynamic Kalman
                            filter. They also found that a multi-step prediction provides a higher level of veracity and
                            reliability in travel-time forecasting than short-term traffic flow and historical traffic pattern
                            prediction models.
                                  In the works of Zhou, Zheng and Li [9], a bus arrival time prediction system is
                            presented that is based on bus passengers’ participatory sensing. The proposed approach
                            uses data provided by the mobile phones of bus passengers to collect the information of
                            the surrounding environmental context and thus estimate the bus traveling routes and
                            predict bus arrival time at various bus stops. The system collects the identifiers of nearby
                            cell towers and sends that information to a server. With this solution, the authors rely
                            on the collaborative effort of the participating users in order to be independent from the
                            bus operating companies. A prototype was developed with several types of Android
                            mobiles phones, that was used at a university campus and on Singapore public buses over
                            a 7-week evaluation period. The results of the evaluation of the approach indicated a higher
                            prediction accuracy compared to GPS solutions.
                                  Another work is the one proposed by Wang, Zuo and Fu [10], in which the authors
                            propose the combination of historical data and real-time situation information to predict
                            bus arrival time. The solution proposed by Wang and Zuo is composed of two main steps.
                            In the first step, a Radial Basis Function Neural Networks (RBFNN) model is used to learn
                            and approximate the nonlinear relationship in historical data. In the second step, an online-
                            oriented method is used to adjust to the actual situation by modifying the preliminary
                            prediction of RBFNN. The evaluation performed by the authors made on a bus route
                            in Dalian indicates that the combination of RBFNN and online adjustment has a better
                            prediction performance than the Multiple Linear Regression model, BP Neural Networks
                            and RBFNN without online adjustment.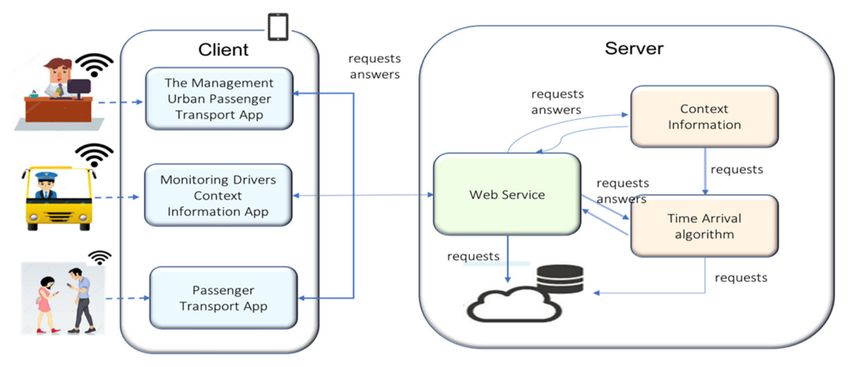
Electronics 2022, 11, 834                                                                                             4 of 24

                                  The research work of Edison [11] presents a case study that addresses the perception
                            of the waiting time of the passengers that use a system in real time versus those that do
                            not use any system in real time. The authors proposed the OneBusAway transit traveler
                            information system, which provides real-time next-bus countdown information for King
                            County Metro users in Seattle via a website, telephone, text-messaging, and smart phone
                            applications. The objective of that research work was to know the perception of people
                            using the system compared to the actual time they have waited.
                                  In the research work of Anudeep [12], an IoT system is presented to provide intelligent
                            real-time passenger information. The system keeps the passenger updated with information
                            about the current location of buses, estimated arrival time, and vacant seats. To provide this
                            information, a hardware prototype was developed using NodeMCU with a GPS module,
                            which is the tracker device that is responsible for communicating the bus location. The data
                            coming from the electronic device is sent to the Cloud using MQTT protocol. Additionally,
                            an Android application was developed to obtain data from the cloud and show it to the
                            final user.
                                  The research work of Barczak [13] analyzes how the residents of the Szczecin Metropoli-
                            tan area perceive the use of telematics solutions in connection with the launch of the
                            Szczecin Metropolitan Railway. In that case, modern infrastructure is provided by the city,
                            for example, electronic information boards show the number of the tram or bus line, the
                            course direction, and the waiting time for arrival. If there are no electronic boards, the
                            passengers can use the virtual timetable by scanning the QR code that displays the arrival
                            time of the next buses. The results of the research indicate that people living in the area near
                            the Szczecin Metropolitan Railway have a positive opinion of the application of telematic
                            solutions in the activities of the Szczecin Metropolitan Railway.
                                  In the work of Baires [14], a Wireless Sensor Network for an Intelligent transportation
                            system was developed using a Raspberry Pi. The sensing layer of the developed device has the
                            goal of detecting if mechanical or environmental stresses during bus rides could be harmful
                            to the device or to its performances. To do that, the device uses accelerometric, temperature,
                            and relative humidity sensors. This information is used to alert the drivers. The proposed
                            cost-effective WSN node was employed and tested to transmit messages and videos.
                                  The work of Alam [15] presents a survey of Cloud-Based IoT Applications for Smart
                            Cities considering multiple domain applications, including user mobility. The paper found
                            several research areas in which IoT provided novel solutions. Some examples provided
                            by the author are: vehicle circuit systems and wireless connections for smart dispatch
                            centers, systems for fares and mobile ticketing, communication among passengers and
                            management, vehicle monitoring, and smart parking where sensors can be used to send
                            messages to the connected devices to find a parking space.
                                  In the work of Sugur [16], a smart bus stop-passenger information system was de-
                            veloped in order to enable administrators to effectively monitor the public transportation
                            system and also to enable the people who utilize this system to simultaneously observe the
                            information about the location and status of those vehicles. In the proposed solution, em-
                            bedded mini-computer-based systems and digital monitors were used to instantly present
                            the information related to travel and transportation on the public transportation buses. The
                            instant movement information of the vehicle was transferred to the central server through
                            a GPS module that is integrated in the embedded computer systems and web services.
                                  In the research work of Thair [17], a mobile application was proposed to help users
                            to find public transportation and arrival times. This system provides information to
                            determine the nearest buses to a user, the real-time location of buses on a Google map to
                            help passengers track buses in real time, the arrival time of buses, and the speed of the
                            buses. To do that, a specific electronic device was developed using a microcontroller with a
                            built-in Wi-Fi module combined with a GPS sensor which is installed inside the buses. GPS
                            is used to obtain a real-time bus location as well as speed, direction, etc. All of the data
                            collected by ESP32 is transferred to a Blynk server through Wi-Fi, and then displayed on
                            the mobile application.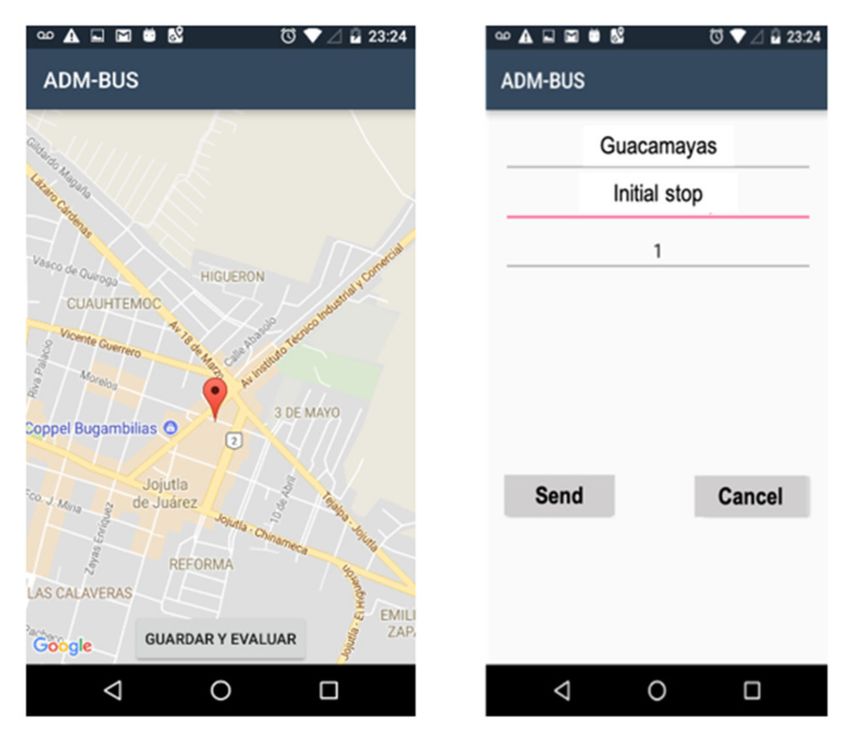
Electronics 2022, 11, 834                                                                                             5 of 24

                                  In the research work of Vakula [18], a system is presented where the current position
                            of the buses and the arrival and departure times of the buses can be communicated to
                            the passengers via the display boards in the bus terminus or via the app installed on a
                            smartphone. The author proposed the use of a Raspberry Pi3 with a GPS and a data sensor
                            device that needs to be installed on the bus. The device also manages the passenger count.
                                  The research works in the literature make clear the need for solutions to improve the
                            travel experience of bus users. The IoT and the Cloud are two technologies that are widely
                            used in research environments to generate new solutions for mobility. One of the current
                            trends is the development of solutions to predict the arrival times of buses. The state of
                            the art has demonstrated the real usefulness of this trend in developed countries, where
                            hardware infrastructure in cities enables the citizens to know the current position of public
                            buses and, therefore, provide a prediction of the arrival time. These research works reveal
                            several approaches that use adhoc electronic components to register the location of the bus.
                            Citizens in these developed countries use these mobility systems normally to manage their
                            trips in cities. However, this is not the normal scenario in developing countries without local
                            infrastructure in buses and bus stops and where bus route schedules are chaotic. We have not
                            found any research works in the literature to register the location of buses using the sensors of
                            smartphones of bus drivers taking advantage of the mobile phone data network.

                            3. The Proposed Smart Information System
                                 Today, the public transport system in Mexico does not have the functionality to provide
                            information to determine the arrival times of buses or to know if there are available seats
                            on the next bus that is arriving to the user’s bus stop. This information is very relevant in
                            Mexican cities where millions of users a day must be mobilized. The proposed solution is
                            based on the fact that the current public buses do not have any kind of sensor or mechanism
                            to determine the location of the bus.
                                 The approach uses the resources of the bus drivers’ smartphones to collect context
                            information about public transport. This information is used by the algorithms to determine
                            the arrival time to the next bus stop. In addition, a small electronic device was developed
                            to record the users getting on/off of the bus. The users of public transport can use the web
                            application developed in this project to receive the information about the arrival time of
                            the next bus coming to the bus stop where the user is located and also to know the number
                            of available seats on the coming bus. Figure 1 shows the conceptual architecture of the
                            proposed system that predicts the arrival times of buses and also determines the available
                            seats on that bus.

                            Figure 1. Overview of the proposed solution.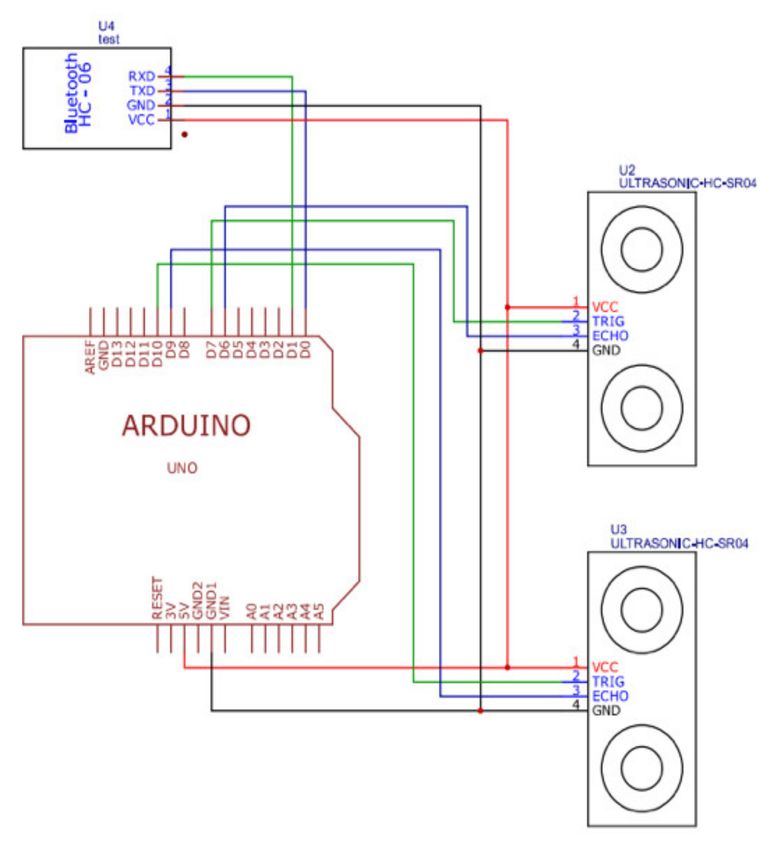
Electronics 2022, 11, 834                                                                                           6 of 24

                                 The system architecture is composed of four main phases: 1. The Route Design phase
                            to design a specific route in the city and to indicate its corresponding bus stops. 2. The
                            Passenger Counter Solution Development phase to propose a small device to manage the
                            users getting on/off of the bus. 3. The Context-Sensitive Service development phase to
                            obtain, preprocess, and send the information about Urban Passenger Transport. 4. The
                            Prediction of Arrival Time Solution phase to provide a software solution that enables
                            the user to visualize the predicted arrival time of buses and also the seats available on
                            that bus. The context information produced by the bus driver’s smartphones and the
                            ultrasonic counter device is sent to the cloud using an IoT approach, where devices capture
                            information and send it to the cloud for further analysis.
                                 (A) Phase 1: Design of Public Bus Routes
                                 The first phase of the proposed methodology consisted of the design of the routes of
                            the public transport buses. The objective is to define the routes and the bus stops of the
                            public transport agencies that need to be monitored using the proposed system. This is
                            done using GPS location points on the route. It is important to point out that only a small
                            number of cities in Mexico have these bus routes specified in the GTFS (General Transit
                            Feed Specification), which indicates the routes of public transport, the bus stops, and the
                            frequency of buses at each bus stop. In that situation, an alternative method needs to be
                            used to indicate the route and the corresponding bus stops.
                                 One of the aspects taken into account to design the route is that only in a few cases
                            is an urban passenger transport route symmetrical, leaving from point A to point B and
                            returning, following the same streets in the city but in the opposite direction. This is the
                            reason why, in this work, a route is considered to be composed of two journeys: one journey
                            starting from bus stop A to bus stop B and another journey starting from bus stop B to
                            return to the original bus stop A (Figure 2).

                            Figure 2. An example of an asymmetrical bus route.

                                  Therefore, to design a specific route, two routes must be created with their correspond-
                            ing bus stops for each route direction. The routes have been designed as directed graphs,
                            where nodes are used to represent bus stops and edges are used to represent the distances
                            between one bus stop and another. This module uses the API of Google maps and extends
                            it for the definition of each bus stop for a specific route in the city.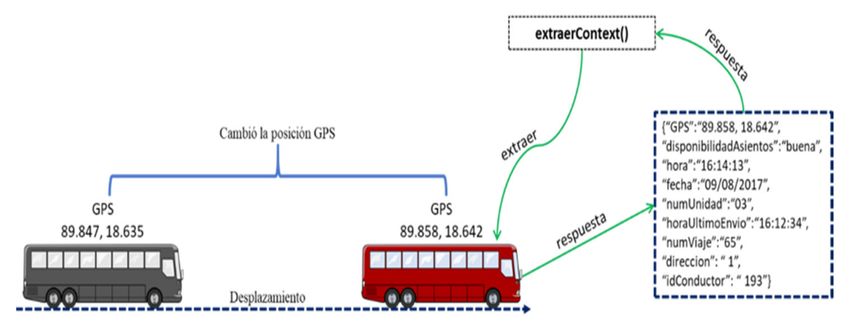
Electronics 2022, 11, 834 7 of 24
In the first step, the GPS position of each one of the bus stops need to be captured.
This is done as follows:
• The proposed application is used to show the map of the Google Maps app on a
Smartphone. The application makes use of the “Support-MapFragment” class. The
geographical location where the users want to design a route is indicated on the map
presented in the smartphone application. The specific method “moveCamera” is used
to trace the path of the route.
• The proposed application developed for smartphones obtains the Global Position
System (GPS) coordinates (latitude, longitude) where a bus stop is established on the
map. This process must be completed for all of the bus stops on the route.
In the second step, a directed graph is created to represent the bus route. This is done
as follows:
• The variability of the longitude and latitude of each bus stop (with the exception of
the first bus stop) is analyzed and defined. Variability is defined as the increase or
decrease in latitude and/or longitude with respect to the previous location.
• The bus stops are identified by assigning a position on the route and a name for the
bus stop.
• The defined bus stops are drawn on the map and are also stored in a database with a
unique ID.
The accuracy of the solution depends on the design of a well-defined route. In most
cases, a route in the city is not completely straight and it is likely to have several curves.
Therefore, care needs to be taken to define the straight and curved sections of the route. To
do this, when designing the route, additional GPS points need to be assigned on the route
in order to make a better match between the graphical route designed in the software app
and the real bus route in the city. Figure 3 shows an example of a well-designed route and
an example of a poorly-designed route.
Figure 3. Example of a well-designed route and a poorly designed route.
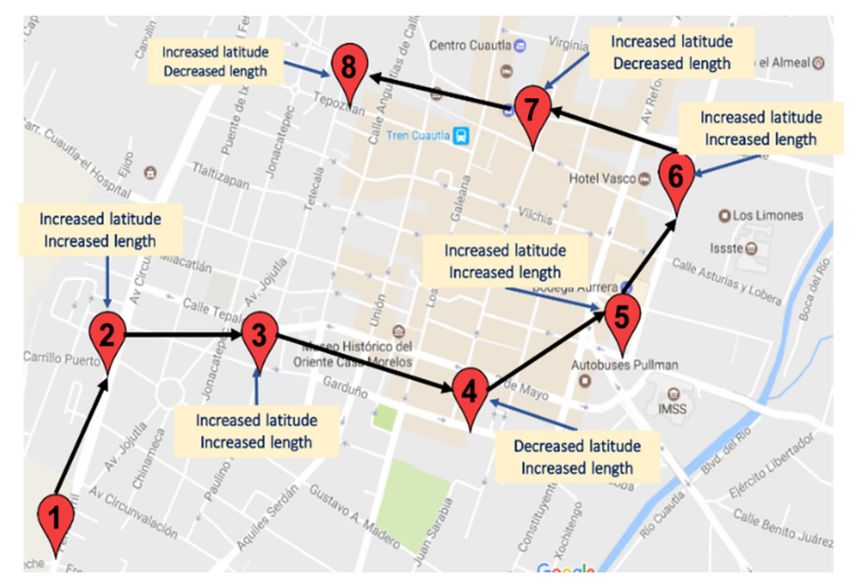
The variability is used by the context-aware service to determine the segment where
the buses are running on a route and the correct direction on the route. The GPS location of
the buses is used to calculate the arrival time at the bus stops. Figure 4 shows an example
of the use of variability in GPS latitude/longitude to determine the current direction of a
bus on the route.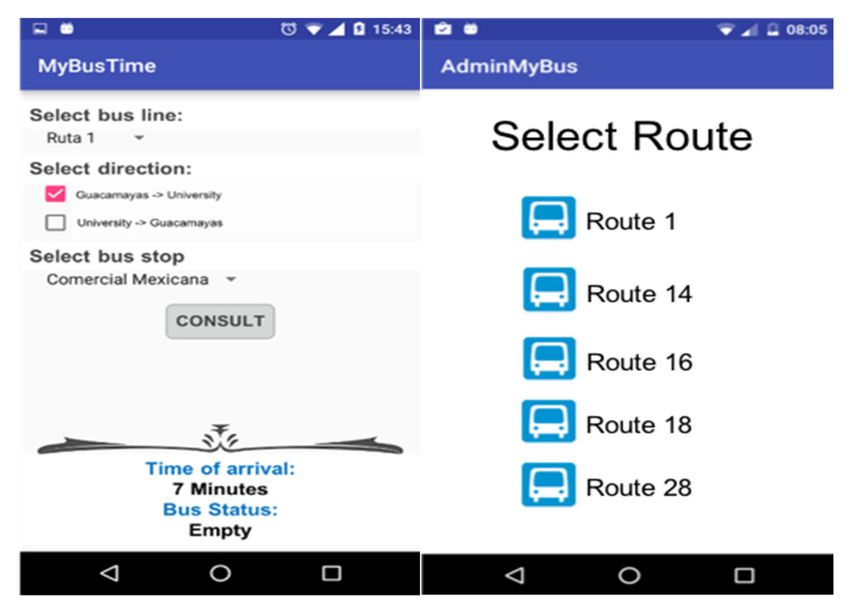
Electronics 2022, 11, 834                                                                                            8 of 24

                            Figure 4. Example of variability of GPS.

                                   (B) Phase 2. Passenger Counter Solution Development
                                   In spite of the high demand for public transport services in Mexico, the users of public
                            transport currently do not have information about seat availability on public buses, even
                            though the service is used by a large number of users throughout the day. In order to
                            provide a specific solution for this problem, an electronic device has been developed in this
                            work to count the people getting on/off the buses. The device, which is called “USoniCont”,
                            allows the system to register the number of passengers getting on the bus, as well as the
                            number of passenger getting off the bus. This information is used by the system to calculate
                            the availability of seats on a bus.
                                   It is important to point out that some recent buses in developed countries have devices
                            to count passengers boarding the bus, however, these proprietary systems are used by
                            private companies to calculate the number of people boarding the bus, and, therefore,
                            to calculate the total amount of money that must be delivered by the bus driver. This is
                            because today it is very rare to have buses with devices that automatically charge the cost
                            of the travel ticket. The information generated by the counter devices does not produce
                            real-time data and is only accessible by the companies that manage the buses. We designed
                            the ultrasonic counter to provide information directly to the smartphone of the bus driver
                            and then to the cloud.
                                   The design of the ultrasonic counter was made taking into account the characteristics
                            of commercial products on the market to register the number of people on a bus. Our
                            passenger counter is composed of the following elements: (i) two ultrasonic sensors, which
                            are responsible for detecting a passenger boarding or getting off of the bus; (ii) a Bluetooth
                            module which is responsible for the communication with the smartphone of the bus driver;
                            (iii) and an Arduino-based device which is responsible for processing the data coming from
                            the ultrasonic device. It is also responsible for sending the “getting on/off” events to the
                            smartphone of the bus driver through Bluetooth. The ultrasonic sensors were aligned side
                            by side with a separation of 15 cm. The sensors were configured to measure a maximum
                            distance of 80 cm, which is equivalent to the width of the door of the bus. All of the
                            information captured from the sensors is processed using an Arduino device. Figure 5
                            presents the circuit diagram of the ultrasonic counter device.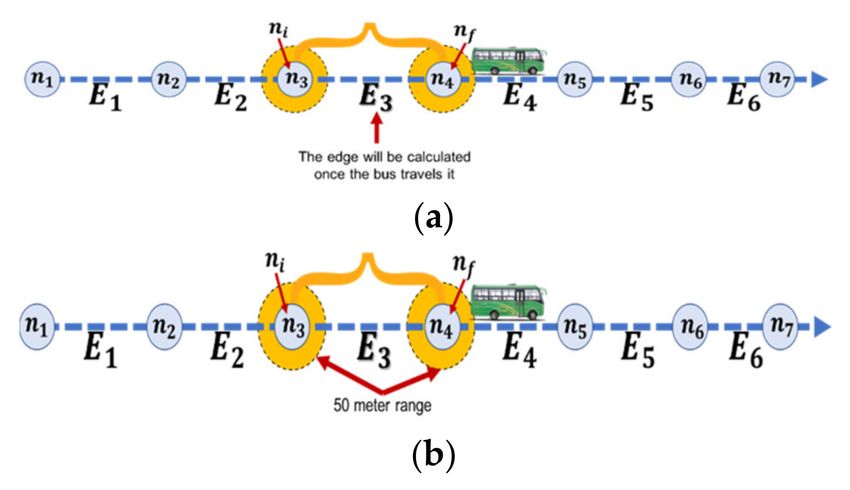
Electronics 2022, 11, 834                                                                                                   9 of 24

                            Figure 5. Circuit diagram of the ultrasonic counter device.

                                 The USoniCont device follows the following process detailed to register when a person
                            boards a bus (Figure 6): if a passenger walks near Sensor 1, a waiting circle is created where
                            a counter is waiting for that user to walk near Sensor 2.

                            Figure 6. (a) The ultrasonic device detecting a “getting on” event; (b) the ultrasonic device detecting
                            a “getting off” event.

                                  When a passenger crosses near Sensor 2 before a previously defined time, the counter
                            will record that action as a “getting on” event. If Sensor 2 does not detect the passenger, then
                            the counter will keep the same value. Figure 6a shows the “getting on” event of a passenger.
                                  The process is similar when a person is getting off the bus. In that case, the passenger
                            will walk near Sensor 2 and then near Sensor 1. Figure 6b shows the “getting off” event of
                            a passenger.
                                  (C) Phase 3. Development of a Context-Sensitive Service
                                  One of the relevant concepts in the design of intelligent systems is context aware-
                            ness [19]. The ability of a system to know the surrounding context enables the system
                            to react and to interact with this context. Thus, a smart software system is able to know
                            the context in which it is being executed and then use this context information to take
                            automated decisions and also react to changes in this environment. This means turning a
                            system into context-sensitive services.
                                  The context-awareness concept is also very relevant in ubiquitous computing systems
                            and environmental intelligence [20–22]. Context awareness is a key concept in the new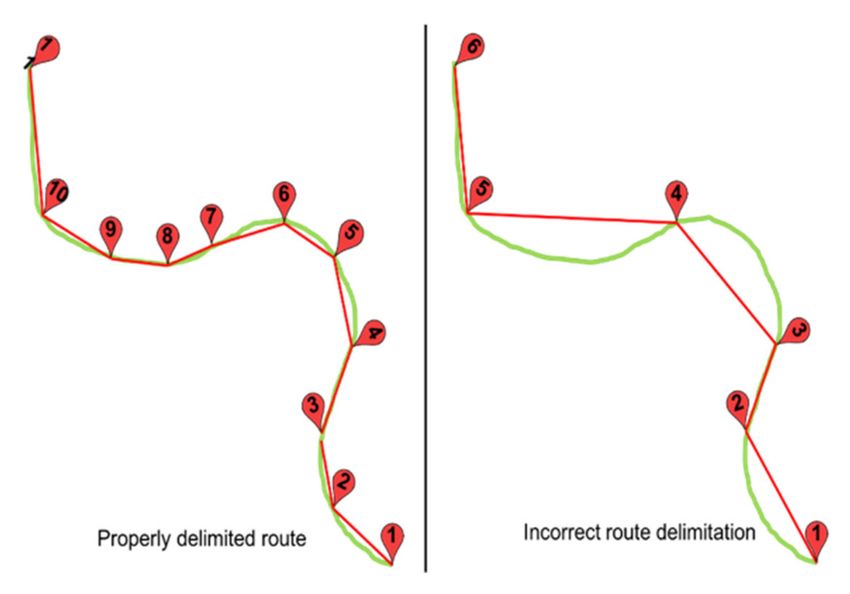
Electronics 2022, 11, 834                                                                                            10 of 24

                            approaches of the Internet of Things where common live objects need to take the context
                            into account in order to communicate with other objects without human intervention.
                                 In the third phase of our proposed methodology, a context-sensitive service has been
                            developed that obtains the context information, preprocesses this information, and finally
                            sends the information of the Urban Passenger Transport to the cloud to be later used by the
                            algorithms for arrival times. These software services need to be installed on the smartphone
                            of the bus driver. The context-sensitive service integrates five functionalities: (a) obtain
                            the data from the ultrasonic counter using the Bluetooth interface, (b) process the data
                            coming from the passenger counter, (c) obtain the context information, (d) send the context
                            information to the cloud, and (e) calculate the current/previous edge in which the bus is
                            currently circulating. These functionalities are explained in detail below:
                            (a)   Obtaining the data from the ultrasonic counter using the Bluetooth interface. This
                                  functionality enables an interface to permit the communication of the bus driver’s
                                  smartphone with the UsoniCont passenger counter in order to obtain the information
                                  of passengers getting on/off. This communication is performed using the Bluetooth
                                  protocol. The proposed interface constantly reads the data produced by the ultrasonic
                                  counter and encodes this data to represent the “getting on/off” events.
                            (b)   Processing the data coming from the passenger counter. This functionality enables an
                                  interface to modify the data of the passenger counter according to the “getting on/off”
                                  events, and it also modifies the availability of the bus seats. The available seat counter
                                  is initialized in each new trip and is modified with the “getting on/off” events. The
                                  number of available seats defines the status of the availability using three different
                                  values: good, medium, and low availability.
                            (c)   Obtaining context information. This functionality obtains the context information
                                  when a change in the GPS position is detected. The context information is the follow-
                                  ing: the GPS position of the monitoring bus, the hour and date when data were sent,
                                  the ID of the monitored bus, the ID of the bus driver, etc. This context information is
                                  obtained from the smartphone of the bus driver as well as from the ultrasonic circuit
                                  counting passengers. Figure 7 shows the context information that is produced by a
                                  change in the location of the bus.
                            (d)   Sending the context information to the cloud. The data that is periodically collected
                                  from the location sensor of the driver smartphone is used to determine the cur-
                                  rent/previous bus location. The context information that is produced by the smart-
                                  phone of the driver and by the passenger counter needs to be sent to a Web Server. To
                                  do this, a web service has been created that is responsible for periodically sending the
                                  context information to a Web server using the JSON format. The original data obtained
                                  from sensors are transformed to a JSON object. This JSON object is continuously sent
                                  over the Internet (using the Smartphone resources) to the server. The context data are
                                  sent every 20 s. The experimentation demonstrates that a shorter time can generate
                                  duplicated data (e.g., the GPS position) and a longer time can result in a lack of data
                                  of the bus position, making it difficult to estimate the arrival time.
                            (e)   Calculating the current/previous edge on which the bus is circulating. This is the
                                  final functionality that is used by bus users to know the current position of the next
                                  bus and the available seating in that bus. The functionalities of this service are the
                                  following: (a) it detects on which edge of the graph representing the route the bus is
                                  located; (b) it detects the time when a bus ends and starts on each edge; and finally,
                                  (c) it detects the direction in which the bus is circulating.
Electronics 2022, 11, 834 11 of 24
Figure 7. Context data produced by a bus on the route.
The processes for detecting the edge on which the bus is located and the previous
edge are presented in detail below:
• An edge is composed of two nodes, which represent two consecutive bus stops on
the route with specific GPS positions on the map. Each time the service receives
the context data, it determines the edge on which the bus is located. To do this,
the service validates if the GPS position of the bus is located between the interval
(NodeStart–NodoEnd) of the edges of a route.
• This service detects the previous edge where a bus is circulating. In other works, when
the edge on which the bus is circulating is detected, the service validates if it is the first
time that the service receives data from the same edge from the same bus, which means
that the bus recently entered a new edge and, therefore, ended the previous edge.
When the service detects that an edge has been traversed, the system calls the al-
gorithm of prediction of arrival times to calculate the time used by the bus to travel the
previous edge from the start node to the end node.
The direction in which a bus is circulating is obtained from the order in which the bus
stops are detected by the system. For example, if the bus is at Node 3 and later the bus
is at Node 4, this means that the bus direction is from point A to point B. Otherwise, the
direction of the bus will be from point B to point A. The service of the Urban Passenger
Transport takes into account the detection of the GPS positions outside of the established
route of each bus. In that situation, the system sends an alert to the bus agency.
Figure 8 shows the situation when a bus finishes traversing Edge E3 using the time tE3.
At the instant in which the bus crosses Node 4 (N4), the context-sensitive service calculates
the time spent by the bus in traversing Edge E3.
Figure 8. Time to travel an edge.
(D) Phase 4. Prediction of Arrival Time Solutions
The main purpose of this approach is to provide information to bus users about the
estimated time needed for the bus to reach the bus stop where the user is located. Therefore,
the main objective of the fourth phase was the development of an algorithm to calculate
the arrival times of Urban Passenger Transport.
The proposed algorithm for the prediction of the arrival time is detailed in two main
parts. The first part of the algorithm refers to the processing of context information captured
by the context-sensitive services, while the second part of the algorithm is related to theElectronics 2022, 11, 834 12 of 24
process executed when the algorithm processes user queries to know the arrival of the
next bus.
The first part of algorithm for processing context information is carried out as follows:
• The context-sensitive service calls for the execution of the algorithm by sending two
parameters: the current edge where the bus is circulating and the edge to be calculated.
• The system database is updated with the edge on which the bus is circulating and the
direction of the route.
• The algorithm verifies the edge to calculate E3 (Called Ec). Figure 9a shows the Edge
E3 that must be calculated once the bus completes the entire edge.
• The travel time of the Ec edge (tEc) is calculated by searching the database for the
time the bus passed through the initial and final nodes (NodeStart–NodoEnd). The
experimentation demonstrated that the GPS position of the bus stops could vary with
respect to the GPS position of the bus. This is because the bus location is not exactly
on the GPS position of the bus stops or because the context data was not sent at the
exact moment when the bus passed by the bus stop. For this reason, the algorithm
searches the database for 50 m around the stops (see Figure 9b).
• The calculation of the time of travel of the bus by an edge is the result of a subtraction.
The formula used is shown in (1).
tEc = tne − tns (1)
• The value obtained (tEc) is averaged with the value of the database (tEdb). The
greater weight should be given to the new value (because it presents the current traffic
conditions) and lower weight should be given to the value stored in the database. The
value of tEdb is calculated using Formula (2). The values 0.6 and 0.4 that modify the
formula are used depending on the current of traffic conditions which increase or
decrease the arrival time.
tEdb = (tEc × 0.6) + (tEdb × 0.4) (2)
Figure 9. (a) Time of the bus to travel an edge; (b) time at which the bus passed the start node and
the end node; (c) search for the closest bus.Electronics 2022, 11, 834 13 of 24
The second part of algorithm, to process the request made by users, is carried out
as follows:
• The user uses the system interface to define a route, the direction, and a stop of the
route. The proposed algorithm is the executed to respond to this user request.
• The system obtains the information of the buses that are close to the user GPS location.
To do this, the proposed algorithm performs a query for the bus that is circulating on
the edge before the point where the user is located. If a bus is not found on that edge,
the algorithm searches the edges after the query node looking for the next bus in the
same route and in the same direction. Figure 9c shows this situation.
• Once the system obtains the next bus arriving to the user’s location, then the edges
that separate the bus from the query node are also obtained by the system in order to
calculate the sum of the times of the edges previous to the user’s location.
• Figure 10 shows an example of the calculation of the arrival time of a bus located
between Edge n5 an Edge n6 to reach the position of a user located at a bus stop
located at Edge n10. The sum of all of the edges t6, t7, t8, and t9 is the time that the
user needs to wait until the bus reaches her/his position at n10.
Figure 10. The calculation of the arrival time.
4. Implementation of the Smart Information System
This section presents a description of the architecture of the smart information system
for mobility. The selected architecture is the Client-Server, where the mobile apps send their
requests to the server and the server performs the processing and sends the answer to the
apps. Figure 11 presents the proposed architecture of the Smart Information System. From
the client-side point of view, the architecture integrates three applications that compose our
solution: The Management Urban Passenger Transport App, Monitoring Drivers Context
Information App, and Passenger Transport App.
The first application, called the Management Urban Passenger Transport App, enables
the owners of bus agencies (concessionaires) to register their routes using the process
defined in the Route Design phase. In this app, the concessionaires need to register drivers
and buses and assign specific buses to a specific traffic route.
The second application, called the Monitoring Drivers Context Information App, is
the app for the bus driver, which carries out the monitoring of the bus location and the
monitoring of the route of the bus. This application is also responsible for sending all of the
context information to the web server.Electronics 2022, 11, 834 14 of 24
Figure 11. Architecture of the smart information system.
The third application, called the Passenger Transport App, allows passengers to check
the arrival time of the next bus coming to the specific bus stop where the passenger is
located at any time.
From the Server-side point of view (Figure 11), a web server was developed that
manages the communication of the interface with the algorithms in order to manage the
context information and the arrival time algorithm for the arrival times of buses. The
process of sending requests and responses to the proposed system is carried out using Web
Services technology.
It is important to point out that this proposed architecture takes into account the
current situation found in most Mexican cities where there is no information about public
transit routes and their schedules. Therefore, the architecture takes into account the design
of the routes for local bus agencies.
The main applications that compose the proposed solution are presented below:
(a) The Management Urban Passenger Transport App
This software application was developed for the bus concessionaires to manage and to
define the routes of a bus in the city and the corresponding bus stops. This app is composed
of two main modules: ManageRoute and ManageDrivers.
• ManageRoutes: This module manages the information of routes, the information of
the bus drivers, and the visualization of the location of the buses in real time. The
users of this module are the concessionaires or the managers. The design of a new
route is performed using the graphical interface of the proposed system. The first
phase of the process is the creation of the new route and the definition of the route
name (Figure 12).
• The second phase of the process for designing a route is to locate the geographical
zone of the route. This service uses the Google map app to show the map of the route
on the smartphone (Figure 13).
• The next step in the process consists of the definition of a location for each one of the
bus stops. The interface permits the users to specify a point on the map, to assign the
name of bus stops, and the number of this stop in the sequence of the complete route
(Figure 14). This process needs to be repeated until all of the bus stops of the route are
specified in the system.
• ManageDrivers: This module is responsible for registering, modifying, deleting and
showing the information of the bus drivers. This module enables the concessionaires
to establish the passenger capacity of the transport units. The interface of the system
enables the definition of specific drivers for a route and the definition of the capacity
of the public buses that compose the designed route.Electronics 2022, 11, 834 15 of 24
Figure 12. Interface for the creation of a new route.
Figure 13. Graphical interface for maps.
Figure 14. Interface to define the location of a bus stop.Electronics 2022, 11, 834 16 of 24
(b) The Monitoring Drivers Context Information App
This software application has been developed to monitor, collect, and send the context
information of each bus that circulates on the route to the Web Server and to store this
information in a database. To do this, the bus driver needs to be logged into the app. This
module periodically communicates the following data to the Web Server: the GPS position
of the bus, the seat availability, the bus unit number and the route on which the bus is
circulating. Figure 15 shows the login interface for the bus driver, the interface for bus
location data, and the information of the passenger counter.
Figure 15. The login Interface for the bus driver and the interface for bus location and passengers.
Once the bus driver is logged into the system, the application enables the bus driver
to know the distance between the next bus and previous bus on the route. Figure 16 shows
the interface, indicating the distance (in time) to the next bus.
Figure 16. Interface for the bus driver.
(c) Passenger Transport App
This software application was developed for the passengers of Urban Transport to
visualize the arrival time of a bus to a specific bus stop where the user is located at any
time. This application needs to be installed on the smartphone of the bus passenger.
This module integrates a user interface on the smartphone to specify the bus line and
direction that needs to be consulted as well as to specify the route and the specific bus stop
where the user is waiting for the bus. The information provided by the app to the users
allows them to make decisions about getting on the next bus or waiting for the following
bus if the current one does not have available seats. Figure 17 shows some views of the
interface of this module. In this example, the system displays the route name, the directionElectronics 2022, 11, 834 17 of 24
of the route, the specific bus stop where the user is located, the predicted arrival time, and
the status of the available seats on the bus.
Figure 17. Some views of the interface of the Passenger Transport App.
5. Tests and Results
This section presents the tests and results of our proposed approach. A realistic scenario
was selected to perform the experimentation of the mobility system on a bus route of a city in
Mexico, specifically in the city of Cuernavaca, which is in the central region of the country.
This city is a good example of most of the common cities in Mexico, where there are no
schedules for public services and, therefore, the arrival times are completely chaotic. The
experimentation considers a real route that crosses the city from south to north.
The first phase for the experimentation was the design of the route (which is called
Route 1) with 66 bus stops: 28 bus stops on the Guacamayas-University journey and 38 bus
stops in the opposite direction (University-Guacamayas journey). Figure 18 shows both
directions of Route 1. The two directions of the route are not symmetrical because some
of the streets on the route are one-way streets. It is important to point out that the route
needs to be designed with a software application because there are no GTFS specifications
for most small Mexican cities. The GTFS specification is only available for big cities, such
as Mexico City or Guadalajara.
Figure 18. Design of the route used for experimentation.Electronics 2022, 11, 834 18 of 24
Eight trips were monitored on this bus route for experimentation; four trips for the
Guacamayas–University journey and four trips for the University–Guacamayas journey.
One relevant point in testing was having very similar traffic conditions in each journey
in order to reduce the error rate in arrival time predictions. To do this, the test for the
journeys in the Guacamayas–University direction were done starting at 18:00 h. and the
journey for the University–Guacamayas direction were done starting at 19:00 h.
As mentioned above, the Guacamayas–University direction is composed of 28 bus
stops. Ten of these bus stops were selected in that direction and another 10 bus stops were
selected in the opposite route (University–Guacamayas) to be monitored in the tests. The
arrival times were determined using the Passenger Transport app and were compared with
the real time of the arrival of the bus to the bus stop. Both the predictions and the real times
were registered in a database for further evaluation.
In the evaluation, the proposed system was used to obtain the expected arrival time of
the next bus. The time when the system is consulted and the time when the bus arrives to
the bus stop are registered. The (Actual arrival time) Real-Time Arrival is the difference
(in seconds) between the time when the software system gives the prediction and the time
when the bus is currently arriving to bus stop. The Predicted Time (Predicted arrival time)
represents the waiting time predicted by the proposed system.
The results obtained for experimentation are presented in Tables 1–8. Each table
represents one of the eight trips: 4 trips for the Guacamayas–University journey and
4 trips for the University–Guacamayas journey. The first column indicates the number
of stops being monitored. The second column indicates the Actual Arrival Time which,
as commented above, represents the difference (in seconds) between the time when the
software system gives the prediction and the time when the bus is currently arriving at bus
stop. For example, in the first row, the time when the system was consulted to predict the
arrival time was 18:18:54 h, and the time when the bus actually arrived to the bus stop was
18:20:14 h. Therefore, the difference between the two times is 80 s. In order to simplify the
visualization, only the difference in seconds is represented in the table. The third column
indicates the Predicted Arrival Time, which represents the waiting time predicted by the
proposed system. In the example of the first row, the time predicted (in our system) for the
arrival time was 79 s. The fourth column indicates the difference between the Actual Arrival
Time and the Predicted Arrival Time, which in the example was 1 s. The Fifth column
represents the absolute percentage error, and the sixth column represents the precision
of the proposed prediction algorithm, which in the example is 98.75%. The difference in
seconds between the estimated and real arrival times was also registered together with the
medium absolute error (MAE) absolute percentage error (MAPE), and the precision of the
prediction for each stop. The average MAE, MAPE, and Precision are specified for each
table, for example, for complete Trip 1, the average precision was 87.2%.Electronics 2022, 11, 834 19 of 24
Table 1. Results obtained for Trip 1 (Guacamayas–University Journey) MAE = ±34 s, MAPE = 12.8%
Precision = 87.2%.
Predicted Difference between Precision of
No. Bus Stop Actual Arrival Time Absolute Percentage Error
Arrival Time Predicted and Actual Time the Prediction
4 80 s 79 s 1s 1.25% 98.75%
6 193 s 171 s 22 s 11.40% 88.60%
7 129 s 102 s 27 s 20.93% 79.07%
9 232 s 241 s −9 s 3.88% 96.12%
11 301 s 274 s 27 s 8.97% 91.03%
12 168 s 168 s 0s 0.00% 100.00%
13 409 s 270 s 139 s 33.99% 66.01%
14 124 s 113 s 11 s 8.87% 91.13%
15 290 s 194 s 96 s 33.10% 66.90%
16 139 s 131 s 8s 5.76% 94.24%
Table 2. Results obtained for Trip 2, Journey: University–Guacamayas. MAE = ±95.3 s,
MAPE = 21.6% Precision = 78.4%.
Predicted Difference between Precision of
No. Bus Stop Actual Arrival Time Absolute Percentage Error
Arrival Time Predicted and Actual Time the Prediction
18 280 s 219 s 61 s 21.79% 78.21%
20 147 s 142 s 5s 3.40% 96.60%
21 81 s 89 s −8 s 9.88% 90.12%
24 693 s 459 s 234 s 33.77% 66.23%
25 121 s 128 s −7 s 5.79% 94.21%
27 156 s 214 s −58 s 37.18% 62.82%
30 695 s 167 s 528 s 75.97% 24.03%
32 181 s 149 s 32 s 17.68% 82.32%
35 245 s 237 s 8s 3.27% 96.73%
38 157 s 145 s 12 s 7.64% 92.36%
Table 3. Results obtained for Trip 2, Journey: Guacamayas–University. MAE = ±34 s, MAPE = 15.7%
Precision = 84.3%.
Predicted Difference between Precision of
No. Bus Stop Actual Arrival Time Absolute Percentage Error
Arrival Time Predicted and Actual Time the Prediction
4 146 s 172 s −26 s 17.81% 82.19%
6 164 s 189 s −25 s 15.24% 84.76%
7 106 s 136 s −30 s 28.3% 71.7%
9 282 s 240 s 42 s 14.89% 85.11%
11 338 s 330 s 8s 2.37% 97.63%
12 208 s 161 s 47 s 22.6% 77.4%
13 513 s 462 s 51 s 9.94% 90.06%
14 111 s 103 s 8s 7.21% 92.79%
15 362 s 290 s 72 s 19.89% 80.11%
16 165 s 134 s 31 s 18.79% 81.21%Electronics 2022, 11, 834 20 of 24
Table 4. Results obtained for Trip 4, Journey: University–Guacamayas. MAE = ±28.7 s, MAPE =
18.8% Precision = 81.2%.
Predicted Difference between Precision of
No. Bus Stop Actual Arrival Time Absolute Percentage Error
Arrival Time Predicted and Actual Time the Prediction
18 237 s 280 s −43 s 18.14% 81.86%
20 129 s 160 s −31 s 24.03% 75.97%
21 78 s 45 s 33 s 42.31% 57.69%
24 656 s 646 s 10 s 1.52% 98.48%
25 122 s 165 s −43 s 35.25% 64.75%
27 141 s 196 s −55 s 39.01% 60.99%
30 460 s 483 s −23 s 5% 95%
32 222 s 206 s 16 s 7.21% 92.79%
35 223 s 250 s −27 s 12.11% 87.89%
38 153 s 147 s 6s 3.92% 96.08%
Table 5. Results obtained for Trip 5, Journey: Guacamayas–University. MAE = ±42 s, MAPE = 20.5%
Precision = 79.5%.
Predicted Difference between Precision of
No. Bus Stop Actual Arrival Time Absolute Percentage Error
Arrival Time Predicted and Actual Time the Prediction
4 185 s 160 s 25 s 13.51% 86.49%
6 160 s 189 s −29 s 18.13% 81.88%
7 96 s 131 s −35 s 36.46% 63.54%
9 228 s 263 s −35 s 15.35% 84.65%
11 443 s 375 s 68 s 15.35% 84.65%
12 208 s 230 s −22 s 10.58% 89.42%
13 462 s 468 s −6 s 1.3% 98.7%
14 115 s 109 s 6s 5.22% 94.78%
15 224 s 407 s −183 s 81.7% 18.3%
16 141 s 130 s 11 s 7.8% 92.2%
Table 6. Results obtained for Trip 6, Journey: University–Guacamayas. MAE = ±59.4 s,
MAPE = 28.9% Precision = 71.1%.
Predicted Difference between Precision of
No. Bus Stop Actual Arrival Time Absolute Percentage Error
Arrival Time Predicted and Actual Time the Prediction
18 242 s 283 s −41 s 16.94% 83.06%
20 211 s 127 s 84 s 39.81% 60.19%
21 130 s 30 s 100 s 76.92% 23.08%
24 584 s 679 s −95 s 16.27% 83.73%
25 106 s 172 s −66 s 62.26% 37.74%
27 149 s 168 s −19 s 12.75% 87.25%
30 527 s 592 s −65 s 12.33% 87.67%
32 251 s 355 s −104 s 41.43% 58.57%
35 242 s 255 s −13 s 5.37% 94.63%
38 156 s 149 s 7s 4.49% 95.51%Electronics 2022, 11, 834 21 of 24
Table 7. Results obtained for Trip 7, Journey: Guacamayas–University. MAE = ±57.7 s, MAPE = 27%
Precision = 73%.
Predicted Difference between Precision of
No. Bus Stop Actual Arrival Time Absolute Percentage Error
Arrival Time Predicted and Actual Time the Prediction
4 126 s 163 s −37 s 29.37% 70.63%
6 157 s 194 s −37 s 23.57% 76.43%
7 92 s 99 s −7 s 7.61% 92.39%
9 272 s 253 s 19 s 6.99% 93.01%
11 271 s 524 s −253 s 93.36% 6.64%
12 243 s 213 s 30 s 12.35% 87.65%
13 548 s 494 s 54 s 9.85% 90.15%
14 86 s 106 s −20 s 23.26% 76.74%
15 196 s 302 s −106 s 54.08% 45.92%
16 145 s 131 s 14 s 9.66% 90.34%
Table 8. Results obtained for Trip 8, Journey: University–Guacamayas. MAE = ±68.8 s,
MAPE = 33.8% Precision = 66.2%.
Predicted Differences Between Precision of
No. Bus Stop Real Time Arrival Absolute Percentage Error
Time Arrival Predicted and Real Time the Prediction
18 234 s 319 s −85 s 36.32% 63.68%
20 152 s 231 s −79 s 51.97% 48.03%
21 112 s 112 s 0s 0% 100%
24 599 s 622 s −23 s 3.84% 96.16%
25 95 s 137 s −42 s 44.21% 55.79%
27 158 s 181 s −23 s 14.56% 85.44%
30 245 s 546 s −301 s 122.86% −22.86%
32 206 s 329 s −123 s 59.71% 40.29%
35 243 s 252 s −9 s 3.7% 96.3%
38 151 s 152 s −1 s 0.66% 99.34%
The performance of the algorithm to predict the arrival times was measured by
using the Root Mean Square Error (RMSE), Mean Absolute Error (MAE), Mean Absolute
Percentage Error (MAPE), and Precision. Table 9 shows the results of the eight trips
analyzed in the experimentation.
Table 9. Results obtained for Journeys: University–Guacamayas, Guacamayas–University.
Direction Trip RMSE MAE MAPE Precision
University 1 ±55 s ±34 s 12.8% 87.2%
Guacamayas 2 ±184 s ±95 s 21.6% 78.4%
University 3 ±38 s ±34 s 15.7% 84.3%
Guacamayas 4 ±32 s ±28 s 18.8% 81.2%
University 5 ±65 s ±42 s 20.5% 79.5%
Guacamayas 6 ±69 s ±59 s 28.9% 71.1%
University 7 ±91 s ±57.7s 27% 73%
Guacamayas 8 ±110 s ±68 s 33.8% 66.2%Electronics 2022, 11, 834 22 of 24
The overall results of the eight journeys of the test were the following: RMSE = ±93 s,
MAE = ±52 s, MAPE = 22.4%, and Precision = 76.6%.
The overall precision of the proposed approach was 76.6%, which is a very promising
value for the initial experimentation of the solution. Several traffic issues were detected
as the possible source of the difference between the predicted times and the real times:
(a) Traffic in Mexican countries can be very variable from one minute to the next. In most
cases, these very bad traffic conditions modify the time needed for a bus to reach a bus
stop. (b) If several segments of the streets of the analyzed route are in a very bad condition,
the bus is obligated to circulate in these bad segments, and it spends more time reaching
the bus stop. (c) In several cases, some cars were parked in the zones established as bus
stops. This means that buses needed to wait in order to find another place to stop.
The tests were also made to measure the performance of the ultrasonic counter device.
To do this, the device was installed on a public bus that made five journeys. In each one of
the journeys, the passengers were manually registered, and we also obtained the value of
passengers detected by the ultrasonic counter for comparison. The results of precision in
“getting on/off” events are presented in Table 10.
Table 10. The results obtained of the passenger counting.
Precision in the Counting of People Precision in the Counting of People
Trip
Getting on with USonic Getting off with USonic
1 91.7% 89.8%
2 91.2% 87.7%
3 89.7% 94.8%
4 97.3% 89.1%
5 88.5% 86.9%
The results of the proposed ultrasonic counter look promising for managing the
availability of seats on a public bus. More experimentation in several bus agencies is
needed to demonstrate the feasibility in practice.
6. Scientific Contributions
This section of the paper highlights the scientific contribution achieved in this
research work.
(a) The location of buses and the estimation of the arrival time is completely based on
sensors that can be found in any of the current smartphones. The proposed approach
could be easily used in cities where there is no infrastructure to manage the real-time
location of public buses.
(b) A low-cost device was developed to count the number of passengers traveling on a
specific bus. The device was developed using open technologies that can easily be
replicated by novice students in electronics or computer science.
(c) The evaluation of the proposed approach was performed on a real route in Mexico. It
is important to point out that current conditions in Mexican routes are chaotic since
there are no scheduled routes to determine the expected time that buses need to arrive
to each bus stop, then the current arrival times are unpredictable.
7. Conclusions and Future Work
Mobility in cities is one of the factors that has allowed economic development and
timely access to goods and services. However, mobility is also one of the main problems
in current cities. The issues related to mobility are even worse in the cities of developing
countries. Several developed cities have smart mobility systems that use software and
hardware infrastructure to monitor public transport buses and to provide this information
to the passengers about arrival times. However, in developing countries, it is not possibleYou can also read