A Study on Increase in the Usage of OTT Streaming Services
←
→
Page content transcription
If your browser does not render page correctly, please read the page content below
International Journal of Research in Engineering, Science and Management                                             142

               Volume 4, Issue 8, August 2021
               https://www.ijresm.com | ISSN (Online): 2581-5792

                A Study on Increase in the Usage of OTT
                          Streaming Services
                                                  Shaurya Parnami1*, Tushar Jain2
         1,2
            Student, Symbiosis Centre for Management Studies, Symbiosis International (Deemed) University, Pune, India

   Abstract: OTT Platforms have been becoming more and more            as Scam 1992: The Harshad Mehta Story and Mirzapur S2 have
popular in India due to locally-oriented content, low costs, and the   proven that Indian audiences are ready for largely content-
widespread use of 4G (and 5G in the future), and are predicted to      oriented television shows rather than the traditional Indian
grow even more. Streaming Services such as Netflix, Amazon
Prime Video, and Hotstar dominate the market, with others such         serials.
as AltBalaji and Voot also becoming more popular. During the              Our study aims to ascertain the factors behind this increase
COVID-19 pandemic, the number of active subscribers to these           by surveying a sample population.
OTT streaming platforms has increased by almost 6 million users
in a single year. This study surveys a sample population of 200                             2. Literature Review
respondents and aims to ascertain whether their usage of OTT
platforms has increased or not, by how much time, and the                 Manisha Pandit (2020) explores in her study that OTT
perceived reasons behind this increase. The study found that the       Platforms have seen a significant annual growth of more than
subscribers of these OTT platforms had increased their usage by        22% due to not only ease of availability but also pocket friendly
almost 3 hours on a daily average due to the pandemic, citing          subscription plans and increase in local regional content, which
various reasons such as ‘Boredom’, ‘Excess time’, ‘New content’        was not the case just a few years ago (Dr. Virendra Khanna,
etc. This increase in usage is very encouraging for the new players
in the market to launch their streaming services and foreign OTT       2009).
platforms looking to launch in India (for ex. Hulu and HBO Max).          There is a large number of different streaming services
It means that there is a demand for such services in India.            offering different types of content, at different prices, but
                                                                       (generally speaking) all targeting the same audience. This
  Keywords: Amazon Prime, Decrease in the usage of cable,              means that there is a ferocious competition among streaming
Disney Plus, Hotstar, Netflix, OTT, Streaming services.                service providers wanting to capture the maximum market
                                                                       share (Sundaravel E. and Elangovan N, 2020).
                         1. Introduction                                  This competition is very dynamic and fast-changing.
   The onset of the COVID-19 pandemic has led to an increase           According to a study conducted in 2018 (Quresh Moochhala),
in the usage of the internet, not only for work from home but          Amazon PrimeVideo was the most popular OTT streaming
also for entertainment purposes. Streaming platforms such as           platform in India, but today Disney+Hotstar has around 40%
Netflix and Amazon Prime have increased their user base, with          market share. This volatility is due to a mix of various factors
new streaming giants such as AppleTV and Disney+ entering              such as changes in pricing and improvement of content. There
the market and creating a strong foothold in the market.               are 24 million OTT users in India and the market for OTT
   In less than half a year of operation, Disney+ has managed to       subscription had been projected to grow to Rs. 4000 Crore by
gain 95 million subscribers, surpassing the likes of Hulu and          2020 (Dasgupta and Grover, 2019).
HBO Max. With films and television series exclusive to these              There are many factors which have led to this drastic increase
platforms releasing almost every week, this number is expected         in streaming services such as Netflix, Amazon Prime Video,
to grow even further in the coming years.                              ALTBalaji, Zee5, and Disney+Hotstar. These factors include
   India was no exception to this spike in OTT usage. The              cost, availability, content, perceived usefulness and cost
country witnessed a 60% growth in paid OTT streaming                   (Bhullar and Chaudhary, 2020). Many similar studies
services during the pandemic, with more than half of these new         concluded the same data for these findings (Rohit Jacob Jose,
users likely to continue using the service, according to the           2019) and (Dr Paramveer Singh, 2020).
annual M&E report by the Boston Consulting Group (BCG)                    This increase is mostly thanks to millennial customers, who
along with the Confederation of Indian Industry (CII). Some of         are estimated to spend around 2 hours watching OTT platforms
the most popular streaming sites in the country, such as Netflix       every day. For example, talking specifically about Netflix,
India, Disney+ Hotstar, AltBalaji, Voot, Zee5, Sony Liv etc. all       (Sidneyeve Matrix, 2014) found in a study people watch Netflix
saw an increase in subscribers, largely owing to the Indian            content the day it is released, whether it is a new episode of an
targeted content. Particularly, the popularity of new shows such       ongoing TV Show, a movie, or a Netflix Original. Young

*Corresponding author: parnamishaurya@gmail.com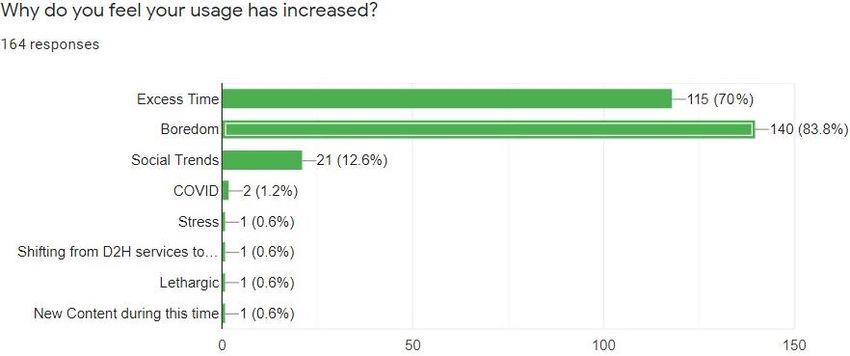
S. Parnami et al.                     International Journal of Research in Engineering, Science and Management, VOL. 4, NO. 8, AUGUST 2021 143

customers also prefer OTT streaming services over traditional         Data Collection since some data (in the form of Research
cable television services, due to huge library of content and         Papers) has been taken from other sources such as online
affordable plans (Sadana and Sharma, 2021).                           journals, research publications etc.
   We are at the onset of a revolutionary change in the way we        3) Research Method
consume entertainment. Sean Flanagan (2018) compares the                 Our Research includes aspects of both Qualitative and
experience of watching a movie at home vs watching it in              Quantitative research.
theatres. He mentions that cinemas are trying to retain                  Qualitative: Research is carried out to ascertain preference
customers by enhancing the movie-goer experience – better             or liking, i.e., qualities of the data. Our questionnaire aims to
seating, the desire to watch films on the big screen and the          ascertain certain qualitative aspects of a subscription to OTT
ability to watch movies as soon as they release.                      Streaming Platforms such as the reasons behind subscribing to
   Furthermore, consumers have also shifted from Physical             any platform.
DVDs and Blu-Ray Discs to subscription-based streaming                   Quantitative: To figure out percentages of sample population
platforms, as they are getting more quantity of content from          which preferred one option over another, using numbers. The
relatively the same amount of money (Terje Gaustad, 2019).            study aims to quantify the size of the user base of these OTT
With the increase in the content library of these platforms, the      Streaming Services.
consumers have shifted from watching local content to                 4) Research Design
international content, which thanks to the internet is just as           Exploratory: This is a Research Design about a research
easily available as local content.                                    problem when there are only a few studies to refer to. The focus
                                                                      is on gaining familiarity with the subject.
A. Research Gap                                                       5) Data Processing
   This paper aims to collect responses from only respondents            Data is being processed by Google Forms. This would help
between the ages of 16-25, as youth comprises a large target          us in an easier analysis of raw data.
base for these OTT streaming platforms. The other papers did          6) Data Collection
not consider this age restraint. The study will be quite                 Primary Data: Primary Data in the form of Survey
interesting and important for organizations offering such                Secondary Data: In form of a Literature Review.
services, as this will not only let them gain insight into their      7) Data Collection Tool
potential customers but also understand which factors attract            A questionnaire is the most suitable method for collecting
them (whether the consumers are more content-oriented, price-         responses from a vast sample population. It should be
driven, indifferent etc.).                                            convenient, quick and easy to fill. There are many online
   The study will also aim to ascertain which platforms are the       questionnaire tools available to the general public. Out of these,
most popular among the respondents, and the reasons behind            we found that Google Forms was one of the easiest tools at our
their preference.                                                     disposal.
                                                                         Secondary data was collected through online search engines
B. Research Methodology
                                                                      for scholarly articles and online libraries and depositories.
   Research Methodology refers to those specific techniques or        These include EBSCO, Google Scholar, Web of Science, Jstor
procedures which are used to identify select process and              etc.
analyze information on a specific subject. The research               8) Practical Implementation
methodology section of a Research Paper is used to familiarize           This increase in the usage of OTT Platforms would not only
the reader with the various tools, procedures and processes by        encourage the emergence of new streaming services in India but
the Author(s) plan to conduct their research on a given topic.        would also encourage Foreign Streaming Services which are
This includes identifying the type of Research Design, Methods        currently not available in India (such as Hulu, HBO Max etc.)
of Data Collection and limitations of the research if any. This       to view India as an emerging potential market.
provides important information to the reader in a summarized
way.                                                                  C. Data Interpretation and Analysis
1) Research Objective                                                    Upon carrying out the actual survey, we received 200
   The purpose of setting a research objective is to provide a        responses from all over India and the conclusion has been
direction to the study. The inclusion of the Research Objective       drawn based on data collected from the same.
enables us streamline relevant information in a cohesive and             The data received is presented as follows:
comprehensive manner.
   As such, our research objective is to ascertain whether the
usage of OTT Platforms has increased during the COVID-19
Pandemic and by how much, from a set of sample population.
2) Research Type
   Primary Data Collection: The study involves Primary Data
collection as data has been collected first-hand through a
questionnaire.
   Secondary Data Collection: The study involves Secondary
                                                                                        Fig. 1. Data representation for Question 1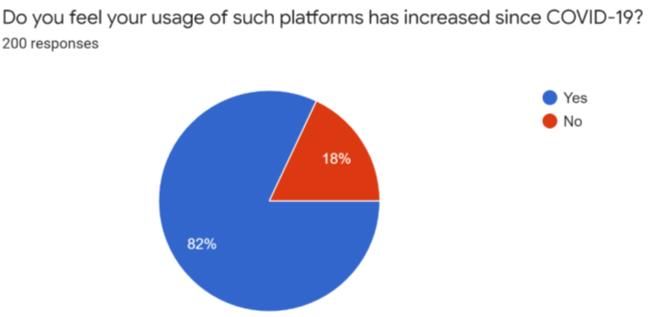
S. Parnami et al. International Journal of Research in Engineering, Science and Management, VOL. 4, NO. 8, AUGUST 2021 144
94.5% of the respondents (189 People) answered that they population subscribed to these services directly as a result of
were subscribed to at least 1 OTT Streaming Service. Out of COVID-19.
200, only 11 people said that they had not paid for any OTT
Streaming Services. This shows us that Streaming Services are
very popular among the general population.
Fig. 5. Data representation for Question 5
More than half of the population comprises people who
Fig. 2. Data representation for Question 2 spend anywhere between 1-4 hours of their day using the
streaming services.
Out of the 189 respondents who were subscribed to at least 1 Very few respondents use these streaming services for more
OTT Streaming Platform, 19 were subscribed to just 1 platform, than 5 hours.
44 were subscribed to 2 Platforms, 64 Were subscribed to 3
Platforms and 62 were subscribed to 4 or more Platforms.
Since more than half of the respondents were subscribed to 3
or more OTT Platforms, we can assume that they might be
willing to subscribe to new streaming services which may
launch in the Country.
Fig. 6. Data representation for Question 6
Over 80% (164 out of 200) of the respondents feel that their
usage of OTT Platforms has increased during this Pandemic,
while 36 respondents (out of 200) answered ‘No.’
Fig. 3. Data representation for Question 3 Out of the respondents who chose ‘No’, 11 were those who
were not subscribed to any streaming service at all. This means
When asked to name some reasons for subscribing to a that 25 people did not feel that their usage of OTT Platforms
particular Streaming Service, more than 83% of the respondents has increased.
cited the strongest factor. The increase in usage and the reasons behind it have been
Affordability was also a strong influencer in their purchasing discussed in the subsequent questions.
habits with more than half the population selecting “Low Cost.”
Ease of Availability and Social Trends was also cited as some
of the factors influencing their purchasing decisions.
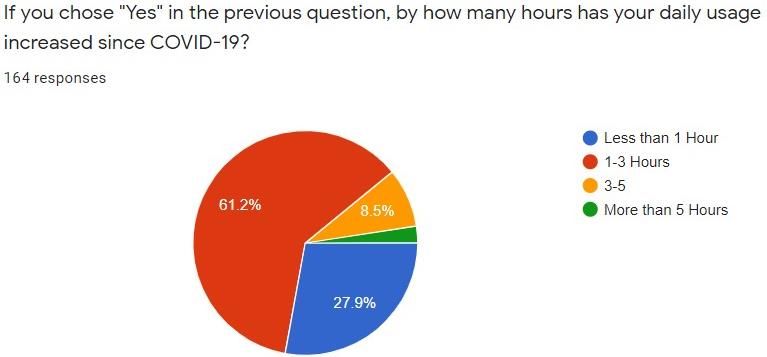
Fig. 7. Data representation for Question 7
Fig. 4. Data representation for Question 4
Only 4 people felt that their usage of OTT Streaming
Out of 189 respondents, 167 were pre-existing customers of Services Increased by more than 5 hours.
at least 1 OTT Streaming Service. However, 22 respondents 14 People felt that the increase in their usage was between 3
stated they subscribed to these platforms after the COVID-19 to 5 hours daily.
Pandemic hit the country. This means that 11% of the sample 46 People felt that their usage increased by less than 1 hour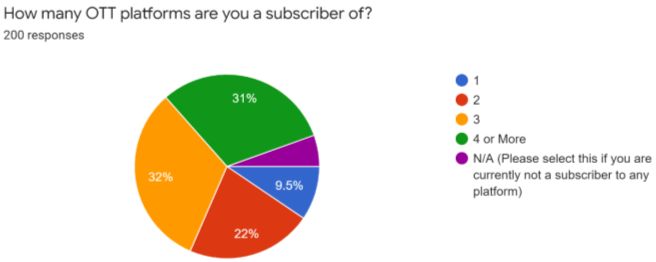
S. Parnami et al.                              International Journal of Research in Engineering, Science and Management, VOL. 4, NO. 8, AUGUST 2021 145

daily.                                                                         increased their usage of OTT Streaming Platforms during the
   More than half of the respondents felt that the increase in                 pandemic citing various reasons but majorly ‘boredom’ and
their usage was between 1 to 3 hours daily.                                    ‘excess time.’ This means that there is a high demand for such
                                                                               streaming services. This is extremely relevant to the
                                                                               organizations looking to enter the Indian Market for Streaming
                                                                               Services because this study proves that there is not only a high
                                                                               demand but also a high usage rate of such Platforms.

                                                                                                              References
                                                                               [1]  Dasgupta, D., & Grover, D, Understanding adoption factors of over-the-
                                                                                    top video services among millennial consumers. International Journal of
                                                                                    Computer Engineering and Technology, 10(1), 2019.
                                                                               [2] Flanagan, S. (2018). Streaming Services, Binging, and Cultural
                    Fig. 8. Data representation for Question 8                      Consequences
                                                                               [3] Gaustad, T. (2019). How streaming services make cinema more
   When asked about some of the potential reasons behind the                        important: Lessons from Norway. Nordic Journal of Media Studies, 1(1),
                                                                                    67-84.
increase in their usage, around 70% of the respondents                         [4] Matrix, S. (2014). The Netflix effect: Teens, binge watching, and on-
responded with ‘Excess Time’, with more than 80% also citing                        demand digital media trends. Jeunesse: Young People, Texts, Cultures,
‘Boredom’ as a major reason. A few others responded with a                          6(1), 119-138.
                                                                               [5] Pandit, M. Beyond Television and Cinema: Audience Evolution in The
variety of reasons such as ‘Stress’, ‘Lethargic’, ‘New Content                      Streaming Age.
During this Time’ etc.                                                         [6] Rohit Jacob Jose (2020). Factors influencing the shift from traditional TV
                                                                                    to OTT Platforms in India
                                                                               [7] Singh, P. (2019). New Media as a Change Agent of Indian Television and
                3. Major Findings and Conclusion                                    Cinema: A study of over-the-top Platforms. Journal of Content,
   The study “Increase in the Usage of OTT Streaming                                Community and Communication, 9, 131-137.
                                                                               [8] Khanna, V. (2017). A Study On Factors Affecting Subscription Rates of
Services” reveals that 82% of the sample population feels that                      Netflix in India: An Empirical Approach. Delhi Business Review, 18(1),
their usage of these OTT Platforms has increased. The majority                      83-100.
of these users feel that their usage has increased between 1 to 3              [9] Arshan Bhullar, Ritika Chaudhary. (2020). Key Factors Influencing
hours every day. The study also found that a whopping 63% of                        Users’ Adoption Towards OTT Media Platform: International Journal of
                                                                                    Advanced Science and Technology, 29(11s), 942 - 956.
the users are subscribed to 3 or more OTT Streaming Services                   [10] Moochhala, Q. (2018). The future of online OTT entertainment services
out of which 22 respondents subscribed to at least 1 service after                  in India. Actionesque Consulting, Pune–India.
the pandemic hit the country. The factors contributing to this                 [11] Sadana, M., & Sharma, D. (2021). How over-the-top (OTT) platforms
                                                                                    engage young consumers over traditional pay television service? An
decision of subscribing to a streaming service include Content,                     analysis of changing consumer preferences and gamification. Young
Low Cost and Availability with ‘Content’ being the factor                           Consumers.
affecting the majority of users                                                [12] Sundaravel, E., & Elangovan, N. Emergence and future of Over-the-top
                                                                                    (OTT) video services in India: an analytical research.
   The majority of the subscribers to these platforms have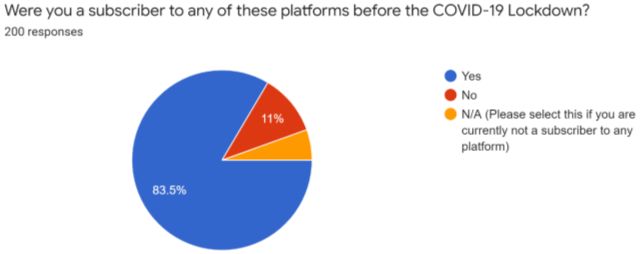
You can also read